Picking the right cloud tool can cut costs, follow rules, and make systems run better. With 84% of UK firms using 'cloud smart' plans, watching over many cloud setups is key. Here are some brief points on the top tools:
- Prometheus: Free, open to all, great for many cloud setups with custom tags and numbers.
- Datadog: Does it all in one place, gives live data, tracks costs, and works with more than 850 tools.
- New Relic: Live tracking with news every five seconds, strong many-cloud help, and tools to know costs.
- Amazon CloudWatch: Best for those who use AWS, with pay-as-you-go costs and GDPR okay.
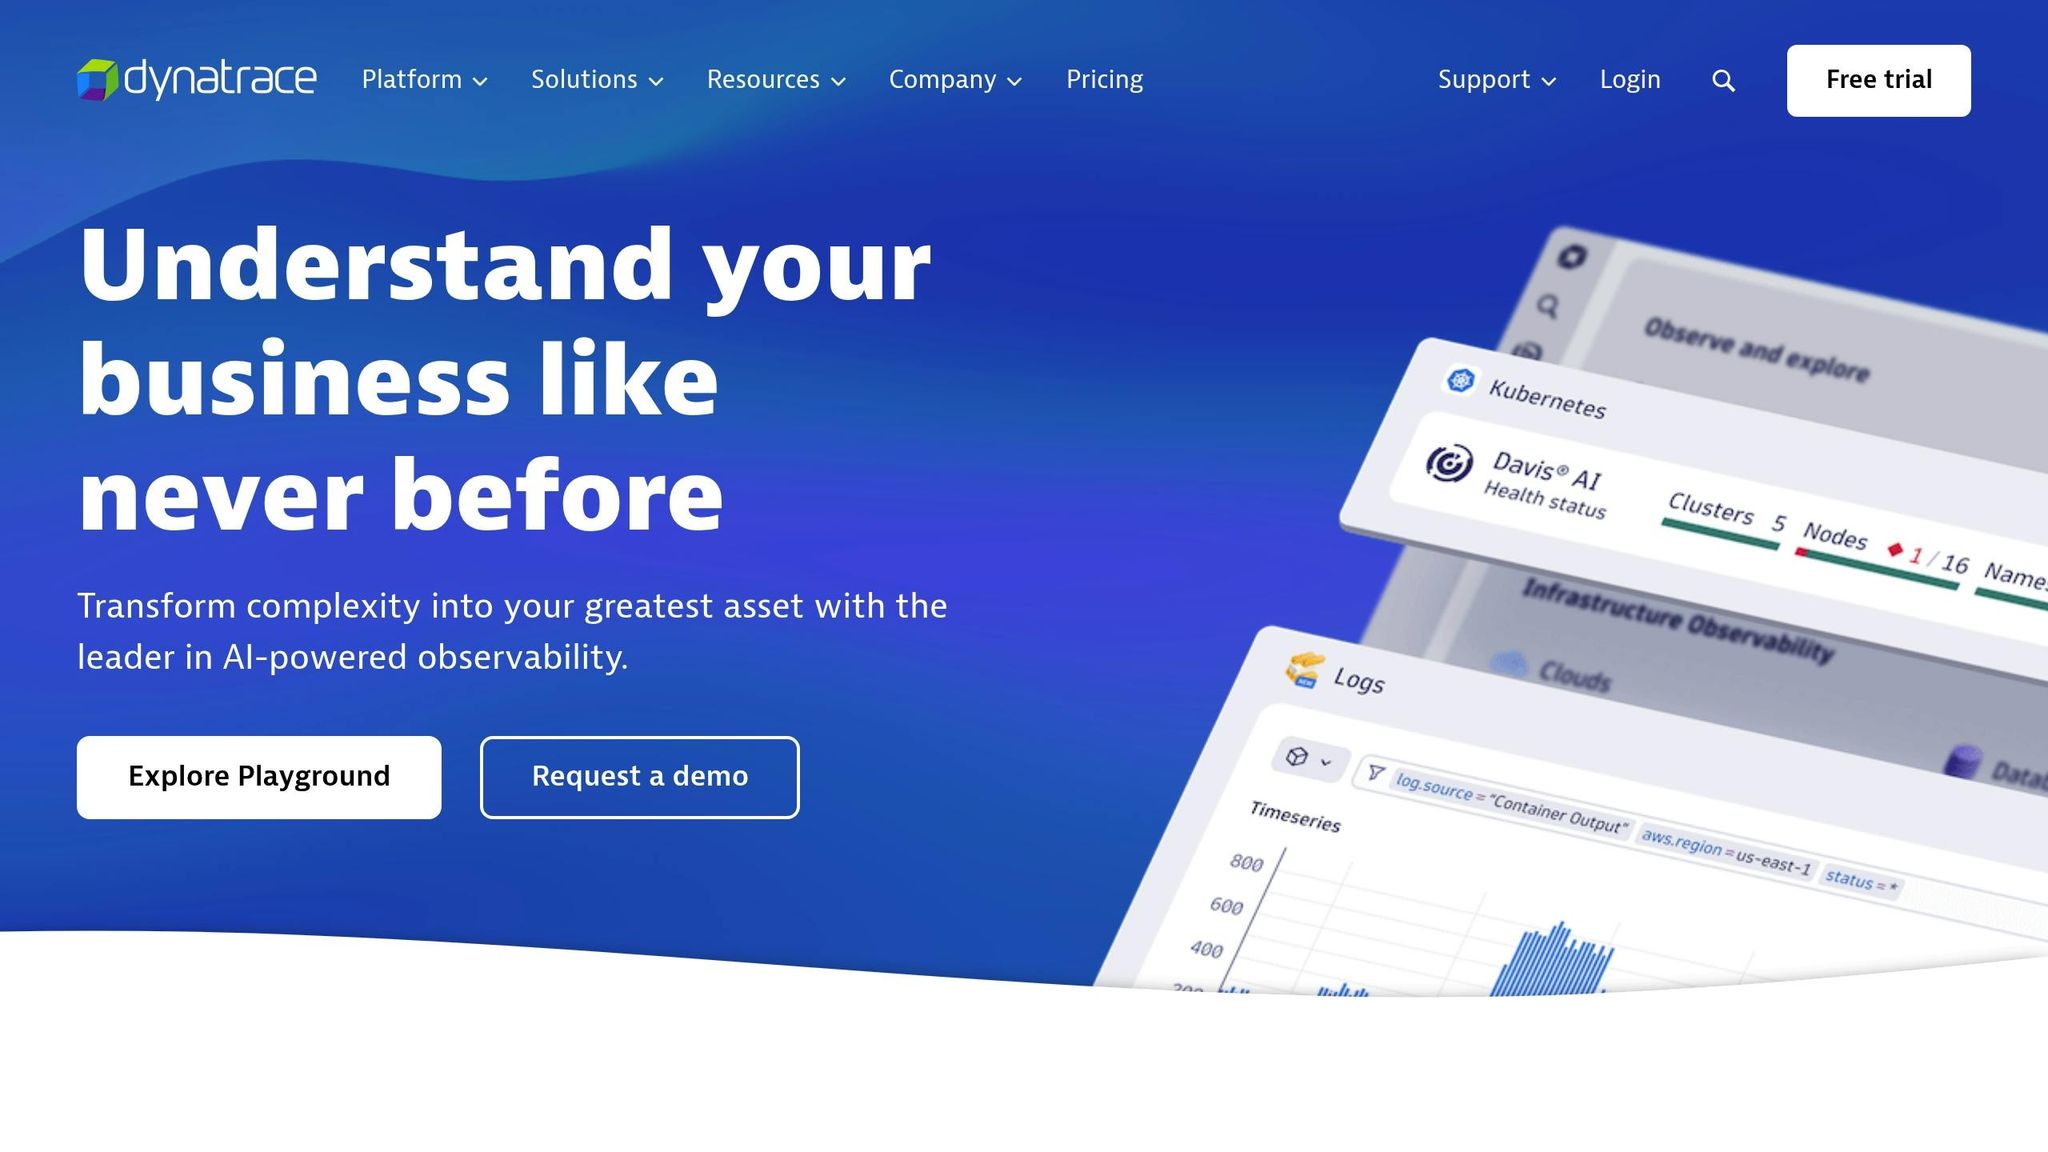
- Dynatrace: AI-driven tips, checks that follow rules on their own, and top cost control.
Quick Look
| Tool | Data Keeping | Cost to Use | Rules OK | Best for |
|---|---|---|---|---|
| Prometheus | Keep it yourself | Free, but pay to run | You pick, ISO 27001 | Many clouds at once |
| Datadog | EU/UK pick | £11.25 per host each month | ISO 27001, GDPR | Big business |
| New Relic | EU/UK safe | Start at £49/user/month | ISO 27001, GDPR | Watch data all the time |
| CloudWatch | AWS London spot | Pay as you go | ISO 27001, GDPR | Lots of AWS use |
| Dynatrace | EU/UK pick | £8.25 per host monthly | Auto GDPR check | Tough multi-cloud spot |
Tip: Begin by trying out free trials to check things like alerts, dashboards, and ways to handle costs. The best tool will fit your rules needs, money plans, and growth aims.
Popular DevOps Monitoring Tools in 2024
1. Prometheus

Prometheus is a free toolset made for watching and giving alerts, made just right for cloud-based setups. Since joining the Cloud Native Computing Foundation (CNCF) in 2016 and moving up to a full project, it has gotten a lot of notice.
In the last few years, Prometheus has appeared as a bespoke standard for application metrics and monitoring.
– Garry Forsyth, Product Director, IG CloudOps [3]
Immediate Data Gathering and Study
Prometheus is great at getting and keeping data about time in a pull way with HTTP. Its query tool, PromQL, lets you look at data right now. It does all this by itself, without needing outside help for storing info []. It's made as a solo server, so it works well even without other services [].
Prometheus is a powerful, open-source tool for real-time monitoring of applications, microservices, and networks, including service meshes and proxies.
– Franz Knupfer, Senior Manager, Technical Content Team, New Relic [1]
To use Prometheus well, you can add your own tags to data and set alerts to spot and fix problems early [1]. This feature makes it a top pick for handling data in many cloud spots.
Multi-cloud Help and Mix
Prometheus is made to fit the ever-changing cloud spots, growing well across AWS, Azure, Google Cloud, or mix modes [2]. A big plus is that it can watch apps on many cloud services at once [2]. For instance, IG CloudOps, a UK group, has used Prometheus in its CloudOps setup since 2016, mixing it well with its cloud care services [3].
The tool does well in its active open-source world, with many hooks and mixes for lots of tech types. This makes it a solid option for the varied tech sets UK firms often use [1]. Prometheus also works well with Grafana, making dashboards that turn simple data into clear plans. For full view, it can join with tools that check logs, traces, and app health [1].
A real use case is seen at Hyper Talent Solutions Ltd, which picks Prometheus for watching its setup and logging needs [4].
2. Datadog
Datadog brings infrastructure data, logs, and metrics together in a cloud setup that's grown popular with UK groups. They use it to make monitoring easier in complex cloud systems. It's designed for a good view of real-time data and works well with many cloud types.
Quick Metric Gathering and Study
Datadog is made to manage real-time data from all your tech gear. Its easy-to-use boards let teams check detailed metrics and events right as they come. By working on data right away, the tool makes sure teams know about things fast. This gives insight into everything from app code behind the scenes to how users deal with the system and outer systems. With more than 850 supported items and a data keep of 15 months, it is a strong base for looking at trends and planning space and power needs.
The clean, easy to use interface allows anyone on our development team to create a Datadog dashboard, start sending metrics from their program, and really understand in fine-grain detail what that program is doing.
– Calvin French-Owen, CTO & Co-Founder, Segment[5]
Datadog also has tools and an API, making it easy to add events to current plans, helping teams always see how their systems perform.
Multi-cloud Help and Mixing
Handling many cloud setups is easier with Datadog. It joins info from many places and has built-in ways to connect with AWS, Google Cloud, Azure, and Alibaba Cloud. Teams can sort and look at info by service and zone for a full view. On 9th April 2025, Datadog brought in better BigQuery watching, letting people track use by project and find cost factors. This adds to its 35+ Google Cloud mixes.
Datadog has consistently helped Google Cloud customers gain deep operational visibility and improve application performance by delivering innovative monitoring solutions that drive customer success.
– Kevin Ichhpurani, President, Global Partner Ecosystem, Google Cloud[6]
Cost Watching and Being Clear
Datadog does more than just check on how systems run; it gives tools for deep cost control too. For groups that want to cut cloud cost, its Cloud Cost Management tool links cost with track data. This lets tech and FinOps groups see all costs, use resources well, and link costs to certain products, services, or teams. For UK groups, the MakeCloud Resell Program makes paying easy by changing USD prices to GBP after the Wise rate and cuts off £1 per host on new month deals[9].
These cost control tools really save money. For one, Holland & Barrett kept over £60,000 on their Datadog spend[8]. Also, a team cut down their AWS costs by 40% in just one hour:
In an hour, we cut our total AWS costs by 40 percent. When you have a tool that's very fast, integrates with your cloud provider, and lets you understand where you spend your money, it's very easy to dig deep into utilisation of your compute resources.
– Alexander Tilkin, Cofounder and CTO, Complyt[7]
With tools like Tag Pipelines and custom monitors, groups can act fast when costs shift. Datadog also spots resources that no one uses, moves old systems, and makes infrastructure work better to help save money.
3. New Relic

New Relic works with real-time data and helps show how systems are doing. In the UK, groups get data updates every five seconds, which lets them see things almost right away. By mixing data about systems and how apps work, the platform helps teams really get their cloud setup.
Real-time Data Get and Look
New Relic's tools give a deep view of system health and any changes. With updates every five seconds, it checks on CPU use, memory, load, and tasks, aiding teams to find and fix issues fast. The platform also ties app data - like usage, errors, and speed - with system data and changes. It fits well with tools like Prometheus and StatsD, making it better. Smart alerts, using tags and special data, make sure teams can act fast when new problems come up.
With New Relic's all-in-one infrastructure monitoring solution, we can diagnose host-driven performance issues by correlating the health of our applications and hosts in real time, quickly detect anomalous behavior, and deploy fixes - all while reducing operational expenditures.
– Rizwan Nazir, Director of SRE Engineering Operations at DigiCert[10]
The platform uses four main data kinds - metrics, events, logs, and traces (MELT) - to show a full look at system health and how it works. This way of using data helps it blend well with many cloud setups.
Help for Many Clouds and How They Fit Together
New Relic makes its real-time checks better for setups with many clouds, working well with systems like AWS, Azure, and Google Cloud. This puts it ahead as a top pick for groups handling tough, many-cloud setups. With 89% of firms now using many-cloud plans, having a tool that makes moving easier and makes things clearer is key.
The Smart Watch-Over Platform takes what it knows right to the tools teams use, giving a clear view of cost moves, what causes them, and how they impact the many-cloud setups.
Enterprises are in a multi-cloud, multi-platform world where data is exploding and stored in a multitude of places.
– New Relic CEO Ashan Willy[11]
New Relic helps with mixed cloud setups, letting groups watch their systems and apps on both open and closed clouds. It has over 780 ways to link and more than 50 tools in one spot. This lets teams keep an eye on many kinds of setups from just one place.
Tracking Money and Clear Costs
In February 2025, New Relic showed a new tool, Cloud Cost Intelligence (CCI). It lets groups see and study cloud cost info as it happens. Tied to the Smart Watch Platform, CCI offers quick views on how money is spent and aids in better cost tracking.
Businesses are under pressure to control costs and maximize value from all angles within their multi-cloud environments - where data volumes are exploding alongside the growing use of AI.
– Manav Khurana, New Relic Chief Product Officer[12]
The Cloud Optimize tool goes even deeper by using data from sensors and cloud service APIs to keep pricing and size info for virtual machines up to date. One group saved a lot of money across four accounts by picking the right sizes, and another cut its cloud cost by 40% using Cloud Optimize.
In the UK, New Relic has a simple price plan: £49 per main user each month for the Standard Level (which comes with 100 GB of data) and £349 for each full platform user a month for the Pro Level with more options. Any extra data over the set amount costs £0.30 per GB. Teams can keep an eye on their use with the platform's dashboard, set how long to keep logs, and make alerts for when data goes too high, helping them control spending better.
Need help optimizing your cloud costs?
Get expert advice on how to reduce your cloud expenses without sacrificing performance.
4. Amazon CloudWatch

Amazon CloudWatch is built into AWS to keep watch over AWS tools and apps. For groups that use Amazon's base, it's key for keeping things running smooth and knowing how things work.
Real-time Metric Collection and Analysis
CloudWatch fits right into AWS, giving real-time watching tools. It shows info and logs each second, and keeps metric data for up to 15 months [50, 52]. This helps groups quickly handle changes in how things perform. Tools like Metric Math and Metrics Insights let users do hard math and searches, while custom boards show metrics and logs to help find main issues fast. Also, its alert system and CloudWatch Events help set up fast fixes to stops, cutting down time when things are down.
CloudWatch is a service that monitors applications, responds to performance changes, optimizes resource use, and provides insights into operational health.- Amazon Web Services [16]
Aid for Many Clouds and Linking Them
CloudWatch works best with AWS, but it can take in data from other places like Amazon OpenSearch, Prometheus, and Azure Monitor [13]. In December 2024, AWS brought out CloudWatch Database Insights for Amazon Aurora (fit for PostgreSQL and MySQL) and Amazon RDS for many types of databases [15]. These tools aid DevOps folks and database managers in fixing issues with databases and apps on a big scale [17]. These links are key in meeting tough rules.
Rules Help for the UK
AWS makes sure CloudWatch fits with UK laws, like UK GDPR. AWS has an addendum that meets GDPR rules, showing its role as a data handler under UK GDPR [18]. CloudWatch keeps to rules by using safe TLS/SSL data sending, setting clear IAM access rules, and asking for multi-step checking. It links with AWS CloudTrail to log and watch API calls, making a full check trail. As of June 2023, 107 AWS services follow the CISPE Data Protection Code of Conduct, with checks on over 2,600 standards [56, 57].
Tracking Costs and Being Open About Them
CloudWatch uses a pay-as-you-use plan, asking money based on metrics logged, logs kept and pulled up, and alarms used [14]. This way of pricing helps groups watch spending better. By showing data on performance across systems, CloudWatch helps teams use resources well and handle sudden costs. Linking with other AWS cost tools also helps UK teams watch and handle their cloud money in pounds well.
5. Dynatrace

In today's ever-changing cloud world, where tracking costs and real-time monitoring are key, Dynatrace shines as an AI-driven platform made to cut down the cloud management's tricky parts. By making oversight automatic and making things more clear, it keeps businesses in the lead.
Real-time Metric Collection and Analysis
Dynatrace’s OneAgent is a big leap in monitoring. It maps out links and watches the full path of each deal, making sure of steady monitoring with fast alerts to spot slow points fast. With Grail-powered metrics, this tool updates info every minute and keeps it for 15 months, making it easy to track deals and plan for space needs. It goes further - Dynatrace checks performance over apps, setup, and user experience to show a full view of the system's health.
Look at Rack Room Shoes, for instance. By using Dynatrace's AI-driven tips, they raised sales by 25%. Also, the tool's power to automate has cut the average repair time by an amazing 90%.
Digital transformation is our top priority, and both Dynatrace and AWS are critical in enabling us to achieve our goals quickly, securely, and cost-effectively.
– Alex Hibbitt, Engineering Director, SRE & Fulfillment, Photobox [19]
This type of fast insight sets the base for smooth work over many clouds.
Help for Many Clouds and Joining Them
Dynatrace streamlines management of many clouds with its main Dynatrace Clouds screen. This makes it easy to keep track of tools and control them well [20]. It joins well with top cloud groups like AWS, Azure, and Google Cloud [22]. With auto finding and map work of links, watching over spread out areas gets simple.
Its AI-driven stats work on billions of data bits, offering clear, useful info instead of just loads of raw data [23]. For instance, a finance group in Japan cut down their fix time by 80% using auto checks that look first at risks and rule needs. In a like way, a customer in the UK cut down their monthly problems and unsolved cases by 80% with auto report flows [21].
Rule Needs for UK
With rising rule issues for UK groups, Dynatrace gives ongoing checks over mixed and many-cloud setups. This is key since 30% of cloud hits in early 2024 came from wrong setups [21]. Its auto rule tools aid groups in staying safe, vital as the mean cost of not following rules has gone up to £14.82 million each year per group [21]. For example, a German health firm saved loads of IT hours by using Dynatrace to sort out risks and give rule-based insights [21].
Cost Watch and Openness
Beyond keeping an eye on and joining, Dynatrace aids firms in managing cloud costs. Its Cost Share powers let groups link Dynatrace DPS use to clear cost parts or goods [26]. With help to swap GBP [27], firms can handle budgets by account, setting, and skill levels. Auto email notes tell teams when they go past spending caps [24].
Very fast updates every 15 minutes [25] and cost signs that show sudden cost jumps or predicted changes help keep costs in check. Costs kept in the Dynatrace Grail data lakehouse give deep look and showing [25]. This clearness is key, mainly when nearly half (49%) of groups feel their cloud bills are very high [28].
Tool Match Table
When picking a tool to watch over data, it's key to look at things like data location, cost, rules, and growth. Below is a clear match-up to guide you in lining up these tools with what your group needs:
| Tool | Data Place Options | GBP Pricing Way | UK Rules Features | Growth Power |
|---|---|---|---|---|
| Prometheus | You can set it up yourself; good with UK-based stuff | Free to use; costs for stuff and keeping it run | Safe settings you can change for ISO 27001; sticks to laws about keeping data | Can grow more from side to side; made for wide setups |
| Datadog | EU data spots; UK choices by area set-up | £11.25/host each month (changed from $15.00) | Has ISO 27001; fits laws; lines up with UK Cyber Basics | Scales up as needed; for big business |
| New Relic | EU area set-up; UK data rules in place | Free way to start | Fits ISO 27001; keeps data safe as per laws; marks down actions for rules | Grows well in clouds; fits big work well |
| Amazon CloudWatch | AWS London place (eu-west-2); fits UK rules in full | Pay as you use; about £2.50 per million API calls | Has AWS ISO 27001; follows data safety laws | Grows smooth in AWS; has lots of room for more |
| Dynatrace | Data spots in Europe; got UK options too | £8.25/host each month (changed from $11) | Has ISO 27001; watches GDPR by itself; reports as UK needs | AI makes scaling smooth; works well in big, hard setups |
Key Points
Data Staying in Place UK GDPR rules state that personal data must stay in the UK or places with the same safety [29]. Prometheus lets you host it yourself, giving great flexibility. Both Datadog and New Relic have hosting in the EU that meets UK rules.
Costs Prices are quite different. Prometheus is free to use but keep in mind costs for running and upkeep. New Relic has a no-cost plan good for small groups. Dynatrace charges £8.25 for each host monthly, and Datadog is average but could get expensive if used a lot. CloudWatch uses a pay-what-you-use plan, best for changing needs.
Following Rules All tools meet the ISO 27001 rules, but they do it in their own ways. Dynatrace automatically checks GDPR compliance, and CloudWatch uses AWS's strong rule-following structure. These points are vital since GDPR fines hit €1.1 billion in 2024 [30].
Growing Needs Being able to grow is key, as a Gartner study says that network problems can cost up to £4,500 each minute in lost work and money [31]. Tools like CloudWatch and Dynatrace are ready to handle more work as needed. Prometheus is good for big, spread-out setups.
Final Thoughts
When picking a tool, think about how your group needs to store and handle data. Be sure it fits with UK GDPR by checking how the tool keeps data safe and where it keeps data [29]. Weighing these things will help you pick a tool that fits your needs now and in the future.
End Thoughts
Picking the best cloud tracking tool for your UK group means looking at key things. First up: where the data sits. UK groups need to keep personal data in okay spots and follow local data laws.
The cost is also big. Your choice's price is more than just the pay-in fees. Lots of the cloud money often gets lost [32], so a good tracking tool is vital to handle costs well. As FinOps Certification points out:
A cloud bill can comprise hundreds of millions or billions of rows of data.– FinOps Certification [32]
A good watch tool not only helps make sense of hard costs but also boosts how well things run and makes sure rules are followed. Facts from real use show that groups using top watch tools have seen a 20% rise in following rules and a 25% cut in time to get ready for checks [33]. To get these perks, your picked tool should fit well with your old systems and keep data safe, both stored and sent.
Try free trials and demos to check how a tool works and fits. Look for things like auto alerts, easy-to-change views, and deep reports to make sure the tool fits your needs. With 67% of IT heads saying saving on cloud costs is key by 2025 [32], picking right now is key.
At the end, your choice of watch tools will touch how your group stays in line, keeps costs in check, and grows well. By thinking hard about what your setup needs, what rules you must follow, and plans for big growth, you can pick a fix that keeps your data safe, fits UK rules, and backs your long goals.
FAQs
What should I check when I pick a cloud tool to watch over my group's setup?
When picking a cloud tool to keep an eye on your setup, it’s key to look at things that fit with what your group needs. Start by looking into how well it can link and cover. The tool should watch well over all key parts in your cloud like virtual machines, containers, and databases.
Another big point is how much it can grow. As your setup gets bigger, the tool should be able to grow with it and still work well. You should also think about how easy it is to use - choose a tool that is simple to handle and set up to save time and make things less complex.
Alerts right away are very important, letting your team deal with problems as they come up. When thinking about cost, look beyond just the price you pay at first. Think about the full cost of owning it, which covers setting it up and costs to keep it going. Lastly, make sure the tool has strong safety parts to keep your data safe and meet rules that are specific to the UK.
What do cloud structure watch tools cost, and how can they help keep cloud fees down?
Watch tools for cloud structures are very good for controlling costs. They show clearly how resources are used and where cash goes. For example, they point out bad use like when too much power is paid for than needed. Fixing these bad uses helps firms use their cloud better and saves money.
A big plus is following fees in real-time. These tools let firms set spending limits, guess future fees, and change how much power they use better. This active way does not just stop big, sudden bills but also aids in better cash plans and smooth work flows. With these tools, firms control their cloud cash better, making way for smart choices and good fee control.
