
Spare GPU capacity is little use if power or cooling limits prevent it from running. TAPAS tackles this by coordinating VM placement, inference-request routing and VM reconfiguration. Before testing it, teams should check access to temperature and power readings, scheduling controls and safe rollback options.
Published at ASPLOS 2025, TAPAS is a research system - not a commercial product. Tests used 160 A100 servers, alongside a simulation based on a week-long production trace. The abstract reports 17% lower maximum temperature, 23% lower peak row power and up to 40% extra capacity. Separate presentation figures use different measures and should not be treated as equivalent.
For UK infrastructure teams, the next step is a controlled pilot - not a direct rollout. Lower peaks do not prove lower electricity bills or better latency. Testing should compare matched workloads, measure energy and service performance, and check incident recovery without disabling hardware safeguards.
How TAPAS coordinates inference workloads
Those limits only matter if the scheduler can turn telemetry into control. TAPAS profiles racks and rows using historical temperature and power data. Similar GPUs can have different headroom depending on their rack or row: nearby workloads, airflow, cooling and shared power limits all vary. TAPAS combines demand prediction with placement, routing and reconfiguration controls.[1][4]
3 scheduling controls
Each control works at a different level. Placement determines where capacity runs. Routing selects which existing serving VM receives demand. Reconfiguration changes how the service runs. Routing can therefore shift load without moving a VM.[1]
| Control action | Decision made | Inputs required | Timescale | Intended effect | Emergency use |
|---|---|---|---|---|---|
| GPU workload VM placement | Where to place a new GPU workload VM within the cluster | Historical temperature and power data; workload characteristics; physical-placement mapping and infrastructure limits | When new GPU workload VMs are allocated | Avoid locations likely to breach thermal or power limits | Place new or replacement capacity away from affected locations |
| Inference-request routing across serving VMs | Which serving VM receives each inference request | VM availability, serving load, telemetry and latency objectives | Per request or routing decision | Shift demand towards locations with more thermal and power headroom | Divert requests from affected rows during power or cooling incidents |
| Serving VM reconfiguration | How to change the serving VM or inference-service configuration as demand changes | Current demand, thermal and power state, supported VM configuration controls and service constraints | During demand spikes and emergencies | Adjust service capacity or load intensity | Respond to cooling or power failures; exact configuration changes are not reported |
The paper defines these three control categories but does not report their exact timing or specify a fixed reconfiguration action.[1]
The next section examines these controls against TAPAS’s reported workload and hardware conditions.
Telemetry and control requirements
To adopt TAPAS, teams need to know what their platform must expose and control. It requires historical temperature and power data, awareness of cooling and power conditions, and control over placement, routing and reconfiguration.[1] Placement alone cannot provide that serving-layer flexibility.
Teams must validate deployment requirements separately. They should check whether:
- Reliable GPU, rack or row temperature and power readings are available.
- Historical data covers enough time to represent normal and peak demand.
- VM placement can be controlled.
- The serving platform supports request routing without breaching UK customer latency or availability commitments.
- Reconfiguration can be carried out and rolled back safely.
The paper does not report sampling intervals, retention periods, sensor coverage, alert thresholds, topology mapping or GPU-to-VM attribution accuracy.
TAPAS evaluation and reported results
::: @figure 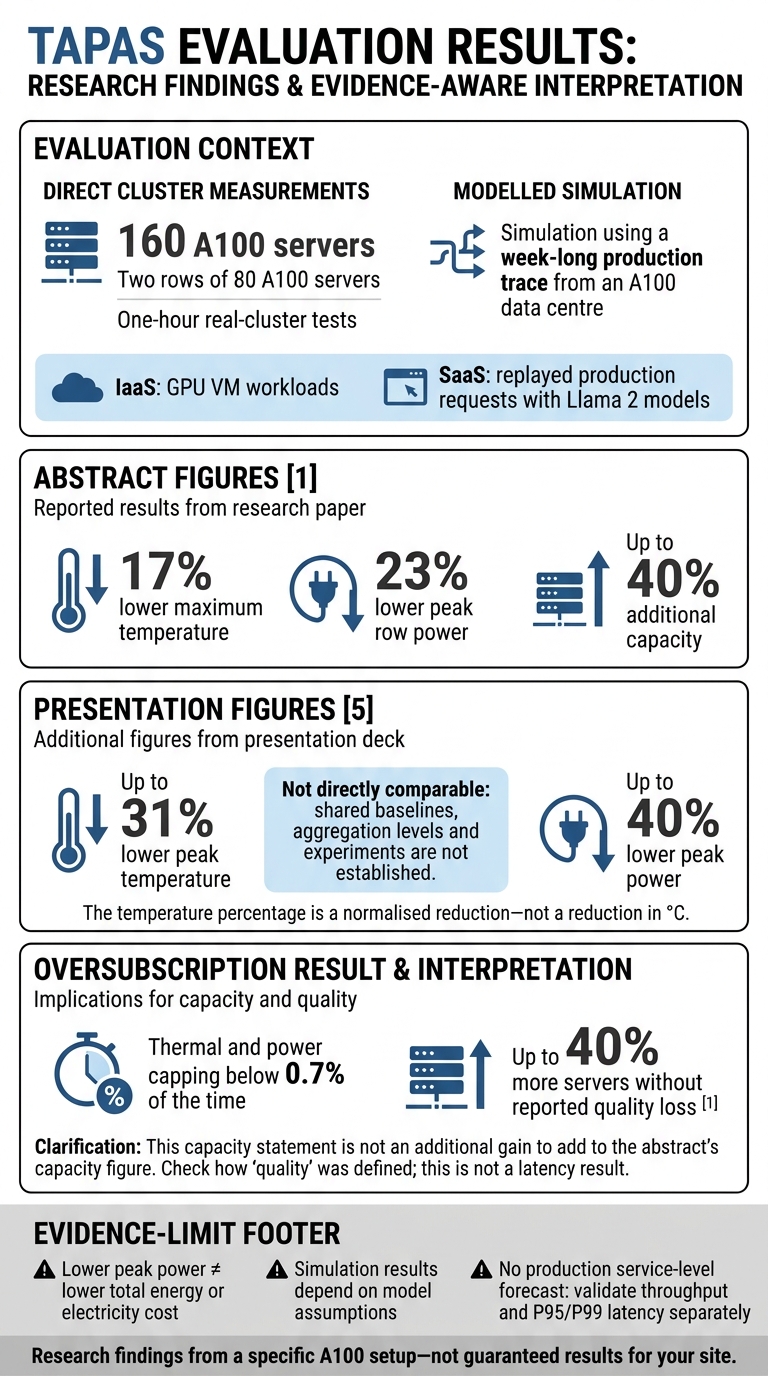 {TAPAS Results: Reported Gains and Evidence Limits}
:::
Hardware, workloads and test duration
The authors tested whether TAPAS could reduce thermal and power pressure while meeting those control requirements. They ran one-hour tests on a real cluster of 160 A100 servers, alongside a simulation using a week-long production trace from an A100 data centre.[4]
| Scenario | Workload | Scale | Measurements | TAPAS outcome |
|---|---|---|---|---|
| Real-cluster IaaS | GPU VM workloads | Two rows of 80 A100 servers | Direct power and thermal readings; capping or throttling observations where reported | Lower measured peaks under the tested configuration |
| Real-cluster SaaS | Replayed production requests with Llama 2 models | Same A100 cluster | Request-level service metrics alongside power and thermal effects | Combined placement, routing and reconfiguration controls |
| Simulation | One-week production trace | Modelled A100 infrastructure | Modelled thermal, power, capacity and capping behaviour | Additional capacity or less exposure to limits in the model |
Before applying these findings, check the baseline policies, sensor locations, sampling intervals and how the metrics were aggregated. Simulation results depend on model assumptions; they are not direct production measurements.[4]
Reported reductions in peaks and throttling
The presentation materials report up to 31% lower peak temperature and 40% lower peak power. These figures are not directly comparable with the abstract’s 17% lower maximum temperature, 23% lower peak row power and up to 40% additional capacity.[1][4] The sources do not establish that these percentages share a baseline, aggregation level or experiment.
Read the 31% temperature result as a normalised reduction, not a reduction in °C. Similarly, the 40% peak-power result does not, on its own, show lower average power, total energy use or electricity costs.[4]
In the oversubscription test, TAPAS kept thermal and power capping below 0.7% of the time and supported up to 40% more servers without reported quality loss.[1] This is not a latency result, and the extracts do not support a production service-level forecast. Before using the figures for capacity planning, check how “quality” was defined and seek separate throughput and P95/P99 latency data for the hardware and test setup in question.[1][4]
Evidence limits and adoption checks
TAPAS’s gains came from a specific A100 setup. Before adopting it, check how it performs at your site.
Limits of the hardware and test conditions
Retest when accelerators, racks or cooling differ. Rack density, airflow and liquid cooling can change thermal behaviour and scheduling headroom. The one-week A100 trace provides limited evidence on seasonal temperatures, ageing, maintenance and rare bursts.[4]
| Dimension | Potential benefit | Evidence available | Validation still required |
|---|---|---|---|
| Thermal/power headroom and capping | More headroom within limits | The evaluation reported lower peaks and less thermal and power throttling.[4][5] | Target hardware, cooling layout, ambient conditions, transient peaks, capping duration, affected requests and recovery time |
| Throughput and latency | Stable serving under constraints | Results do not establish a universal performance guarantee. | Requests/s, tokens/s and tail latency at matched service targets |
| Availability and service quality | Better handling of constrained capacity | Emergency handling is a design feature, not an availability guarantee.[5] | Failover, model quality and tenant-specific service targets |
| Energy and total cost | Possible capacity savings | Peak results alone do not establish savings.[4] | Equal-work kWh measurements and site-specific costs |
These evidence limits determine which telemetry and controls the pilot needs.
Telemetry, control access and service targets
Use synchronised telemetry to identify thermal and power headroom. Check that you can place VMs, route inference requests between serving VMs and reconfigure them during load spikes or incidents.[5]
- Telemetry: expose GPU temperature, GPU and server power, utilisation, frequency, throttling state, cooling status, inlet and outlet temperatures, rack power and facility limits. Set a maximum reading age, then test stale, missing, duplicate and conflicting samples. If telemetry fails, stop oversubscription, keep conservative limits and alert an operator.
- Power and temperature limits: map constraints from the GPU through the server, rack, PDU, UPS and utility supply, alongside cooling limits. Distinguish operating, slowdown and shutdown temperatures; NVIDIA defines these separately.[6]
- Controls: measure API latency, model-loading time, cache loss, transfer bandwidth and temporary capacity reduction.
- Baseline and service targets: match hardware, models, precision, prompt mix and batching when comparing against the site’s existing power or cooling policy. Agree latency and availability targets, tenant protections and rollback triggers for service breaches, stale telemetry or shrinking safety margins.
Use these checks to set the pilot’s operating limits.
Pilot measures and emergency tests
Measure thermal, power, throughput and recovery behaviour separately.
- Temperature, power and energy: record peak temperature in °C, peak power in kW, throttling duration and energy in kWh. Compare energy per completed request or generated token: lower peak kW does not necessarily mean a lower bill.
- Serving performance: measure requests/s, tokens/s, time-to-first-token, inter-token latency and availability, including during reconfiguration.
- Emergency testing: use an isolated pool with non-critical workloads, operator approval, independent hardware protection and a tested rollback path. Reduce cooling capacity or constrain rack power only within approved limits, and inject sensor faults and stale telemetry. Never disable manufacturer safeguards.
- Response and recovery: record detection time, entry into degraded mode and recovery time.
Before testing, set pass criteria: no safety-limit breach, bounded disruption and recovery within the agreed target.
Conclusion: set baselines before a controlled pilot
TAPAS applies where thermal or power limits reduce usable GPU inference capacity. It combines workload placement, inference-request routing and VM reconfiguration.[1]
The gains depend on site-specific telemetry and controls. The test is whether your hardware can reproduce them. Research findings do not promise lower electricity bills, extra capacity or better service at your site.
Next steps for UK infrastructure teams
Treat adoption as a controlled test, not a direct rollout. Confirm access to telemetry and controls, establish a matched baseline, then run a pilot on representative hardware and workloads with agreed service safeguards.
Assign responsibility for change approval and incident escalation before testing. Expand only when measured results meet the agreed thresholds without shifting constraints elsewhere.
FAQs
How can I tell if TAPAS suits my cluster?
Treat published research as a guide to upper limits, not guaranteed results [1]. Check that your infrastructure and workloads work with TAPAS, and that you have reliable real-time metrics for GPU availability, latency and governance metadata [2]. Also check whether UK compliance and data residency requirements can be enforced as hard scheduling constraints [1].
Start with low-risk batch consolidation or limited autoscaling. Roll out in phases and use A/B testing to compare results with your current heuristics before considering mission-critical workloads [1].
How should I weigh extra capacity against latency?
For interactive LLM workloads, treat latency as a hard limit, particularly p95/p99 and time-to-first-token. Optimise cost and capacity within that limit. Start with a small reserved baseline, and use queue depth and latency to guide autoscaling - not GPU utilisation alone.
Scale up fast and down slowly. Use longer cooldowns to avoid repeated scaling up and down. Persistently low utilisation can point to overprovisioning, but keep at least one warm replica to avoid cold-start delays. [1][2][3]
What would justify expanding a TAPAS pilot?
Expand a TAPAS pilot only when cost per successful task falls and service quality, latency and performance stay within agreed limits. Check the policy against a representative holdout set to confirm it works beyond test conditions.
Roll out one workflow at a time, with strict human oversight. Monitor stability, regulatory compliance and performance baselines. Continue only if the scheduler adds no unexpected overhead and causes no service instability.