
Most Kubernetes pods are set far too high. If your cluster CPU use sits around 10% and spend keeps climbing, rightsizing is often one of the first things I would check.
In simple terms, this guide shows how I would cut waste and lower risk by doing three things:
- Measure pod usage first over 2–4 weeks
- Set CPU and memory requests and limits from percentiles, not guesswork
- Test changes under live traffic before rolling them out more broadly
It also explains the parts that tend to trip teams up:
- why CPU limits can lead to throttling
- why memory limits can trigger OOM kills
- how QoS classes affect eviction order
- when to use manual tuning, VPA, Goldilocks, or KRR
A few numbers stand out. The source article notes average cluster CPU use at about 10%, with 99% of clusters overprovisioned in one 2025 benchmark. It also points to 20–40% of monthly cloud spend going on unused cluster capacity. So this is not just YAML tidying. It affects £ spend, reliability, and scheduling.
If I had to boil the guide down into one short plan, it would be this:
- Collect live usage and config data
- Use p90, p95, and p99 to set requests and limits
- Watch throttling, OOM kills, restarts, and latency after each change
- Use tooling for recommendations, but review them before rollout
::: @figure 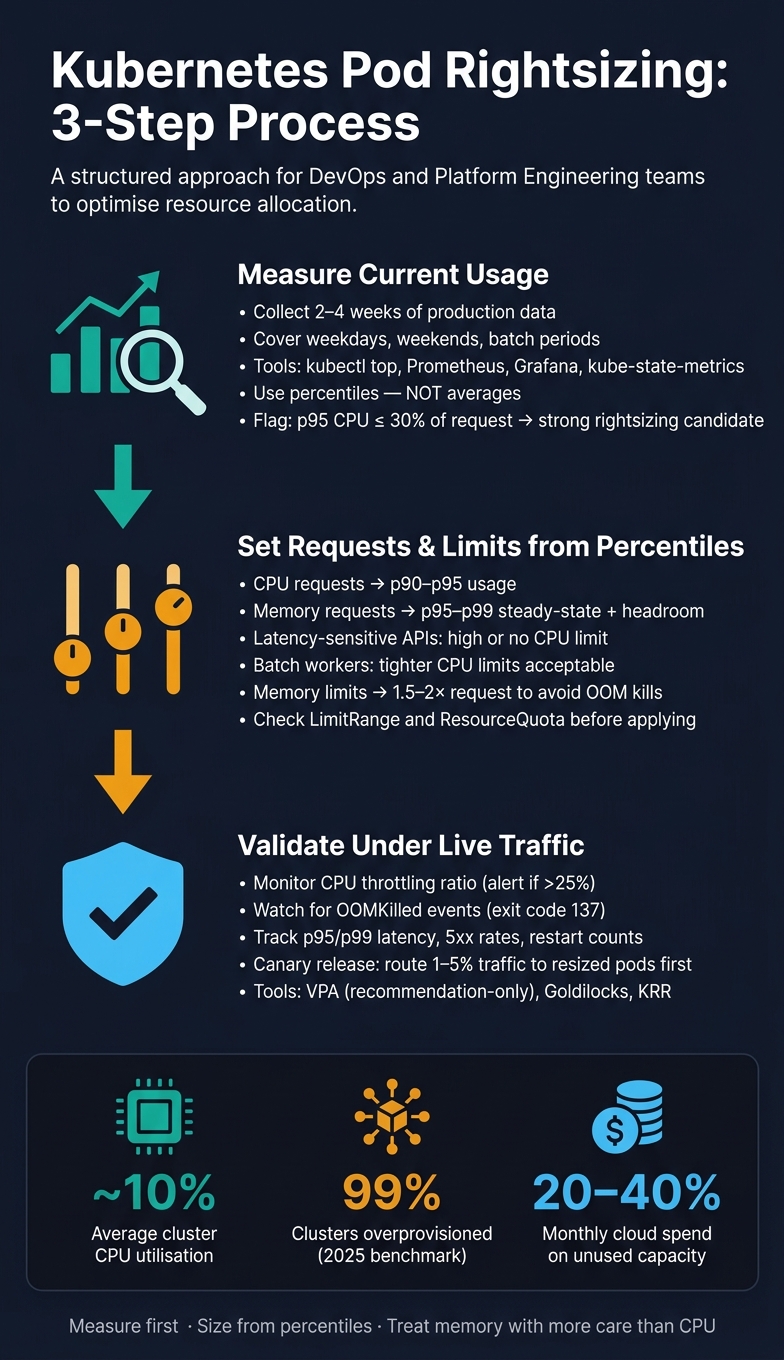 {Kubernetes Pod Rightsizing: 3-Step Process Guide}
:::
{Kubernetes Pod Rightsizing: 3-Step Process Guide}
:::
Vertical Pod Autoscaler (VPA) Tutorial: Auto Right-Size Kubernetes Containers
Need help optimizing your cloud costs?
Get expert advice on how to reduce your cloud expenses without sacrificing performance.
Quick comparison
| Area | What to do | What to avoid |
|---|---|---|
| CPU requests | Base them on p90–p95 usage | Setting them far above normal demand |
| CPU limits | Keep them high or omit them for latency-sensitive services if policy allows | Tight CPU caps that cause throttling |
| Memory requests | Base them on steady usage with buffer | Sizing from averages alone |
| Memory limits | Leave headroom above p95–p99 | Limits so low that spikes cause OOM kills |
| Validation | Check p95/p99 latency, throttling, restarts, and errors | Rolling out cluster-wide without a canary |
| Automation | Use VPA, Goldilocks, or KRR as recommendation tools | Applying every recommendation without review |
If you want a plain-English takeaway: measure first, size from percentiles, and treat memory with more care than CPU. That is the core of the article.
Step 1: Measure current usage before changing anything
Changing requests and limits without data is guesswork. First, collect 2–4 weeks of production usage before you touch YAML. Make sure that window covers a full business cycle: weekdays, weekends, and any batch periods. That way, your baseline reflects both normal demand and peak demand.[6][2]
Collect pod requests, limits and live usage data
Start with the tools Kubernetes already gives you. Running kubectl top pod --namespace <ns> gives a near-real-time view of CPU and memory use for each pod. Add --containers if you want the per-container split, which helps when a pod includes a sidecar next to the main application.[3] Then pair that with kubectl describe pod and a check of your Deployment or StatefulSet YAML so you can see the requests and limits that are actually set.
kubectl top only works if Metrics Server is installed. Without it, there is no metrics source for kubectl top.[4][5] For history, use Prometheus, Grafana, and kube-state-metrics. Prometheus stores CPU and memory usage over time. kube-state-metrics exposes the configured requests and limits. Grafana lets you put both on the same chart across the baseline window.[2][7][8] That turns one-off snapshots into a trend you can work with.
| Tool | What it gives you | Limitation |
|---|---|---|
kubectl top pod |
Near-real-time CPU and memory usage | No history; real-time only |
kubectl describe / YAML |
Configured requests and limits | No runtime consumption data |
| Metrics Server | Powers kubectl top
|
Not a long-term history tool |
| Prometheus + Grafana + kube-state-metrics | Trends, percentiles, usage vs. requests | Requires setup and maintenance |
These figures give you the baseline for requests and limits in Step 2.
Use percentiles to separate normal usage from spikes
Once you have history, size against percentiles instead of averages. A workload that sits idle for long stretches and then spikes during a batch run can look small if you only check the mean. That’s the trap. Use percentiles, not averages.
p50 shows typical behaviour. It can be a sensible target for non-critical batch jobs where the odd slowdown is acceptable. For production services, use p90 and p95. They show normal peaks without letting brief outliers run the show.[6][2] Track p99 for latency-sensitive services and for memory limits, because memory overshoots lead to OOM kills, not throttling.
A handy rule of thumb: if a workload’s p95 CPU usage is at or below 30% of its current request - a usage-to-request ratio under 0.3 - it is a strong candidate for rightsizing.[8]
In Prometheus, you can work out CPU percentiles by using rate(container_cpu_usage_seconds_total[5m]) first, then applying recording rules or Grafana transformations over your chosen time range. In Grafana, plot p50, p95, and the configured request on the same panel for each workload. If the request line sits well above the p95 usage line, you’ve found overprovisioned capacity. If p95 usage starts getting close to the limit line, and pod restart counts are also going up, that workload may be at risk.[2]
Before you lock in any baseline, annotate your dashboards with deployments, load tests, and incidents. Percentiles taken from a period that includes a traffic surge or a bad deployment can skew the picture. Exclude those windows, or flag them on their own, so your rightsizing choices reflect normal and peak behaviour rather than one-off events.
Use these baselines in Step 2 to set new CPU and memory values.
Step 2: Set better CPU and memory values
Use the Step 1 baseline to set requests and limits. Start with the p95 request line from Step 1, then tune it based on the kind of workload you're running.
Choose CPU and memory targets for different workload types
CPU limits can cause throttling. Memory limits can lead to OOM kills. That’s why memory usually needs a bit more care when you size it.[10][13]
For CPU, a good starting point is to set the request around p90–p95 usage. For latency-sensitive services like web APIs and SaaS front ends, set the limit much higher than the request, or skip the CPU limit if your cluster policy allows it. Why? Because a hard CPU limit can throttle a pod even when the node still has spare capacity. The result is often slower tail latency, and it can slip by without being obvious at first.[9][10][11]
For background workers and batch jobs, tighter CPU limits are usually less risky. If a task takes a little longer, queue-based work can often absorb that without much fuss.
For memory, use p95–p99 steady-state memory use as your anchor, then add headroom for garbage collection, cache warm-up, and connection bursts. Say a service sits around 450–600 MiB most of the time and spikes to 750 MiB. In that case, a sensible starting point is a 600–700 MiB request and a 900 MiB–1 GiB limit. For CPU, if usage runs at 120–180 millicores with peaks at 250 millicores, start with a 150–170 millicore request and a 400–500 millicore limit.[11]
The table below gives rough starting points by workload type:
| Workload Type | CPU Request | CPU Limit | Memory Request | Memory Limit |
|---|---|---|---|---|
| Latency-sensitive API | p95 usage | None or very high | p95–p99 steady-state use | 1.5–2× request |
| Bursty e-commerce | Steady-state usage | 3–5× request | p95 steady-state use | Moderate headroom |
| Batch / background worker | p50 usage | 2× request | p95 steady-state use | Moderate headroom |
| Critical stateful service | Request = Limit | Request = Limit | Request = Limit | Request = Limit |
Once you’ve got a starting point, apply it at the container level in the workload manifest.
Update Deployment or StatefulSet YAML safely
Resource settings live at the container level, under spec.template.spec.containers[].resources. If a pod has a sidecar, such as a log shipper, size each container on its own. If you tune the main container but leave a bloated sidecar untouched, you’re still burning capacity for no good reason.
containers:
  - name: api-server
    resources:
      requests:
        cpu: "150m"
        memory: "600Mi"
      limits:
        cpu: "500m"
        memory: "900Mi"
  - name: log-shipper
    resources:
      requests:
        cpu: "25m"
        memory: "64Mi"
      limits:
        cpu: "100m"
        memory: "128Mi"
Before you apply any change, check two things:
- Whether the namespace has a LimitRange or ResourceQuota. A LimitRange can add defaults or reject values outside its rules. A ResourceQuota tracks total requests across the namespace and can stop a rollout if the new settings push you past the allowed allocation.[12][13]
- Whether your cluster supports in-place pod resource resize for the Kubernetes version and feature set you’re using. If it doesn’t, every change means a rolling pod replacement.
Roll out one service at a time with a small batch size, and keep a close eye on metrics. Make the change, then check for throttling and memory pressure. After that, validate it in Step 3 before you apply the same pattern to other workloads.
Step 3: Validate results and automate repeatable rightsizing
Changing CPU and memory values is only part of the job. You still need to prove the change did what you wanted. If you skip validation, you can miss slowdowns, hidden failures, or a problem that simply moved somewhere else. Check each change against live traffic before you roll it out any further.
Measure every update against the p95 and p99 baseline from Step 1. Do that during a normal production traffic window, not during a quiet spell or a one-off spike. If you can, run load tests that match how people use the service in practice, then compare those results with your baseline.
Pay close attention to CPU throttling, OOMKilled events, and sudden jumps in restarts. For CPU throttling, monitor the Prometheus ratio below:
rate(container_cpu_cfs_throttled_periods_total[5m])
  /
rate(container_cpu_cfs_periods_total[5m])
If that throttling ratio stays above 25% during normal traffic, your CPU limit is too tight.[15] If throttling starts spiking after a change, increase the CPU limit by 20–30% and test again.[2]
For memory, look at kubectl describe pod for OOMKilled events and exit code 137. Then compare live usage with limits by using kubectl top pods --containers. If OOM kills happen during steady-state load rather than rare spikes, increase resources.limits.memory to at least p99 usage plus a 20% buffer and test again.[16][2]
It also helps to track service-level signals, not just container metrics. Watch latency percentiles, 5xx rates, and business KPIs such as checkout completion. A pod can look fine on paper while the user journey gets worse. That’s why canary releases matter. Route 1–5% of live traffic to the newly sized pods, then compare canary metrics with the control group before pushing the change across the cluster.[14][1]
When to use VPA and recommendation tools
Once you’ve got a steady manual baseline, tools can handle the repetitive part: spotting drift and suggesting updates. A good place to start is VPA in recommendation-only mode (updateMode: Off). In that setup, VPA reviews past usage and suggests requests and limits, but it does not change live pods. You get another view of the CPU and memory targets from Step 2 without automatic restarts.
Goldilocks uses VPA recommendations and shows them in a dashboard, so you can scan a whole namespace and see which workloads look over- or under-provisioned. KRR (Kubernetes Resource Recommender) takes a different route. It’s an agentless CLI tool that connects straight to Prometheus and the Kubernetes API without installing anything into the cluster. That makes it a good fit for security-conscious environments.
These tools save time, but they should not be trusted blindly. Human review still matters for stateful services, JVM-based applications, and workloads with seasonal traffic patterns. Those cases often need context that a tool simply does not have.
Use the same baseline window from Step 1, along with known traffic events, before you rely on tool-generated recommendations. That matters even more for workloads with infrequent but important spikes.
Manual tuning versus automated recommendations: a comparison
When the workload is stable, pick the lightest level of automation that suits the service. Here’s the trade-off at a glance.
| Approach | Effort | Speed of Adjustment | Operational Risk | Best Suited For |
|---|---|---|---|---|
| Manual rightsizing | High - requires metric analysis, YAML edits and validation | Slow - depends on human review cycles | Lowest - full engineer control | Stable, predictable workloads; critical or stateful services |
| Recommendation tools (Goldilocks, KRR) | Medium - review dashboard or report, then apply changes manually | Medium - analysis is fast; application still manual | Low - tools do not change live resources | Establishing baselines; broad namespace audits |
| VPA (recommendation-only) | Low to medium - automated analysis, manual application | Medium - continuous recommendations, manual rollout | Low - no automatic pod changes | Audit workflows; workloads where you want a data-driven second opinion |
| VPA (automatic resource updates) | Low - largely automated | Fast - reacts continuously to usage changes | Higher - can restart pods unexpectedly | Fast-changing, stateless services with reliable alerts and rollback |
For critical services, manual tuning is usually the safer starting point. Goldilocks or KRR can then help you spot cluster-wide opportunities, while VPA automatic resource updates make more sense for stateless workloads with solid alerting and rollback in place.
Conclusion: Build rightsizing into cost control and platform operations
Taken together, these steps make rightsizing a repeatable operating habit, not a one-off tidy-up. The work is continuous: measure usage, size from p90–p95, test under real load, and review on a regular cadence.
That improves cost, reliability, and utilisation at the same time. You cut waste, reduce OOM kills and throttling events, and pack clusters more tightly. Over time, those gains stack up.
The technical side also turns into clearer budget control when you tie usage to £ spend per service. For UK teams, that usually means mapping namespace usage to £ spend per service with Prometheus and billing data, so forecasting and FinOps reviews are based on what services are actually using.
For teams that want to make this part of day-to-day platform operations, Hokstad Consulting helps turn it into a repeatable operating control through cluster instrumentation, sizing policy, and review governance.
Key points to carry into your next review cycle
The habits worth building are simple, but they matter:
Base requests and limits on measured usage over 2–4 weeks of representative production traffic. Use percentile-based data such as p90, p95, and p99 to separate normal demand from short spikes.
Treat memory more carefully than CPU. Memory exhaustion causes OOM kills, not throttling. That means stateful or critical services need enough headroom for garbage collection cycles and processing bursts, even if that leads to a slightly higher £ cost.
Be careful with CPU limits on latency-sensitive services. Throttling on a payment gateway or public-facing API can turn straight into slower response times and user-facing errors.
Review settings on a regular basis. A monthly or quarterly cadence suits most teams, with extra checks after major releases, architecture changes, traffic shifts, or higher cloud spend. If you record sizing decisions and outcomes in shared dashboards or docs, each review cycle starts from a better place than the last.
FAQs
How often should I review pod sizes?
Treat pod sizing as a regular habit, not a one-and-done job. Run formal reviews weekly so you can spot idle workloads, over-provisioned pods, and usage trends before they turn into performance problems.
It also helps to review sizing after big traffic changes, such as seasonal peaks. Make any adjustments using two weeks to one month of past data, so your decisions reflect normal traffic patterns rather than short-term spikes or dips.
Should every pod have CPU and memory limits?
Not every pod needs CPU and memory limits, even though they’re usually a smart move for cluster stability.
Some teams skip CPU limits for bursty services so they don’t trigger artificial throttling. Instead, they lean on accurate CPU requests to give the scheduler a clear picture of what the workload needs.
Memory limits are different. They should always be set. Without them, one container can eat up all the node’s resources and take the whole system down.
If you do set limits, Hokstad Consulting recommends 1.5 to 2 times observed peak usage.
What should I check before enabling VPA?
Before you enable the Vertical Pod Autoscaler (VPA), make sure the Metrics Server is installed and running. You’ll also need cluster-admin privileges to install the VPA components through Custom Resource Definitions.
To avoid disruption, start with VPA in Off mode. That lets you review its recommendations before anything triggers automatic pod restarts.
Also, check that VPA isn’t targeting the same metrics as the Horizontal Pod Autoscaler. If both are trying to steer the same thing, you can run into conflicts fast.