
Hybrid cloud environments are complex, blending on-premises systems with public and private clouds. Managing them effectively requires real-time monitoring.
This approach continuously collects and analyses data across applications, infrastructure, and networks, enabling instant insights and faster issue detection. It eliminates delays caused by traditional periodic monitoring and helps organisations maintain seamless operations across platforms like AWS, Azure, and on-premises systems.
Key benefits include:
- Unified visibility: Consolidates data into a single platform, removing silos.
- Improved performance tracking: Monitors user experience, infrastructure, and network health.
- Proactive issue prevention: AI and predictive analytics identify problems before they escalate.
OpenTelemetry: Simplifying Hybrid Cloud Monitoring
Need help optimizing your cloud costs?
Get expert advice on how to reduce your cloud expenses without sacrificing performance.
Core Components of Real-Time Monitoring
To make the most of real-time insights in hybrid cloud environments, it's crucial to focus on three key areas: user experience, infrastructure performance, and unified observability. Together, these elements ensure you understand both how users interact with your systems and how your infrastructure operates, whether it's hosted in the public cloud or an on-premises data centre.
Real User Monitoring (RUM) and Synthetic Monitoring
Real User Monitoring (RUM) captures real user interactions through embedded scripts, tracking essential metrics like Core Web Vitals (LCP, INP, CLS), Time to First Byte, and resource load times [1]. This method provides a clear picture of user journeys, including critical processes like checkouts or form submissions [2][4].
Synthetic monitoring, on the other hand, uses automated agents to mimic user workflows - such as logging in, making payments, or executing API calls - from various global locations [1]. A practical example is Emma Sleep, which leveraged Grafana Synthetic Monitoring during Black Friday 2025 to detect a mispriced product before customers experienced any issues [2].
This combined approach highlights factors like page load times, transaction speeds, and the impact of network routing or Content Delivery Network (CDN) performance - areas that traditional server monitoring often overlooks. While understanding user interactions is vital, maintaining visibility into infrastructure and networks is just as important.
Infrastructure and Network Visibility
Monitoring servers, databases, and network paths is critical for ensuring seamless integration in hybrid setups. However, capturing performance metrics at network boundaries - such as VPC connections or Direct Connect endpoints - can be challenging, as these are often hotspots for latency, packet loss, or routing issues [1].
For hybrid environments prone to unreliable WAN links, persistent queues in telemetry collectors can buffer data during network outages [3]. Deploying regional collectors in each network zone helps bridge gaps by exporting data securely through VPN or Direct Connect links while using compression to conserve bandwidth [3]. These strategies pave the way for unified telemetry, which aligns data across diverse systems.
Unified Telemetry and End-to-End Observability
Achieving consistent data collection across cloud and on-premises systems is essential for informed decision-making. OpenTelemetry has become the go-to standard for this, with 58% of data professionals either adopting it or evaluating its use [5].
OpenTelemetry handles hybrid environments well because it is infrastructure-agnostic. The same SDKs, the same collector, and the same protocols work whether your service runs on a Kubernetes pod in GCP or on a bare-metal server in your data centre.
Distributed tracing ensures trace continuity across cloud boundaries by using consistent headers like traceparent and tracestate in HTTP requests. This guarantees that load balancers and proxies pass along OpenTelemetry headers [1][3]. Using standardised resource attributes - like deployment.location and cloud.region - across telemetry sources simplifies filtering and grouping on unified dashboards [3][6]. For older on-premises systems that lack modern SDK support, collectors can scrape Prometheus metrics or process Syslog data, integrating them into the unified telemetry pipeline [3].
Key Metrics for Monitoring Hybrid Cloud Performance
Keeping a hybrid cloud environment running smoothly depends on tracking the right set of metrics. These metrics help identify issues across applications, infrastructure, and network layers by leveraging unified telemetry principles.
Performance Metrics
Latency, measured through Round-Trip Time (RTT) and Time to First Byte (TTFB), plays a critical role in real-time applications like video conferencing. Another key metric, throughput, measures the amount of data or transactions processed per second - commonly expressed as Requests Per Minute. This ensures your system can handle peak demands without performance dips.
To maintain optimal performance, aim for CPU utilisation levels between 60–80%, as anything above 85% can lead to timeouts. Similarly, keep memory usage below 90% to avoid the latency that comes with relying on disk-based swap space. Disk I/O - measured in IOPS (input/output operations per second) and throughput - can signal storage bottlenecks. High queue lengths in this area often lead to application slowdowns or timeouts.
Network and Connectivity Metrics
Bandwidth and network I/O are crucial, especially since factors like VPN encryption and the physical distance between data centres can add delays. Even a small packet loss of just 1% can severely affect real-time services like VoIP. Monitoring hop-by-hop latency is also essential to pinpoint delays caused by either the application code or the network infrastructure.
Service-Level Metrics
Key service-level metrics include availability, which reflects the proportion of successful operations (such as HTTP requests), and error rates, which indicate system stability. Keeping response times under a second is vital for maintaining a positive user experience. These metrics form the backbone of effective real-time monitoring strategies.
How to Implement Real-Time Monitoring
Setting up real-time monitoring in hybrid cloud environments requires tackling fragmentation, ensuring consistency, and integrating diverse systems. The aim? To create a single, unified perspective on your infrastructure.
Centralised Monitoring Platforms and Data Models
Bringing together data from AWS CloudWatch, Azure Monitor, and on-premises systems like Kafka into one repository simplifies troubleshooting processes [7][6]. A centralised view eliminates the inefficiency of switching between dashboards, allowing teams to identify and resolve issues faster.
Standardised tagging, enforced through cloud-native policies, ensures that workloads are traceable across all environments [9]. This approach makes it easier to track and correlate workloads, no matter where they are running.
For organisations with strict compliance requirements, sensitive data can remain on-premises while other metrics are exported to the cloud [7]. This strategy balances the need for security with operational effectiveness.
By unifying data in this way, organisations are set up for deeper analytics and seamless multi-cloud integration.
AI and Predictive Analytics for Proactive Monitoring
Machine learning can be a game changer for monitoring. Analysing historical telemetry data makes it possible to detect anomalies and predict potential performance issues before they escalate. This shifts monitoring from being reactive - responding to alerts - to proactive, preventing problems before they occur. Predictive analytics aligns perfectly with the unified telemetry approach mentioned earlier.
Integrating Multi-Cloud and On-Premises Monitoring
To maintain long-term performance, integrating monitoring across multiple clouds and on-premises systems is essential. With 89% of organisations adopting multi-cloud strategies but still struggling with visibility [6], integration becomes a top priority. OpenTelemetry offers a vendor-neutral way to standardise metrics, logs, and traces across AWS, Azure, GCP, and on-premises environments [6][9].
The goal of multi-cloud monitoring is not to eliminate native tooling - it is to add a correlation plane above it. The best architectures are additive, not replacement-focused.- CIOPages Editorial Team [9]
Tools like Google's BindPlane help integrate data from on-premises virtual machines and various cloud providers into centralised platforms [7]. Similarly, AWS Systems Manager extends monitoring capabilities to non-EC2 nodes in other clouds [10]. To minimise costs and latency, only transmit telemetry data that delivers clear business value [8].
For businesses needing customised solutions, Hokstad Consulting offers expertise in hybrid cloud infrastructure. They can design monitoring architectures tailored to your needs, balancing visibility, compliance, and cost efficiency across your environment.
Tools for Hybrid Cloud Monitoring
::: @figure 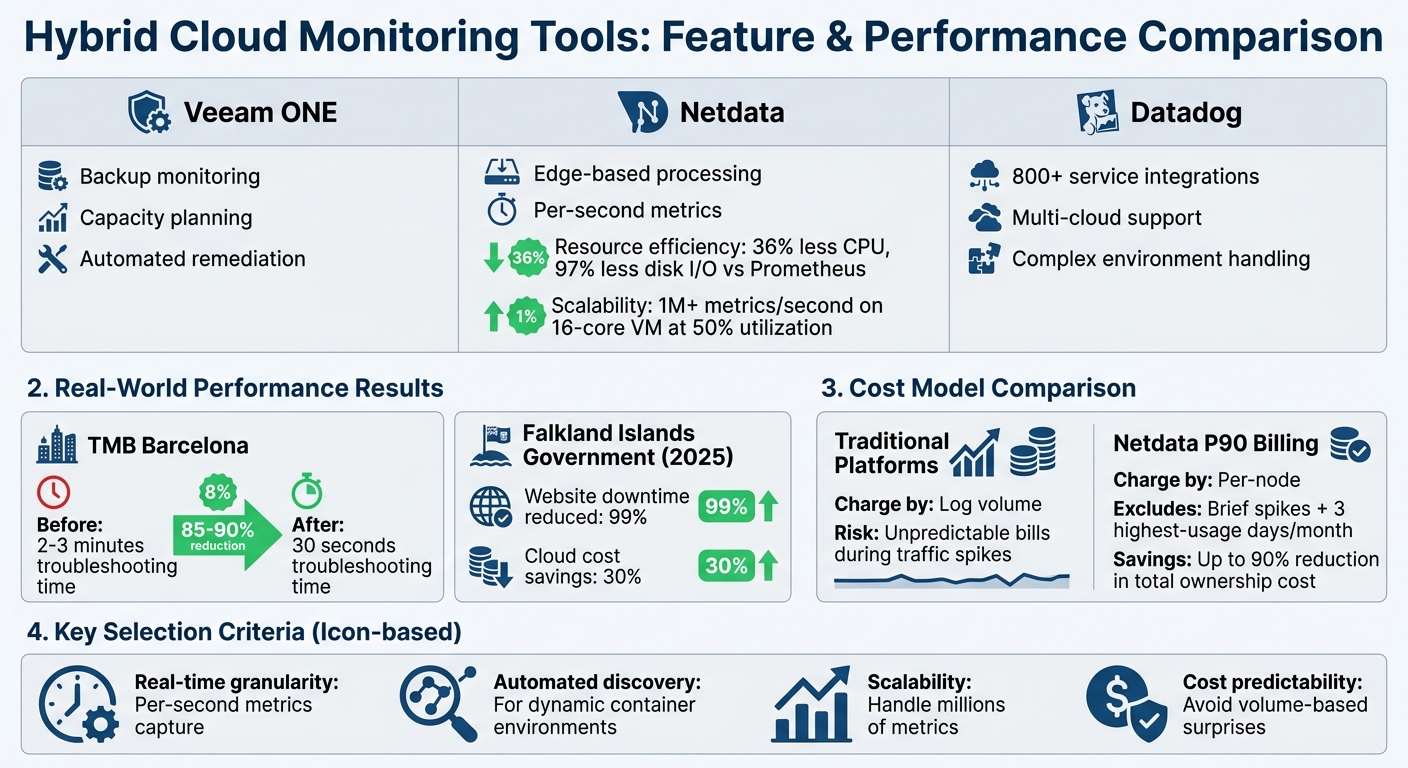 {Hybrid Cloud Monitoring Tools Comparison: Features, Performance and Cost Models}
:::
{Hybrid Cloud Monitoring Tools Comparison: Features, Performance and Cost Models}
:::
Feature Comparison of Monitoring Tools
Choosing the right monitoring tool depends on the specific needs of your infrastructure. For dynamic environments, real-time granularity is essential; capturing per-second metrics can help identify fleeting issues that might be missed with minute-level polling [12][13]. Automated discovery is another must-have for setups where containers and instances are constantly being created or removed [11][15].
Here are some examples of popular tools and their strengths:
- Veeam ONE: Offers robust backup monitoring and capacity planning, paired with automated remediation capabilities [14].
- Netdata: Specialises in edge-based processing with per-second metrics, using significantly fewer resources - 36% less CPU and 97% less disk I/O - compared to Prometheus when scaled [13].
- Datadog: Stands out for its integration support, covering over 800 services, which makes it ideal for complex multi-cloud environments [11].
Scalability is another critical factor. For instance, Netdata can handle over 1 million metrics per second on a 16-core virtual machine while maintaining just 50% utilisation [12]. Real-world success stories highlight the impact of such tools: TMB Barcelona cut troubleshooting times from 2–3 minutes to just 30 seconds by leveraging per-second granularity [12][13]. Similarly, the Falkland Islands Government reduced website downtime by 99% and slashed their cloud costs by 30% in 2025 by implementing real-time alerts and optimising resources [12][13].
Cost models also vary widely. Traditional platforms often charge based on log volume, which can lead to unpredictable bills during traffic spikes [13][16]. Netdata, however, uses a per-node pricing model with P90 billing
, which excludes brief usage spikes and the three highest-usage days each month. This, combined with its distributed architecture, can reduce total ownership costs by up to 90% [13][16]. These differences in pricing highlight the importance of finding a solution that aligns with your organisation's needs.
Customised Solutions with Hokstad Consulting
For organisations that require more than generic solutions, Hokstad Consulting provides tailored monitoring architectures designed specifically for hybrid cloud environments. Their approach focuses on reducing monitoring expenses by 30–50% through strategic tool selection and configuration adjustments.
For clients with strict data sovereignty requirements, Hokstad Consulting offers edge-native architectures. These keep sensitive data on-premises while still allowing cloud-based visualisation. Their expertise also extends into AI-powered predictive analytics, enabling a shift from reactive monitoring to proactive issue prevention. Whether it’s integrating AWS CloudWatch with on-premises systems or ensuring consistent observability across Azure, GCP, and private data centres, Hokstad Consulting delivers solutions that grow alongside your business.
Common Challenges and How to Overcome Them
Data Silos and Visibility Gaps
In hybrid cloud setups, infrastructure components often operate in silos. By 2024, 87% of enterprises were using two or more public clouds [9]. The challenge? Each cloud provider employs distinct schemas for metrics, namespaces, and labels [9]. This means if a latency issue in Google Cloud Platform (GCP) impacts an AWS microservice, it’s likely to appear as two unrelated anomalies rather than a single connected problem [9].
The key to tackling this lies in adopting a unified observability platform. OpenTelemetry (OTel) offers a vendor-neutral approach to bridge these gaps, enabling correlation across cloud environments [17][8]. For organisations with strict data sovereignty rules, virtual taps (vTAPs) can capture and copy inter-cloud data, feeding it into on-premises monitoring systems to avoid blind spots [18]. Additionally, using mandatory tags can help align data across different cloud platforms [9].
The goal of multi-cloud monitoring is not to eliminate native tooling - it is to add a correlation plane above it. The best architectures are additive, not replacement-focused.- CIOPages Editorial Team [9]
This step lays the groundwork for addressing the next challenge: alert fatigue and correlation issues.
Alert Fatigue and Correlation Problems
Operations teams often face a flood of alerts, making it hard to distinguish genuine incidents from noise. The problem worsens when logs, metrics, and traces are disconnected, forcing teams to manually connect the dots.
OpenTelemetry addresses this by organising logs, metrics, and traces into spans
, which provide the context needed to link application events across hybrid infrastructures [8]. Because OTel is an open standard, it allows organisations to switch observability platforms without re-instrumenting their applications [8]. However, telemetry data must be carefully managed - transferring data between environments should only happen when it delivers clear business benefits [8].
While managing alerts is crucial, scaling monitoring systems for hybrid environments is an equally pressing concern.
Scalability and Performance at Scale
As hybrid cloud environments grow, scalable architectures must rise to meet the demand. The hybrid cloud market is expected to hit £180 billion by 2032 [19]. Advanced AIOps correlation engines can reduce alert noise by 70–85%, significantly easing the burden on operations teams [19]. Distributed architectures that process data locally minimise the latency and cost of moving large telemetry volumes across cloud boundaries [8][19]. This approach evolves monitoring from basic dashboards to single panes of intelligence
, which provide a holistic view across multiple cloud environments [19].
You cannot fix an organizational intelligence gap with another dashboard. You fix it with an architecture that was designed, from the ground up, to operate across boundaries.- Heal Software [19]
For businesses aiming to implement scalable monitoring systems, expert guidance is crucial. Hokstad Consulting, for example, specialises in creating distributed monitoring architectures. Their solutions use AI-driven predictive analytics to help organisations prevent issues before they affect users. By focusing on scalability and performance, they ensure monitoring systems grow alongside infrastructure while keeping operational costs in check.
Conclusion and Next Steps
Real-time monitoring brings together hybrid cloud infrastructures, offering a clear view across systems by combining end-to-end observability with AI-powered analytics. With this approach, organisations can address issues faster and cut operational costs. The results speak for themselves: businesses adopting these strategies often achieve up to 50% less downtime, 30–40% quicker incident resolution, and 25% savings on cloud costs thanks to improved resource management.
To take advantage of these benefits, it's important to act methodically. Start by reviewing your current monitoring tools to spot any gaps in compatibility. Then, choose a centralised platform that supports unified telemetry and test AI analytics on critical metrics. A 30-day proof-of-concept can help confirm the effectiveness of this unified approach before committing to a full rollout. These steps can shift your monitoring strategy from reactive problem-solving to proactive management.
For businesses seeking tailored solutions, Hokstad Consulting offers expertise in DevOps transformation, cloud cost management, and hybrid monitoring automation. Their process integrates monitoring directly into CI/CD pipelines, ensuring observability evolves as your infrastructure grows. By managing configurations as version-controlled code and consolidating data from platforms like AWS, Azure, and on-premises systems into user-friendly dashboards, they help clients achieve 30–50% reductions in cloud expenses - all while maintaining GDPR compliance for UK-based organisations.
FAQs
Where should I start with real-time monitoring in a hybrid cloud?
To get started, set up a unified monitoring system that brings together logs, metrics, and traces from on-premises setups, private clouds, and public clouds. A centralised dashboard is key for clear visibility and efficient troubleshooting. Choose tools that can scale, offer real-time alerts, and support Kubernetes. To maintain data consistency, consider methods like change data capture (CDC) and event-driven synchronisation. These steps are essential for enabling effective real-time monitoring in hybrid cloud environments.
How do I keep traces and logs connected across cloud and on-prem boundaries?
To keep traces and logs connected across both cloud and on-premises environments, it's crucial to have a unified monitoring strategy that brings together metrics, logs, and traces. Tools such as OpenTelemetry can offer a standardised framework for tracking requests within hybrid setups. Additionally, using centralised monitoring platforms designed to support hybrid architectures ensures better oversight. For smooth data transfer and visibility across these environments, secure, high-bandwidth network connections - like VPNs or dedicated links - are essential.
How can I reduce alert noise without missing real incidents?
To cut down on unnecessary alerts while still catching critical incidents, it's smart to adopt effective alerting strategies alongside advanced monitoring tools. Prioritise approaches like setting dynamic baselines, using historical data thresholds, and categorising alerts by severity.
Some essential practices to consider:
- Implement structured logging for better clarity.
- Keep an eye on key metrics like error rates and latency.
- Use AI-driven anomaly detection to spot unusual patterns.
Make it a habit to review your configurations regularly. Also, consolidating alerts into unified dashboards can help prevent overload and ensure your system remains dependable.