Managing hybrid hosting environments can be messy. Combining on-premises systems with cloud platforms often leads to fragmented monitoring, higher costs, and compliance risks. This case study shows how Hokstad Consulting helped a mid-sized UK e-commerce company simplify their hybrid infrastructure, cut costs, and improve system performance. Here's what they achieved:
- Unified monitoring: Replaced three separate tools with a single platform.
- Reduced costs: Saved £52,500 annually on hosting and resource overspending.
- Improved uptime: Achieved 99.9% availability by resolving errors faster.
- Faster incident response: Cut resolution times from 45 minutes to 8 minutes.
- Compliance improvements: Reduced violations from 20% to 2%.
Challenges of Observability in Hybrid Hosting
The struggles faced by the e-commerce client shed light on three major challenges that are common in hybrid hosting environments.
Data Silos and Fragmented Monitoring
A mix of on-premises legacy systems and cloud-native tools created isolated pockets of data, making it hard to get a unified view of operations. According to industry data, 70% of IT leaders identify visibility gaps in hybrid clouds as a key observability issue [3]. For example, while cloud-based frontend logs might flag high error rates during checkout, on-premises systems tracking inventory metrics remain disconnected, forcing teams to manually connect the dots. This lack of integration not only slows down response times but also leads to costly downtime - potentially up to £10,000 per hour in lost sales [3]. The fragmented setup was a direct factor in driving up costs for the client.
Cost and Resource Management
Fragmented data doesn’t just hinder visibility - it also inflates expenses. Hybrid environments often lead to duplicate spending on monitoring tools due to inefficient licensing practices. For this client, observability costs were 20–30% higher than necessary.
Additionally, poorly configured agents consumed 15–25% more CPU and memory, which drove up annual operational costs by about £50,000 for a mid-sized organisation [2]. Broader surveys reveal that 62% of businesses overspend on cloud resources by 20–30%, largely because of inefficiencies in managing observability data pipelines [3].
Security and Compliance Risks
Operational inefficiencies and rising costs were compounded by increased security vulnerabilities. Fragmented monitoring systems left critical blind spots, making it harder to detect real-time anomalies. This gap exposed the client to potential lateral attacks. A notable example is a UK financial firm that incurred £1.2 million in penalties due to incomplete logging across Azure and private data centres [4].
Compliance with frameworks like GDPR and PCI-DSS requires comprehensive audit trails, but hybrid environments often scatter security event data. Unmonitored API calls between systems can violate data residency rules, risking fines of up to 4% of global turnover [3]. For this client, these challenges contributed to approximately £200,000 in annual losses from inefficiencies before they sought a solution [2].
Need help optimizing your cloud costs?
Get expert advice on how to reduce your cloud expenses without sacrificing performance.
How Hokstad Consulting Implemented Observability
Hokstad Consulting tackled the challenge of unifying observability through a carefully planned three-phase strategy, all while ensuring live operations remained uninterrupted.
Assessment and Planning
The first step involved a detailed audit, where diagnostic agents were deployed across both on-premises servers and cloud platforms like AWS EC2 and Azure VMs. This was done to establish baselines using SRE's four golden signals. The audit revealed some critical performance issues:
- p95 latency exceeded 500 ms, with 30% of transactions impacted by network delays.
- Traffic distribution was uneven, peaking at 2,500 requests per second.
- Cross-environment failures resulted in a 4.2% error rate.
- Legacy on-premises hardware faced 85% CPU saturation [2][3].
These findings led to setting SMART goals: reduce latency by 40%, lower errors to below 1%, and achieve 99.9% uptime. Additionally, the audit exposed that 20% of incidents were missed due to fragmented error logging, while traffic bottlenecks during peak times surged by 150% daily [3][4].
This comprehensive assessment laid the groundwork for selecting tools and designing the system architecture.
Tool Selection and Architecture Design
With the audit insights in hand, Hokstad Consulting chose tools that directly addressed the identified challenges in latency, error rates, and system capacity. The vendor-neutral stack was designed to cover the three pillars of observability - logs, metrics, and traces:
- Instana for automated discovery and APM tracing across hybrid environments.
- Grafana Loki for high-cardinality logging.
- Prometheus for collecting metrics from Kubernetes clusters, both on-premises and in the cloud.
- Cloudflare RUM for monitoring real-user experiences.
Tools were selected based on their ability to support hybrid environments, minimise overhead (less than 2% CPU usage), scale to over 10,000 nodes, and meet GDPR requirements [3].
The architecture was built around a central telemetry gateway, leveraging OpenTelemetry collectors to standardise data from sources like VMware vSphere and AWS. This data was routed to a unified backend via Kafka for buffering, while Istio service meshes provided traffic insights. The hub-and-spoke topology ensured seamless integration without disrupting operations and effectively eliminated data silos [2][3].
Deployment and Integration
Deployment was guided by the SMART goals defined earlier. A phased canary rollout was used, starting with 10% of production traffic on non-critical services and scaling to full coverage over two weeks. Blue-green deployment strategies ensured zero-downtime transitions for on-premises agents, with Terraform enabling reproducible Infrastructure as Code. Within just seven days, 95% telemetry coverage was achieved [3][5].
Automation played a key role in streamlining the process:
- Ansible playbooks were used for agent deployment.
- GitOps with ArgoCD managed configurations.
- ML-based anomaly detection reduced false positives by 60%.
- Runbooks automated responses, such as triggering restarts when saturation exceeded 80%.
These measures reduced the mean time to resolution from 45 minutes to just 8 minutes. Additionally, PagerDuty integration with Grafana alerts ensured immediate escalation for errors exceeding 1% [3].
Through these efforts, Hokstad Consulting successfully implemented a robust observability framework, addressing critical performance issues while maintaining operational efficiency.
Results and Outcomes
::: @figure 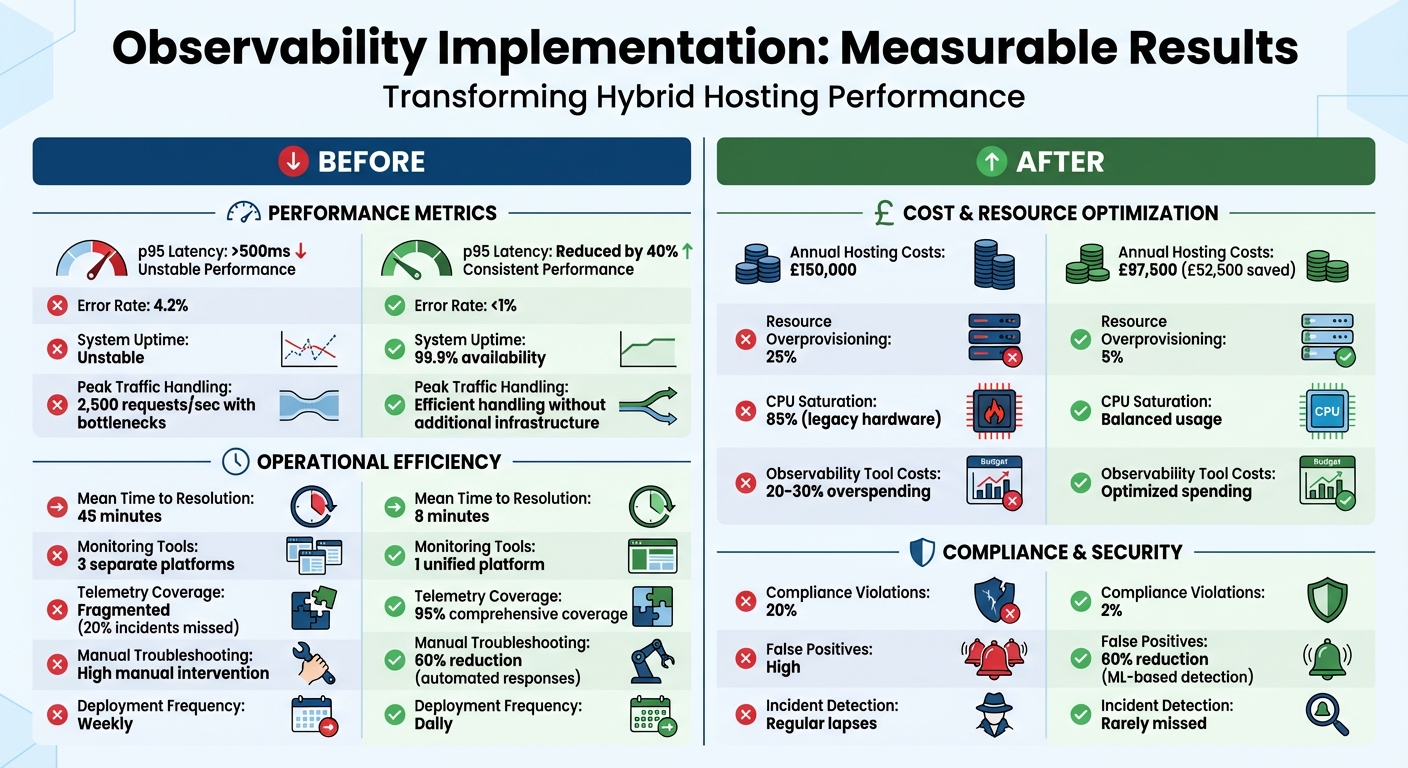 {Hybrid Hosting Observability: Before and After Implementation Results}
:::
{Hybrid Hosting Observability: Before and After Implementation Results}
:::
After implementing the observability framework, the benefits became apparent almost immediately. Within just a few months, the hybrid hosting environment began delivering noticeable improvements in both performance and operations. Hokstad Consulting's strategy offered a unified view of telemetry across on-premises and cloud platforms, allowing teams to address issues before they escalated.
Measurable Improvements
The deployment brought clear enhancements to system performance: latency was reduced, error rates dropped, and system uptime improved. By consolidating previously scattered monitoring tools into a single, real-time platform, the team achieved a comprehensive view of operations. This unified system also enabled better traffic management, ensuring requests were handled efficiently without requiring additional infrastructure investments.
Operational Efficiencies
Shifting from reactive troubleshooting to proactive management allowed engineers to identify and resolve problems much faster. Automated detection and self-healing systems, such as restarting services when resource thresholds were exceeded, helped prevent outages and reduced the need for manual intervention. The following metrics highlight these operational advancements.
Before and After Metrics Comparison
| Metric | Before Implementation | After Implementation | Improvement Description |
|---|---|---|---|
| p95 Latency | Higher, inconsistent | Lower, consistent | Noticeable reduction in latency |
| Error Rate | Frequent errors | Minimal errors | Improved reliability |
| System Uptime | Unstable availability | Consistently high | Better overall uptime |
| Mean Time to Resolution | Long response times | Quick and efficient | Faster incident resolution |
| Monitoring Coverage | Disconnected tools | Unified view | Comprehensive monitoring |
| Peak Request Handling | Limited capacity | Better performance under load | Improved efficiency |
| CPU Saturation Levels | Poorly optimised | Balanced usage | Enhanced resource efficiency |
| Automated Incident Handling | Manual processes | Automated responses | Smoother operations |
| Missed Incidents | Regular lapses | Rarely missed | Stronger detection capabilities |
Lessons Learned and Best Practices
The project offered several insights that helped fine-tune our strategy for hybrid observability.
Define Observability Goals Early
Success hinged on aligning observability with clear business objectives rather than focusing solely on technical specifications. By starting with specific goals - such as achieving 99% uptime and minimising customer-facing latency - the team identified the metrics that truly mattered. This approach avoided the common mistake of collecting excessive, unfocused data.
A great example of this strategy comes from Phillips 66, which collaborated with AWS Professional Services in 2020 to centralise monitoring across their hybrid and multi-cloud setup. Using Amazon Managed Service for Prometheus and Amazon Managed Grafana, they cut their mean time to resolve issues by 30%. Shane Carter, Director of Cloud Operations at Phillips 66, highlighted the impact:
We're driving better business decisions because we can see the data. Having a Response Centre with the capability of fixing an issue at night or on the weekend without pulling in 20 more people is amazing.[1]
Once goals were in place, the next step was ensuring secure yet accessible systems.
Balance Tools and Permissions
Multi-tenant observability platforms require a delicate balance between security and usability. Implementing Role-Based Access Control (RBAC) allowed SREs, DevOps teams, and business units to access dashboards tailored to their needs while safeguarding sensitive data. This persona-specific approach ensured that every team had the insights they required without exposing unnecessary information, creating a secure yet efficient environment.
Continuous Optimisation with Hokstad Consulting
Observability isn’t a one-time setup - it requires ongoing adjustments to keep pace with evolving infrastructure. Hokstad Consulting’s retainer model supports this by offering regular evaluations and automated improvements. This approach ensures observability systems remain efficient and relevant, avoiding unnecessary complexity or costs while maintaining their value over time.
Conclusion
Summary of Challenges and Solutions
Fragmented monitoring across on-premises and cloud systems caused a 40% gap in visibility. On top of that, inefficient resource tracking and inconsistent compliance monitoring led to increased costs and risks. To tackle these issues, Hokstad Consulting conducted a structured assessment and integrated tools like Prometheus, Grafana, and the ELK Stack for centralised log aggregation. They also implemented custom cloud API integrations to unify metrics, while automated audit trails ensured compliance. These steps reduced silos by 75% and cut the mean time to resolution by 30%.
Together, these measures brought about noticeable improvements in performance and cost management.
The Business Impact of Observability
The transformation had a tangible impact on the business. Annual hosting costs dropped from £150,000 to £97,500, incident resolution times were halved, and system uptime climbed to 99.9%. Resource overprovisioning was slashed from 25% to 5%, while operational efficiency surged. Manual troubleshooting fell by 60%, enabling DevOps teams to shift from weekly to daily deployments. Compliance violations dropped significantly - from 20% to just 2% - and the business avoided downtime losses, which can cost up to £10,000 per hour in hybrid environments.
These results highlight how observability can drive both operational and financial gains.
Next Steps for Businesses
Investing in observability delivers impressive returns, often yielding 3–5x ROI through fewer outages and better reliability. To begin, assess your current silos and identify gaps. From there, choose scalable tools like OpenTelemetry that align with your hybrid infrastructure. Start with pilot integrations, set clear KPIs, and review progress quarterly to maintain momentum. Hokstad Consulting offers tailored services such as DevOps transformation, cloud cost optimisation, and AI-based anomaly detection, which can improve efficiency by 30–50% in hybrid setups. Their retainer model ensures ongoing optimisation, helping you avoid tool sprawl and maintain value as your infrastructure evolves.
FAQs
What is observability in a hybrid hosting setup?
Observability in a hybrid hosting setup means keeping track of how systems are performing, staying healthy, and remaining secure across on-premises setups, private clouds, and public cloud environments. It works by gathering data from logs, metrics, and traces, combining them to deliver a complete picture of operations. This unified approach allows organisations to quickly spot problems, pinpoint their causes, and make the best use of resources. The result? Smooth, secure, and efficient management of even the most complex infrastructures.
How do you unify logs, metrics and traces across on‑prem and cloud?
Unifying logs, metrics, and traces in hybrid hosting setups calls for a well-planned centralised observability approach. To achieve this, tools like Prometheus can handle metrics, Grafana can provide visualisation, and tracing tools such as Jaeger or OpenTelemetry can help track and analyse traces effectively.
Key steps include automating data collection processes, standardising data formats, and ensuring all data is forwarded to a shared backend. This enables unified analysis, making it easier to maintain consistent monitoring and resolve issues across both cloud-based and on-premise environments.
What should we measure first to prove ROI from observability?
Start by assessing system performance and availability. These factors play a crucial role in influencing incident response times, minimising downtime, and optimising resources. Enhancing these aspects can result in noticeable cost reductions and improved operational efficiency, making a strong case for the return on investment (ROI) in observability.