
Nginx powers nearly 30% of websites globally, handling over 15,000 requests per second with minimal resource usage. For UK businesses, scaling Nginx in cloud environments offers high performance but comes with challenges like misconfigurations, SSL/TLS management, and security vulnerabilities (affecting 43% of cloud setups).
To optimise Nginx for heavy traffic and reduce costs:
- Performance Tuning: Adjust
worker_processesandworker_connectionsto match CPU cores and traffic needs. Enable caching for static and dynamic content. - Modern Features: Use HTTP/2 for faster load times and Gzip/Brotli compression to save bandwidth.
- Automation: Deploy with tools like Terraform and Ansible for consistent, error-free setups.
- Cost Efficiency: Implement auto-scaling groups and spot instances to dynamically adjust resources.
- Monitoring: Use Nginx Amplify for real-time metrics, alerts, and historical data to plan capacity and troubleshoot issues.
Scaling requires fine-tuning configurations, automating deployments, and proactive monitoring to balance performance, cost, and reliability.
Dynamically Scale NGINX in Your Containerized Environment
Nginx Performance and Reliability Setup
Getting Nginx to perform well under heavy loads means fine-tuning worker settings, caching, and protocols. For UK-based cloud deployments, these adjustments can help you balance performance and cost. Let’s start by optimising worker processes to make the most of Nginx's capabilities.
Worker Process and Connection Configuration
Nginx stands out for its ability to handle thousands of connections without creating a new thread for each one. Instead, it uses a master process that manages multiple worker processes. To optimise this:
-
Set the
worker_processesdirective to match the number of CPU cores. Usingautoensures Nginx detects and utilises all available cores:worker_processes auto; Adjust the
worker_connectionsdirective to define how many connections each worker can manage. Start with 1,024 connections per worker and scale based on traffic. For instance, a server with 4 CPU cores and 1,024 worker connections can theoretically handle 4,096 connections simultaneously.
File descriptor limits can also become a bottleneck. To prevent this, update /etc/security/limits.conf for the Nginx user:
nginx soft nofile 65536
nginx hard nofile 65536
Enabling keepalive connections is another way to reduce overhead, especially for HTTPS traffic. Use the following directive to reuse established connections:
keepalive_timeout 65;
Keep an eye on CPU and connection loads using tools like htop or ss -s to ensure your configuration is performing as expected.
Nginx Caching Setup
Caching is a game-changer for reducing server load and speeding up responses. With Nginx, you can serve frequently requested content directly from memory or disk instead of processing every request from scratch. Here’s how to configure it:
-
Proxy Caching: This is ideal for dynamic content. Define the cache path and memory zone in your main configuration:
proxy_cache_path /var/cache/nginx levels=1:2 keys_zone=my_cache:10m max_size=10g
                 inactive=60m use_temp_path=off;
This setup creates a 10MB shared memory zone for cache metadata and allows up to 10GB of cached content on disk. The directory hierarchy (
levels=1:2) helps avoid filesystem issues when storing many files. -
Enable caching for specific locations:
location / { proxy_cache my_cache; proxy_cache_valid 200 302 10m; proxy_cache_valid 404 1m; proxy_pass http://backend; } -
Static File Caching: Use browser caching to reduce repeated downloads. For static assets like images, set a longer expiration period:
location ~* \.(jpg|jpeg|png|gif|ico|svg)$ {
    expires 30d;
    add_header Cache-Control "public, immutable";
}
For CSS and JavaScript files, which may change more often, opt for a shorter expiration period:
location ~* \.(css|js)$ {
    expires 7d;
    add_header Cache-Control "public";
}
To prevent outdated content being served after updates, implement cache purging in your deployment process. This ensures users always get the latest content without waiting for the cache to expire naturally.
HTTP/2 and Compression Configuration
Modern websites rely heavily on HTTP/2 and compression to deliver faster load times and reduce bandwidth usage. These are particularly useful for businesses in the UK, where mobile users often face varying connection speeds.
-
HTTP/2: This protocol improves performance through multiplexing, allowing multiple requests and responses over a single connection. To enable HTTP/2, ensure you’re using Nginx version 1.9.5 or later with HTTPS, then add the
http2parameter to yourlistendirective:server { listen 443 ssl http2; ssl_certificate /path/to/certificate.crt; ssl_certificate_key /path/to/private.key; }Check your implementation via browser developer tools or online services - look for the
h2
indicator in the network tab. -
Gzip Compression: This reduces the size of transmitted data, speeding up page loads and saving bandwidth. Enable it with:
gzip on; gzip_vary on; gzip_min_length 1024; gzip_types text/plain text/css text/xml text/javascript application/javascript application/xml+rss application/json; -
Brotli Compression: If supported by your Nginx build, Brotli offers better compression ratios for text content. Enable it with:
brotli on;
brotli_comp_level 6;
brotli_types
    text/plain
    text/css
    application/json
    application/javascript
    text/xml
    application/xml;
When using HTTP/2, avoid older optimisation techniques like domain sharding or file concatenation. These can interfere with the protocol’s efficiency. Instead, focus on refining individual resources to take full advantage of HTTP/2’s capabilities.
Nginx Deployment Automation
Dealing with multiple Nginx instances manually can quickly become chaotic. Automation simplifies the process, turning it into a streamlined, repeatable workflow that saves time and reduces the risk of errors. The secret lies in combining tools that handle both infrastructure setup and configuration management effectively.
Infrastructure-as-Code with Ansible and Terraform

For a robust automation setup, use Terraform for provisioning infrastructure and Ansible for managing configurations. Terraform handles creating cloud resources, while Ansible configures these resources using SSH.
Here’s an example of how you can use these tools together for Nginx deployments. First, set up your Terraform configuration to provision server instances:
resource "aws_instance" "nginx_server" {
  ami           = "ami-0c55b159cbfafe1d0"
  instance_type = "t3.medium"
  key_name      = "nginx-key"

  tags = {
    Name        = "nginx-server"
    Environment = "production"
  }

  provisioner "local-exec" {
    command = "ansible-playbook -i '${self.public_ip},' nginx-setup.yml"
  }
}

output "nginx_server_ip" {
  value = aws_instance.nginx_server.public_ip
}
Next, use an Ansible playbook to install and configure Nginx on the provisioned servers:
---
- hosts: all
  become: yes
  tasks:
    - name: Update apt cache
      apt:
        update_cache: yes

    - name: Install Nginx
      apt:
        name: nginx
        state: present

    - name: Copy Nginx configuration
      template:
        src: nginx.conf.j2
        dest: /etc/nginx/nginx.conf
      notify: restart nginx

    - name: Ensure Nginx is running
      service:
        name: nginx
        state: started
        enabled: yes

  handlers:
    - name: restart nginx
      service:
        name: nginx
        state: restarted
Terraform outputs details like public IPs, which Ansible then uses to configure the servers. This integration ensures deployments are consistent and repeatable.
To keep things modular and manageable, store your Terraform and Ansible configurations in separate Git repositories. This makes it easier to maintain and reuse configurations across different projects or environments.
CI/CD Pipeline Configuration Testing
Configuration testing is essential to avoid deployment issues. Modern CI/CD platforms like Jenkins, GitLab CI, or CircleCI can run automated tests whenever new code is pushed to your repository.
For example, in April 2025, Pooja Bolla showcased a CI/CD pipeline for Nginx using GitHub Actions and Docker. She demonstrated how testing could be seamlessly integrated into automated application workflows [1].
Here’s a sample GitHub Actions workflow for testing Nginx configurations:
name: Nginx Configuration Test
on:
  push:
    branches: [ main ]
  pull_request:
    branches: [ main ]

jobs:
  test-nginx-config:
    runs-on: ubuntu-latest
    steps:
      - uses: actions/checkout@v3

      - name: Test Nginx configuration syntax
        run: |
          docker run --rm -v $(pwd)/nginx.conf:/etc/nginx/nginx.conf nginx:alpine nginx -t

      - name: Run configuration validation
        run: |
          docker run --rm -v $(pwd):/workspace nginx:alpine sh -c "
            cp /workspace/nginx.conf /etc/nginx/nginx.conf &&
            nginx -T > /tmp/config-dump.txt &&
            grep -q 'test is successful' /tmp/config-dump.txt
          "

      - name: Performance test with sample load
        run: |
          docker-compose up -d nginx
          sleep 10
          curl -f http://localhost:80/health || exit 1
          docker-compose down
Incorporating automated load tests into your pipeline ensures performance remains stable after changes. Set up alerts to notify your team if performance metrics fall below acceptable thresholds. To maintain accuracy, keep the test environment as close to production as possible.
Scheduling regular load tests - either nightly or weekly - helps monitor performance over time. Document test parameters, results, and configurations to keep your team informed about system benchmarks.
Load Balancer Template Management
Using version-controlled templates for Nginx configurations ensures consistency across environments. Instead of manually editing configuration files, create reusable templates that can be deployed automatically.
Organise your template repository like this:
nginx-templates/
├── templates/
│   ├── nginx.conf.j2
│   ├── upstream.conf.j2
│   └── ssl.conf.j2
├── vars/
│   ├── production.yml
│   ├── staging.yml
│   └── development.yml
└── playbooks/
    └── deploy-nginx.yml
Here’s an example of a main Nginx template (nginx.conf.j2):
worker_processes {{ nginx_worker_processes }};
worker_connections {{ nginx_worker_connections }};

upstream backend {
{% for server in backend_servers %}
    server {{ server.ip }}:{{ server.port }} weight={{ server.weight }};
{% endfor %}
}

server {
    listen 80;
    server_name {{ server_name }};

    location / {
        proxy_pass http://backend;
        proxy_set_header Host $host;
        proxy_set_header X-Real-IP $remote_addr;
    }
}
Environment-specific variable files define the actual values:
# vars/production.yml
nginx_worker_processes: auto
nginx_worker_connections: 2048
server_name: api.example.co.uk
backend_servers:
  - { ip: "10.0.1.10", port: 8080, weight: 3 }
  - { ip: "10.0.1.11", port: 8080, weight: 3 }
  - { ip: "10.0.1.12", port: 8080, weight: 2 }
Using centralised web consoles for Nginx deployments can further simplify management. Features like sync groups ensure consistent configurations across multiple instances, while API-driven updates make it easy to integrate with existing workflows. Keeping configuration changes minimal allows for quick rollbacks when needed.
To prevent configuration drift, use Git tags to version your templates. Deployment scripts can then reference specific template versions, making it easier to revert to a previous setup if necessary.
Need help optimizing your cloud costs?
Get expert advice on how to reduce your cloud expenses without sacrificing performance.
Cost-Effective Nginx Scaling
Scaling Nginx efficiently doesn’t have to break the bank. For UK businesses, cloud costs can vary significantly as traffic ebbs and flows throughout the day. By adopting smart scaling tactics, you can dynamically adjust resources to meet demand without compromising performance.
Cloud Auto-Scaling Group Setup
Auto-scaling groups (ASGs) are key to keeping Nginx scaling affordable. These groups automatically adjust the number of running instances based on traffic, ensuring you only pay for what’s necessary. When setting up ASGs, think about your business’s peak hours. For many UK companies, traffic spikes during standard office hours and drops off after 6 pm. Configure your scaling policies to increase capacity before the workday begins and scale back after hours.
Here’s an example configuration for AWS auto-scaling:
{
  "AutoScalingGroupName": "nginx-asg-production",
  "MinSize": 2,
  "MaxSize": 10,
  "DesiredCapacity": 3,
  "TargetGroupARNs": ["arn:aws:elasticloadbalancing:eu-west-2:..."],
  "HealthCheckType": "ELB",
  "HealthCheckGracePeriod": 300,
  "DefaultCooldown": 300
}
To make scaling more effective, base your policies on critical metrics like CPU usage or request counts. As you gather real-world performance data, fine-tune thresholds to match your needs. Monitor scaling events closely during deployment to ensure everything is functioning as intended.
Next, let’s look at optimising backend communication with connection pooling.
Connection Pooling Configuration
Connection pooling can significantly improve performance and reduce costs by minimising the overhead of repeatedly establishing new connections between Nginx and backend servers. The keepalive directive in upstream blocks helps maintain persistent connections. Here’s an example setup:
upstream backend_pool {
    server 10.0.1.10:8080;
    server 10.0.1.11:8080;
    server 10.0.1.12:8080;

    keepalive 32;
    keepalive_requests 1000;
    keepalive_timeout 60s;
}

server {
    location / {
        proxy_pass http://backend_pool;
        proxy_http_version 1.1;
        proxy_set_header Connection "";
        proxy_set_header Host $host;
    }
}
This configuration keeps idle connections open, which can be adjusted based on your traffic patterns and backend server capacity. Fine-tuning connection timeouts is also essential. While longer timeouts reduce connection overhead, they can increase memory usage. A good starting point is a 60-second timeout, with additional adjustments to settings like proxy_connect_timeout and proxy_read_timeout depending on your application’s behaviour.
To ensure your setup remains balanced, monitor connection pool usage with Nginx status modules or third-party tools.
For even greater savings, let’s explore the use of spot instances.
Spot Instance Implementation for Backend Servers
Spot instances can slash costs by up to 90% compared to On-Demand pricing [2][3]. However, they come with the caveat of potential interruptions, so careful planning is essential. To maximise availability, configure auto-scaling groups with multiple instance types spread across different Availability Zones.
Here’s an example launch configuration for spot instances:
{
  "LaunchTemplate": {
    "LaunchTemplateName": "nginx-backend-spot",
    "Version": "$Latest"
  },
  "Overrides": [
    {
      "InstanceType": "t3.medium",
      "AvailabilityZone": "eu-west-2a",
      "SpotPrice": "0.05"
    },
    {
      "InstanceType": "t3a.medium",
      "AvailabilityZone": "eu-west-2b",
      "SpotPrice": "0.05"
    },
    {
      "InstanceType": "m5.large",
      "AvailabilityZone": "eu-west-2c",
      "SpotPrice": "0.08"
    }
  ]
}
To make the most of spot instances, use a price-capacity-optimised allocation strategy, which selects the most cost-effective and available options [2]. Handling interruptions is crucial. Configure your instances to monitor the EC2 metadata service for interruption notices and implement scripts for a graceful shutdown. For example:
#!/bin/bash
# Spot interruption monitoring script
while true; do
    if curl -s http://169.254.169.254/latest/meta-data/spot/instance-action | grep -q terminate; then
        # Gracefully drain connections
        nginx -s quit
        # Remove from load balancer
        aws elbv2 deregister-targets --target-group-arn $TARGET_GROUP_ARN \
            --targets Id=$(curl -s http://169.254.169.254/latest/meta-data/instance-id)
        break
    fi
    sleep 5
done
A mixed instance strategy combining spot and On-Demand instances can help balance cost savings with reliability. Additionally, take advantage of rebalance recommendations for early warnings about potential interruptions.
Real-world examples highlight the effectiveness of this approach. Delivery Hero achieved a 70% cost reduction by running Kubernetes on spot instances, while Lyft reported savings of 75% with minimal code adjustments [3]. These cases demonstrate that, with proper implementation, spot instances can deliver substantial savings without compromising reliability.
Amazon EC2 Spot Instances let you take advantage of unused EC2 capacity in the AWS cloud and are available at up to a 90% discount compared to On-Demand prices.- Amazon Web Services [3]
Regularly track your savings and review interruption handling procedures to ensure smooth operation during interruptions. This approach can unlock significant cost efficiencies while keeping your systems running reliably.
Nginx Amplify Monitoring and Troubleshooting
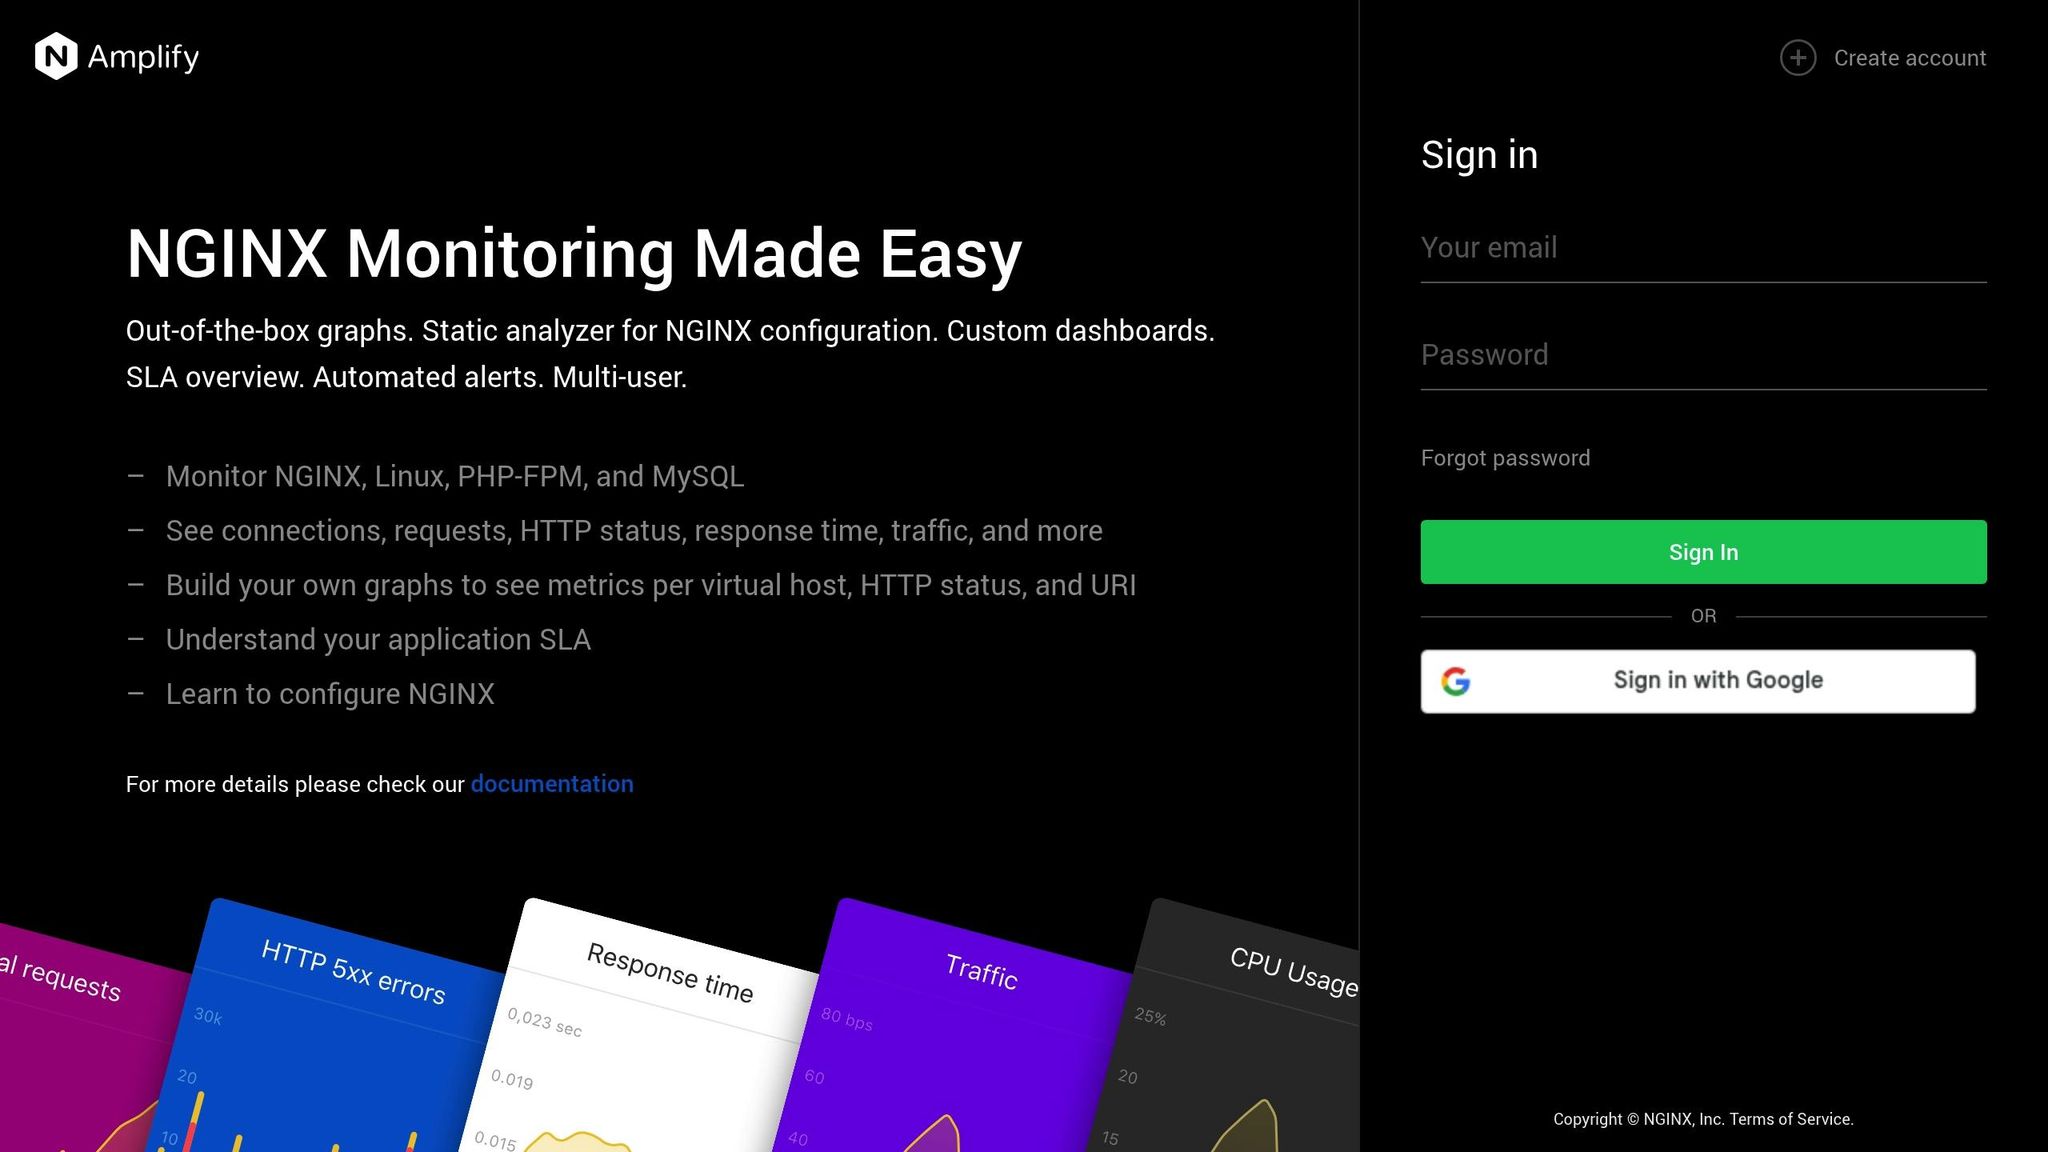
Shifting from reactive management to a proactive approach is key to maintaining smooth operations. Nginx Amplify offers UK enterprises a powerful way to monitor scaled deployments, ensuring peak performance while keeping costs in check. This SaaS-based tool, created by the Nginx team, delivers real-time metrics, alerts, and in-depth configuration analysis tailored specifically for Nginx environments [4].
At its core, Nginx Amplify combines a SaaS backend, a Python-based agent, and a web interface. The agent automatically detects Nginx instances, collects key metrics and metadata, and securely transmits this data to the backend for storage and visualisation [5][6]. By integrating Amplify into your scaling strategy, you can continuously validate performance improvements and cost-saving measures. These real-time insights, combined with historical data, allow for ongoing optimisation of your Nginx deployments.
Real-Time Metrics and Alert Setup
To start monitoring in real time, create an Amplify account and install the agent using your API key [4]. During installation, ensure the agent has the necessary permissions.
One critical step is enabling stub_status in your Nginx configuration, which allows the collection of essential metrics [5][6]. The agent then sends aggregated data to the Amplify backend at one-minute intervals, giving you near real-time visibility into your infrastructure [7].
For enterprises that serve global customers or operate across multiple time zones, setting up alerts tailored to local business hours and critical service windows is essential. Metrics like active connections, error rates, and response latency can act as early warning signs of capacity issues. Align alert thresholds with your service level agreements - for instance, configure alerts to trigger if error rates exceed a certain limit within a short timeframe or if response times fall below your performance benchmarks.
To ensure smooth operation, verify that your system’s DNS resolver can resolve receiver.amplify.nginx.com and that outbound TLS/SSL connections to this endpoint are allowed [7].
Historical Data for Capacity Planning
While real-time alerts are invaluable, historical data plays a crucial role in capacity planning and scaling decisions. Nginx Amplify’s data retention capabilities help you identify patterns, seasonal trends, and growth trajectories to guide your infrastructure planning [8]. Many UK businesses experience predictable traffic patterns tied to working hours, shopping seasons, or industry-specific cycles. By analysing historical data, you can adjust server utilisation to match these trends. For example, if your traffic consistently spikes between 9 AM and 5 PM GMT, you can implement auto-scaling policies to handle peak loads efficiently.
Use historical performance data to establish baselines and assess whether additional resources are necessary. Long-term trends may also highlight opportunities to optimise server configurations or refine scaling policies to better align with demand.
Error Diagnosis and Performance Fixes
Nginx Amplify excels at identifying performance issues and error trends that might otherwise go unnoticed in large-scale deployments. Its visualisation tools make it easier to spot problems like server bottlenecks, overloaded systems, or potential DDoS attacks [6]. This capability is especially important in distributed architectures, where a single issue can ripple across multiple services.
The Amplify dashboard is a valuable resource for diagnosing anomalies in key metrics. Sudden increases in error rates, connection timeouts, or memory usage can point to underlying issues that need immediate attention. Use the platform’s detailed analytics to uncover configuration mistakes, resource limitations, or external factors.
If metrics don’t appear as expected, check that the amplify-agent process is running and updating its log file [7]. Ensure the agent operates under the same user as your Nginx worker processes and that your Nginx instance is started with an absolute path. These steps help ensure accurate data collection and prevent gaps in monitoring.
For performance tuning, correlate Amplify’s data with application-specific metrics. For instance, if higher connection counts result in slower response times, you might need to adjust worker processes, set connection limits, or optimise upstream configurations. Regular monitoring ensures that these adjustments are effective as your infrastructure evolves.
Conclusion: Nginx Scaling Best Practices
From fine-tuning performance to staying ahead with proactive monitoring, scaling Nginx effectively requires a balanced approach. Enterprises aiming to scale Nginx must focus on performance adjustments, deployment automation, cost efficiency, and consistent monitoring. With the right configuration, Nginx can manage 400,000–500,000 requests per second in clustered environments and 50,000–80,000 in non-clustered setups, all while maintaining just 30% CPU load [10].
Start with performance tuning. Set worker_processes auto; to align with your CPU cores, and tweak worker_connections to handle expected traffic loads [9]. Enabling Gzip compression can cut data transfer sizes by up to 70% [11], while implementing effective caching strategies helps ease server strain [9].
To avoid configuration drift, adopt Infrastructure-as-Code tools like Ansible and Terraform. Automate repetitive tasks such as SSL certificate renewal, log rotation, and backups. This not only reduces manual intervention but also ensures smoother operations and fewer disruptions.
Consider cost management strategies like auto-scaling groups and spot instances for backend servers. These approaches can significantly lower expenses, with some examples showing savings of up to 35% on AWS EC2 and as much as 73% on total AWS bills through smarter resource allocation [12].
Real-time monitoring is essential for identifying issues early, while historical data aids in capacity planning. This is especially important given that API calls now make up approximately 83% of internet traffic [13]. Strong monitoring systems ensure your infrastructure remains reliable and scalable.
Ultimately, performance, automation, cost management, and monitoring are deeply interconnected. Performance gains require validation, and cost savings depend on seamless automation. Together, these practices enable sustainable scalability. Even a one-second delay in response time can result in a 7% drop in conversions [11], highlighting the critical importance of these strategies for business success.
FAQs
How can I optimise my Nginx configuration to handle high traffic without overloading the server?
To make sure your Nginx server can handle high traffic effectively, there are a few strategies you can put into action:
Optimise worker processes and connections: Set
worker_processesto align with the number of CPU cores and adjustworker_connectionsto manage more simultaneous connections. A good starting point is usingworker_processes auto;andworker_connections 1024;.Use caching: Implement proxy and static file caching to ease the server's workload and speed up response times, particularly during busy periods.
Enable Gzip compression: Activating Gzip (
gzip on;) helps minimise data transfer sizes, which boosts loading speeds and reduces bandwidth consumption.
By keeping an eye on traffic trends and tweaking these settings as needed, you can ensure your server stays reliable and performs well, even when traffic spikes.
What are the best practices for automating Nginx deployments to ensure consistency and minimise errors?
To streamline Nginx deployments, leveraging configuration management tools such as Ansible or Terraform can make a big difference. These tools automate tasks like installation, configuration, and deployment across multiple servers, ensuring consistency while minimising the chances of manual errors. For instance, with Ansible playbooks, you can define how Nginx should be configured and apply those settings uniformly across all your environments.
Another way to enhance efficiency is by incorporating CI/CD pipelines into your workflow. Tools like GitHub Actions or Jenkins can automate updates and configuration changes, triggered by code commits or scheduled tasks. This not only accelerates deployment processes but also reduces human error, creating a more reliable and seamless system.
What’s the best way to monitor and troubleshoot my Nginx setup to avoid performance issues and security risks?
To keep your Nginx setup running efficiently and securely, using dependable monitoring tools and adopting a systematic approach to logging and performance analysis is key. Tools like NGINX Amplify and Netdata are excellent for keeping an eye on critical metrics such as active connections, response times, and error rates. These insights allow you to quickly pinpoint and resolve performance bottlenecks or security weaknesses.
Regularly analysing Nginx logs is another essential step in identifying potential issues early. You can take it a step further by disabling any modules you don’t need, setting resource limits, and configuring security headers. When you combine vigilant monitoring with these practices, your Nginx environment can handle workloads at scale while staying reliable and secure.