
Choosing between AWS and Azure comes down to uptime, outage handling, and cost implications. Here's what you need to know:
- AWS (2023–2025): Average uptime of 99.95% with faster recovery times (2.8 hours on average). However, its US-EAST-1 region is prone to frequent issues, including a 15-hour outage in October 2025.
- Azure (2023–2025): Slightly higher uptime at 99.97%, but longer recovery times (4.2 hours on average). Azure's global outages, like the October 2025 Front Door failure, can impact all regions simultaneously.
- Outage Costs: SLA credits from both providers (10–30% for AWS, 10% for Azure) rarely offset financial losses. For example, a major AWS outage in 2025 cost £57 million per hour, far exceeding SLA rebates.
- Resilience: Both platforms require businesses to invest in multi-zone or multi-region setups to minimise downtime, which increases costs by 15–25% or more.
Quick Comparison Table:
| Feature | AWS | Azure |
|---|---|---|
| Global Uptime (2025) | 99.95% | 99.97% |
| Average Recovery Time | 2.8 hours | 4.2 hours |
| Major Outages (2025) | 6 incidents | 4 incidents |
| Key Weakness | US-EAST-1 region issues | Global outage risks |
| SLA Rebates | 10–30% of fees | 10% of fees |
Key Takeaway: AWS offers faster recovery but struggles with regional reliability, while Azure provides slightly better uptime but risks global disruptions. For mission-critical systems, a multi-region architecture is essential despite higher costs.
::: @figure 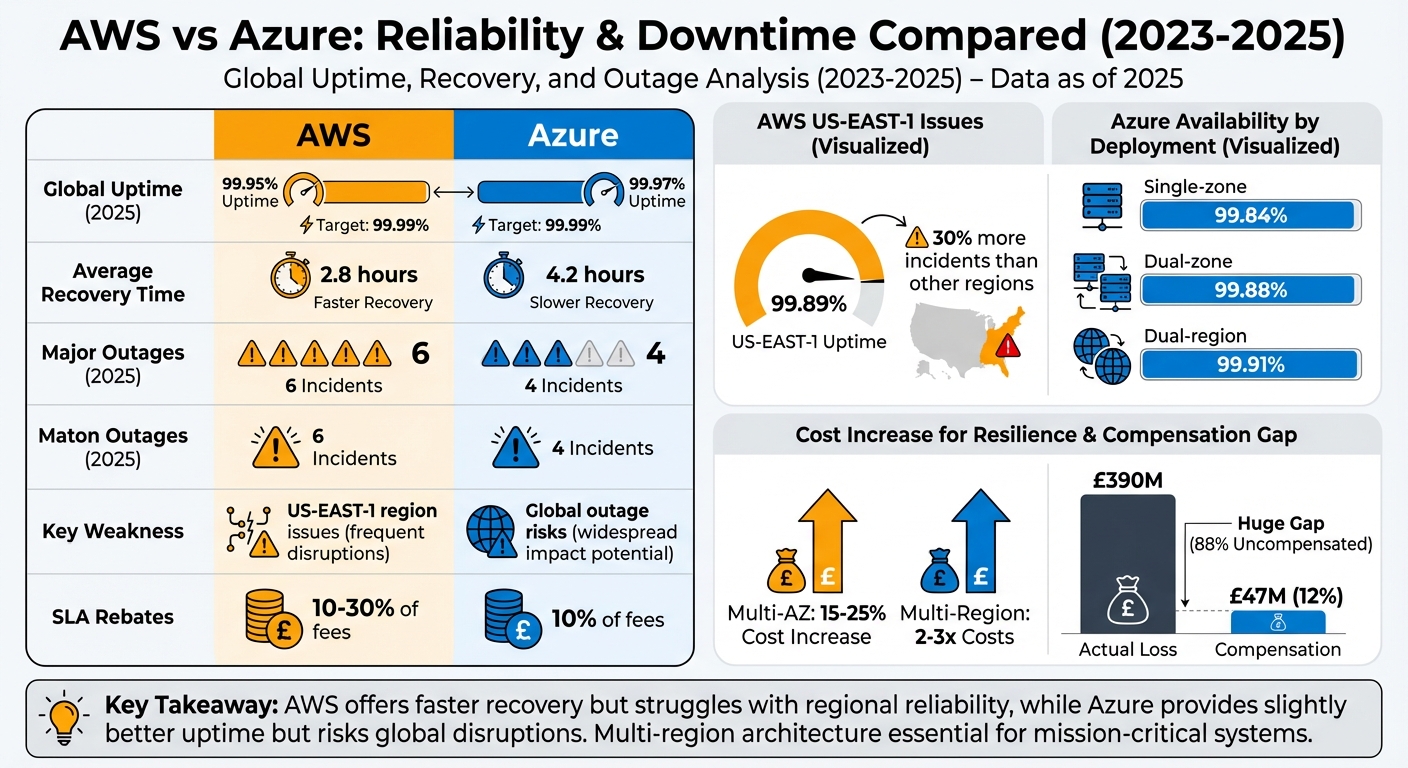 {AWS vs Azure Reliability Comparison 2025: Uptime, Recovery Times, and Outage Statistics}
:::
{AWS vs Azure Reliability Comparison 2025: Uptime, Recovery Times, and Outage Statistics}
:::
AWS Reliability and Downtime
AWS Uptime Performance and SLA Guarantees
AWS provides two specific SLA commitments for Amazon EC2: a Region-Level SLA of 99.99% for instances spread across multiple Availability Zones and an Instance-Level SLA of 99.5% for individual instances [9]. In practical terms, this allows for a maximum downtime of 52 minutes and 15 seconds annually. However, the October 2025 outage in the US-EAST-1 region - lasting an astonishing 15 hours - serves as a stark reminder that SLA guarantees don't always align with real-world scenarios.
This incident, spanning from 12:11 AM PDT to 3:00 PM PDT, resulted in a monthly uptime of roughly 97.9% for the affected region [8][9]. Consequently, AWS customers in this region became eligible for a 30% service credit, provided they submitted claims with the necessary request logs within two billing cycles [9].
Though uptime percentages are a key measure, AWS also incorporates robust reliability mechanisms aimed at minimising disruptions.
AWS Reliability Features
AWS’s infrastructure is built around Regions and Availability Zones (AZs), with each AZ designed to operate independently. This includes separate power sources, cooling systems, and redundant networking, all within a cell-based architecture intended to limit the impact of failures [6][10]. Even during outages, these designs aim to contain and mitigate the fallout.
AWS also automatically resolves 96% of network issues and thwarts millions of DDoS attacks almost instantly [10]. For organisations requiring minimal downtime, AWS offers advanced tools such as Resilience Hub, the Fault Injection Service for chaos engineering, and Elastic Disaster Recovery, which supports sub-second recovery point objectives [10]. Todd Peterson, Vice President at Broadridge, shared how his company leverages these tools:
At Broadridge, we have critical systems that can't afford to be down. We developed an 'always on' program using AWS services to ensure we were having near zero recovery time objectives and recovery point objectives
[10].
AWS Downtime Analysis
Even with these advanced features, certain incidents underscore the risks involved. The outage on 20 October 2025 primarily impacted the US-EAST-1 region (Northern Virginia), which is AWS’s oldest and most heavily utilised region [11][8]. A software update to the DynamoDB API triggered a race condition in AWS's internal DNS cache, disrupting essential endpoint resolution [8]. This failure quickly cascaded, affecting over 113 AWS services, including Lambda, IAM, CloudFormation, and SQS [8].
The ripple effects were far-reaching. Major platforms like Snapchat and Roblox faced outages or severe performance issues [11][8][12]. Over 17 million incident reports were filed globally [8], with some estimates suggesting the economic impact reached billions of pounds [12]. Reddit also experienced elevated error rates that stretched into the first week of November, even after AWS had restored its core operations [3]. This incident highlights a key vulnerability: the heavy reliance on US-EAST-1 as a central hub for global services creates a hub concentration
risk, where failures in one region can have worldwide consequences [11][12].
Azure Reliability and Downtime
Azure Uptime Performance and SLA Guarantees
In 2024, Azure's average application availability was reported as 99.84% for single-zone, 99.88% for dual-zone, and 99.91% for dual-region deployments [4]. These percentages translate to roughly 14 hours of downtime annually for single-zone deployments, exceeding the expected Service Level Agreement (SLA) estimates.
Azure promotes zone-redundant Virtual Machines with a 99.99% monthly uptime SLA, while Azure SQL zone-redundant deployments boast a 99.995% monthly availability SLA [16]. However, real-world performance doesn't always align with these promises. For instance, on 30th July 2024, Azure experienced a 5-hour global outage caused by a misconfiguration during DDoS attack mitigation efforts [4]. These SLA figures often act more as marketing benchmarks than as guarantees of uninterrupted service. They provide a useful backdrop for exploring how Azure's infrastructure and AI-driven tools aim to deliver reliability.
Azure Reliability Features
Microsoft's infrastructure is designed with resilience in mind, spanning multiple regions and incorporating dedicated Availability Zones (AZs). These zones consist of physically separate groups of data centres within a region, each equipped with independent power, cooling, and networking systems to safeguard against facility-level failures [14][15]. The latency between Availability Zones is kept under 2 milliseconds, ensuring swift communication [14].
Azure also leverages advanced AI-based operations, known as AIOps, to enhance reliability. One such system, Gandalf
, oversees deployment processes on a large scale, identifying potential issues early and automating decisions to roll out or roll back changes [1]. Another AI-powered initiative, Project Narya, predicts host failures, cutting down virtual machine interruptions by 26% [16]. Tom Harris, Chief Technology Officer at ClearBank, summarised the collaborative nature of maintaining reliability:
Ensuring end-to-end reliability and resiliency is a team effort. We get the tools from Azure, and we set up the systems and processes to put it all together.
Azure Downtime Analysis
Despite its robust architecture, Azure has faced notable operational challenges resulting in significant outages. For example, on 29th October 2025, a configuration error in Azure Front Door triggered an 8-hour global outage. An empty array in health probes incorrectly marked all backends as dead
, affecting services like Microsoft 365, Xbox Live, UK-based NatWest, and airlines such as Alaska and Hawaiian Airlines [18]. Recovery efforts were further delayed, prolonging the disruption [18].
Another incident occurred between 5th and 6th November 2025, when a voltage sag in the utility grid caused cooling units to fail in the West Europe region. This region, crucial for UK and European markets, experienced temperatures exceeding safe limits, forcing storage scale units to shut down. It took nearly 10 hours to manually reset systems and conduct thermal audits [13]. Similarly, on 10th January 2026, a power safety system activation in West US 2 led to a 7.5-hour outage, impacting services like Azure SQL, Cosmos DB, and Virtual Machines [13].
Azure's downtime patterns differ from those of AWS in a significant way. While AWS outages are typically confined to a specific region, Azure's global edge fabric misconfigurations can result in planetary
failures, impacting every region simultaneously [8][18].
AWS vs Azure: Side-by-Side Comparison
Reliability Metrics Compared
In 2025, Azure achieved a global uptime of 99.97%, slightly edging out AWS’s 99.95% uptime [19]. Azure faced four major incidents during the year, compared to AWS’s six [19]. However, AWS demonstrated a faster recovery time, with a Mean Time to Recovery (MTTR) of 2.8 hours, whereas Azure averaged 4.2 hours [19].
AWS’s US-EAST-1 region, which supports 30–40% of its workloads, had a more concerning uptime of 99.89% in 2025, with 30% more incidents than other AWS regions [19]. AWS provides granular health data on a service-by-service and region-by-region basis, while Azure offers a 90-day historical view, which can make long-term trend analysis more difficult [5].
One notable example of the financial impact of outages is Delta Air Lines, which reportedly faced a £390 million loss due to a significant service disruption. Despite this, the company received only £47 million in SLA compensation - just 12% of the actual loss [19].
Downtime Patterns and Regional Differences
The nature of outages and their geographic impact differ between AWS and Azure. AWS incidents are often regionally concentrated, particularly in US-EAST-1. For instance, in October 2025, a software bug in AWS’s internal DNS automation system caused a 15-hour outage in this region. This disruption affected over 4 million users and 3,500 companies, including major names like Reddit, Snapchat, and Robinhood. In the UK, Lloyds Bank and National Rail were also impacted [3][19].
Azure, on the other hand, frequently experiences disruptions originating from its edge
services, such as Azure Front Door, which can lead to global outages. A notable example occurred in October 2025, when a misconfiguration in Azure Front Door resulted in a nearly full-day outage. This incident affected services like Microsoft 365, Teams, NatWest, and retailers such as Kroger [3].
While Azure has made strides in reducing the frequency of outages, AWS continues to struggle with reliability issues in US-EAST-1. For businesses in the UK and Europe, Azure’s West Europe region has faced its own challenges. A cooling failure in November 2025 caused a 10-hour outage, disrupting services like AKS, MySQL Flexible Server, and Azure Databricks [17].
Reliability Trade-offs and Cost Implications
The differences in performance between AWS and Azure directly impact infrastructure costs and architectural decisions. Achieving higher availability often comes with a hefty price tag. Deploying applications across multiple availability zones (Multi-AZ) can increase infrastructure costs by 15–25%, while Multi-Region architectures may double or even triple costs due to added data transfer fees [19]. In 2024, dual-zone setups reduced annual downtime by 19 minutes compared to single-zone architectures, while dual-region deployments cut downtime to just one-fifth of single-zone durations [4].
At the lower end of the spectrum, the worst-performing cloud zones in 2024 had an annual availability of 99.71%, translating to 25 hours of downtime [4]. Businesses must weigh these figures against their tolerance for downtime. For example, a 99.99% availability target allows only 52 minutes of downtime per year - a level of reliability crucial for industries like e-commerce and point-of-sale systems. Achieving this requires automated recovery systems, rigorous testing, and highly specialised dependencies [7].
Control plane failures further complicate matters. In 2025, major outages for both AWS and Azure were tied to control plane or DNS automation issues, which can bypass Multi-AZ redundancy entirely [3][19]. For mission-critical applications aiming for 99.99% availability, Multi-Region architectures are essential, despite their higher costs. Additionally, using external monitoring tools like ThousandEyes or Pingdom is vital, as provider status pages often lag by 8–15 minutes [19].
Need help optimizing your cloud costs?
Get expert advice on how to reduce your cloud expenses without sacrificing performance.
Conclusion: Choosing the Right Cloud Provider
Key Findings and Recommendations
When weighing up AWS and Azure, UK businesses need to consider the trade-offs between downtime frequency and recovery speed. In 2025, Azure slightly outperformed AWS in uptime, achieving 99.97% compared to AWS's 99.95%. However, AWS had the edge in recovery times, restoring services in 2.8 hours versus Azure’s 4.2 hours [19].
It’s important to note that standard SLA credits rarely compensate for actual losses. To ensure reliability, organisations must build their own resilience through multi-zone or multi-region deployments. While this approach significantly increases costs, it’s crucial for mission-critical applications - like payment systems or e-commerce platforms - that demand 99.99% availability. In such cases, multi-region architectures become non-negotiable, despite the added expense.
For UK finance and public sector organisations, Azure’s built-in compliance features and seamless integration with Microsoft 365 can be advantageous. On the other hand, e-commerce and logistics industries may find AWS’s advanced auto-scaling capabilities and extensive global infrastructure better suited to their needs [2][20]. That said, both platforms come with regional vulnerabilities: AWS’s US-EAST-1 remains a major bottleneck, while Azure’s edge services like Azure Front Door have caused widespread outages [3][19].
How Hokstad Consulting Can Help
In light of these considerations, Hokstad Consulting specialises in creating resilient and cost-effective cloud solutions. Whether you’re transitioning to AWS, Azure, or adopting a multi-cloud strategy, we help UK businesses implement automated failover systems, map third-party dependencies, and set up external monitoring tools that bypass provider status pages - which often lag by 8–15 minutes during critical incidents [19].
Our cloud cost engineering services can cut infrastructure expenses by 30–50%, all while maintaining or improving reliability. We achieve this through strategic use of availability zones, caching mechanisms, and tailored automation. Additionally, our ongoing DevOps support ensures your recovery plans are regularly tested and your error budgets are effectively managed. Visit Hokstad Consulting to explore how we can optimise your cloud setup for maximum stability and cost efficiency.
October 2025: AWS, Azure and Microsoft 365 Services Global Shutdown

FAQs
How do the costs of AWS and Azure outages compare to their SLA credits?
When it comes to service credits, both AWS and Azure have policies in place for when they fail to meet their Service Level Agreements (SLAs). AWS determines these credits based on how much downtime occurred in relation to their monthly uptime targets. On the other hand, Azure calculates credits based on the severity of the SLA breach.
That said, the financial consequences of outages often go well beyond the value of these credits. Lost productivity, reduced revenue, and damaged customer trust can result in costs that far outweigh the compensation offered. These credits are meant to provide partial relief, but they’re not designed to cover the full scope of losses caused by downtime.
How do AWS and Azure compare in terms of recovery times?
AWS and Azure both emphasise keeping systems running smoothly and bouncing back quickly after issues, but they go about it in distinct ways. AWS leans on its shared responsibility model, offering flexible disaster recovery tools that operate directly within the cloud. In contrast, Azure focuses on ensuring high availability, backing critical services like compute and databases with SLAs that promise up to 99.99% uptime. Azure also includes features like zone-redundant virtual machines and geo-zone-redundant storage, designed to cut down on downtime and speed up recovery.
Both platforms are built to help businesses stay operational, but choosing between them boils down to your specific recovery needs and infrastructure priorities.
Why is having a multi-region architecture important for critical systems?
A multi-region architecture plays a crucial role in keeping critical systems running smoothly. By spreading workloads across different geographic regions, it significantly reduces the chance of a complete system failure caused by localised disruptions or unforeseen events.
This setup ensures businesses benefit from greater availability, quicker recovery times, and better performance for users, no matter where they are. It's especially important for industries like financial services or healthcare, where even brief downtime or data loss can lead to serious consequences.