
Scaling resources in a private cloud is about balancing performance and efficiency within a fixed hardware pool. Unlike public clouds, where over-provisioning increases costs, private clouds face resource contention instead. Automation simplifies this process by using tools to monitor metrics like CPU and memory usage, triggering scaling actions automatically. This ensures optimal resource use without manual intervention.
Key steps include:
- Monitoring Tools: Use tools like Metrics Server for real-time data, Prometheus for advanced metrics, and KEDA for event-driven scaling.
- Infrastructure as Code (IaC): Tools like Terraform and Ansible define and manage scaling policies.
- Orchestration: Kubernetes manages container workloads and enables seamless scaling using Horizontal Pod Autoscaler (HPA).
Automation improves productivity, reallocates idle resources, and ensures smooth scaling during demand changes. Testing with load simulations and refining scaling policies can help avoid common pitfalls like scaling delays or resource flapping. By combining monitoring, IaC, and orchestration, private clouds can scale efficiently without exceeding capacity limits.
How to configure Auto-Scaling in Private Cloud
Prerequisites for Setting Up Automation
To successfully implement automated scaling in a private cloud, you'll need a solid foundation of monitoring tools, Infrastructure as Code (IaC) solutions, and orchestration platforms. These elements work together to gather metrics, define scaling rules, and execute scaling actions automatically. Here's how these prerequisites fit into the process.
Monitoring and Metric Collection Tools
Accurate metrics are at the heart of effective scaling. Metrics Server plays a crucial role by collecting CPU and memory usage data from your infrastructure. This lightweight, in-memory tool updates metrics every 15 seconds, providing the data needed for scaling controllers like the Horizontal Pod Autoscaler (HPA) to function effectively [2].
For more advanced scaling needs, Prometheus offers a time-series database that records metrics with timestamps. It supports the OpenMetrics standard, enabling scaling decisions based on application-specific data like requests per second or queue depth. Grafana complements Prometheus by visualising these metrics in custom dashboards, making it easier to track system changes and identify scaling triggers before they cause performance issues.
If your scaling needs are driven by external events, KEDA (Kubernetes Event-Driven Autoscaling) is a powerful option. It enables scaling based on triggers like the length of a message queue. By using custom metrics adapters, external data can be linked to Kubernetes scaling APIs via custom.metrics.k8s.io or external.metrics.k8s.io.
While monitoring tools gather data, your infrastructure must also be prepared to adapt dynamically.
Infrastructure as Code (IaC) Solutions
Once metrics are in place, IaC tools help codify your infrastructure to respond to scaling triggers. Terraform and its open-source counterpart OpenTofu allow you to define your infrastructure's desired state using a declarative approach. These tools are ideal for creating repeatable, version-controlled configurations. When working with scaling groups, you can use lifecycle rules like ignore_changes = [desired_capacity] to ensure Terraform doesn't override dynamic scaling adjustments [2].
For ongoing operations, Ansible offers task-based YAML playbooks. These are particularly useful for configuration management and maintenance tasks, such as patching or manual scaling adjustments. Both Terraform and Ansible support idempotency, ensuring that applying the same code multiple times won't lead to duplicate resources or unintended changes during scaling events.
With your infrastructure defined in code, the next step is to manage workloads effectively.
Orchestration Platforms
Kubernetes is a key player in managing containerised workloads, using declarative YAML manifests to handle scaling and other tasks. To enable scaling, activate the API aggregation layer and register the necessary APIs (metrics.k8s.io, custom.metrics.k8s.io). Ensure that CPU and memory requests are explicitly defined in pod specifications, as these are critical for HPA calculations [2][5].
The Horizontal Pod Autoscaler is a standard API resource in Kubernetes that requires the installation of a metrics source, such as the Kubernetes Metrics Server, in the cluster.
When using HPA, make sure to remove the spec.replicas field from Deployment or StatefulSet manifests to avoid conflicts between manual and automated scaling configurations. Additionally, configure startupProbes or readinessProbes with appropriate initial delays to ensure smooth scaling operations [2]. For node-level scaling, integrate Kubernetes with your private cloud provider's API, allowing the platform to automatically provision or remove virtual machines as needed.
These tools and strategies form the backbone of an automated scaling system, ensuring your private cloud is both responsive and efficient.
Step-by-Step Guide to Automating Resource Scaling
::: @figure 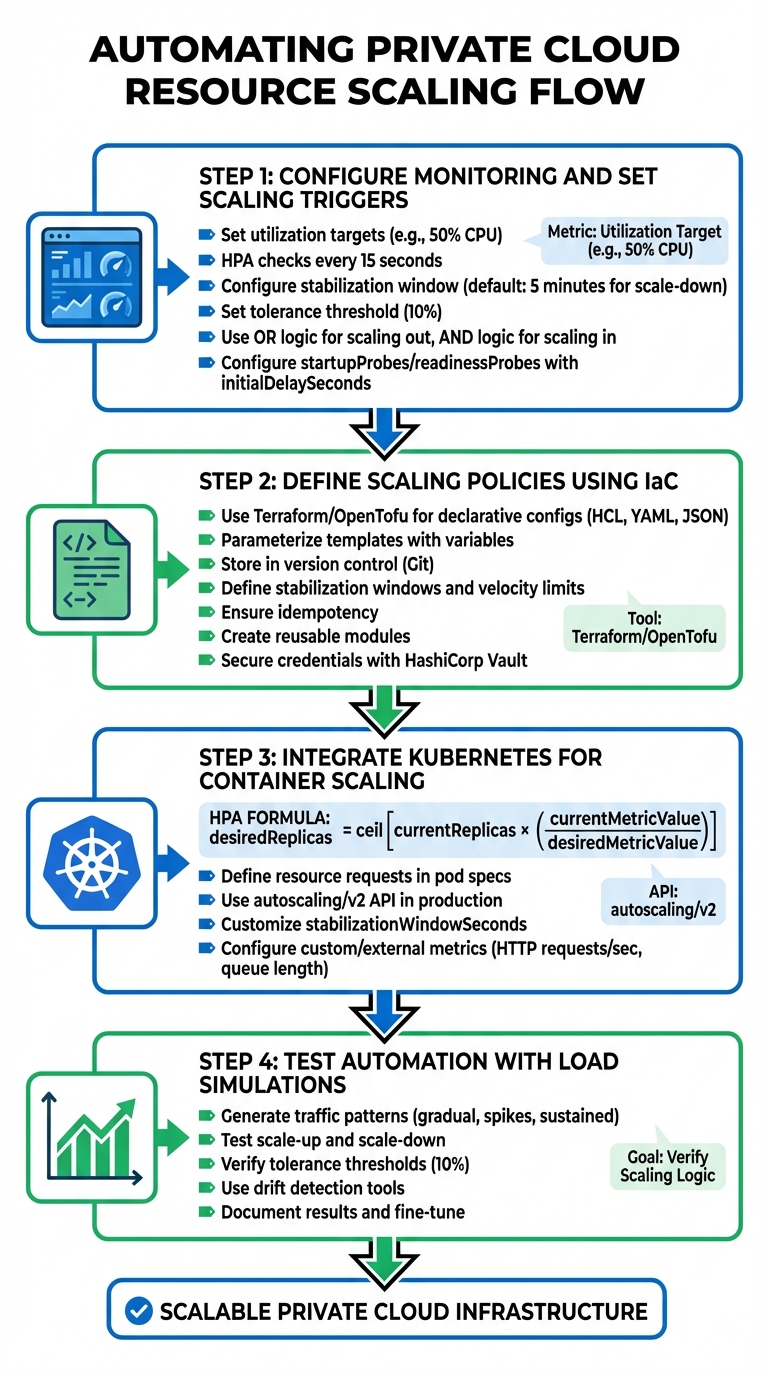 {4-Step Guide to Automating Private Cloud Resource Scaling}
:::
{4-Step Guide to Automating Private Cloud Resource Scaling}
:::
With your monitoring tools, Infrastructure as Code (IaC) solutions, and orchestration platforms in place, you're set to implement automated scaling. Each step builds on the last to create a responsive and efficient system.
Step 1: Configure Monitoring and Set Scaling Triggers
Start by setting utilisation targets to decide when scaling actions should occur. For example, if you're scaling based on CPU usage, a target of 50% utilisation might work well. The system compares current usage to this target to determine whether to add or remove resources [6][2]. Kubernetes' HorizontalPodAutoscaler (HPA) controller checks resource usage every 15 seconds by default, allowing for near real-time adjustments [2].
To avoid unnecessary scaling caused by short-lived spikes, configure a stabilisation window. For instance, the default 5-minute window for scaling down ensures the system considers the highest observed value during that time before removing resources [2]. This helps prevent thrashing
, where resources are added and removed too quickly, wasting both time and money. Additionally, set a tolerance threshold (commonly 10%) to ignore small fluctuations close to your target value [2].
Use OR
logic for scaling out (adding resources when any threshold is exceeded) and AND
logic for scaling in (removing resources only when all metrics fall below thresholds) [1]. For queue-based workloads, triggers can be based on metrics like work available per instance
- for example, 10 messages per virtual machine - rather than percentages [8].
To filter out misleading spikes during startup, configure startupProbes or readinessProbes with an initialDelaySeconds. This is especially useful for applications like Java, which may show high CPU usage during initialisation [2]. These configurations ensure scaling actions aren't triggered unnecessarily during application warm-up.
Step 2: Define Scaling Policies Using IaC
Once monitoring triggers are in place, formalise your scaling policies using IaC. Tools like Terraform or OpenTofu allow you to create declarative configuration files that specify your scaling parameters. These files, written in formats like HCL, YAML, or JSON, describe resources such as virtual machines, networks, and scaling thresholds [9][10].
Use variables to parameterise templates, making them adaptable for different environments. For instance, you could set different CPU thresholds for staging and production environments [9][10]. Store these IaC manifests in a version control system like Git to track changes, enable peer reviews, and allow for quick rollbacks if issues arise [9][10].
Define scaling behaviours and constraints within your code, such as stabilisation windows and velocity limits. For instance, you might restrict scale-down actions to 10% of current replicas per minute to avoid drastic reductions in capacity [2][11]. Ensure your IaC scripts are idempotent, meaning they always produce the same infrastructure state when applied multiple times [9]. Breaking scaling policies into reusable modules - like a web-tier-scaling
module - can reduce duplication across services [9]. Handle sensitive data securely by using tools like HashiCorp Vault, rather than hardcoding credentials into IaC files [9].
Step 3: Integrate Kubernetes for Container Scaling
Integrate your scaling policies with Kubernetes for automatic container management. The Horizontal Pod Autoscaler adjusts the number of replicas in your Deployments or StatefulSets based on the formula:
desiredReplicas = ceil[currentReplicas × (currentMetricValue / desiredMetricValue)] [2]. For this to function correctly, each container must define resource requests in its pod specifications [2][12].
If some of the Pod's containers do not have the relevant resource request set, CPU utilization for the Pod will not be defined and the autoscaler will not take any action for that metric.
- Kubernetes Documentation [2]
Always use the autoscaling/v2 API in production environments. It includes advanced features like multiple metrics, custom scaling behaviours, and adjustable stabilisation windows [11][12]. You can customise the stabilizationWindowSeconds in the behavior field to prevent rapid scaling changes. For instance, setting a longer window for scaling down - say 10 minutes instead of the default 5 - can help maintain stability after traffic surges [2][11].
For more tailored scaling, use custom or external metrics. Examples include HTTP requests per second or message queue lengths, which can be configured via the autoscaling/v2 API and specialised adapters [2][13].
Step 4: Test Automation with Load Simulations
Simulate different workloads to ensure your scaling setup behaves as expected. Generate traffic patterns that mimic scenarios like gradual increases, sudden spikes, and sustained high loads. Observe how quickly new resources are provisioned and whether stabilisation windows prevent excessive scaling.
Test both scaling up and scaling down. Ensure resources are added when thresholds are exceeded and removed when demand drops, but not so aggressively that you experience flapping.
Introduce minor metric fluctuations to confirm your tolerance thresholds (e.g., 10%) are working effectively and no unnecessary scaling occurs [2].
Use drift detection tools to verify that your IaC-defined policies match the actual infrastructure state. This ensures no manual changes have caused deviations from your defined scaling setup [9][10]. Document the results of each test, noting response times, resource counts, and any unexpected behaviours. Use this data to fine-tune your utilisation targets, stabilisation windows, and scaling velocity limits before deploying to production.
Need help optimizing your cloud costs?
Get expert advice on how to reduce your cloud expenses without sacrificing performance.
Best Practices for Effective Scaling
Once your automation is in place, refining your scaling setup is key to getting the most out of your private cloud environment. By carefully aligning your approach with workload demands and business goals, you can improve both performance and cost management.
Vertical vs Horizontal Scaling Considerations
With vertical scaling (scaling up), you expand the capacity of existing machines by adding CPU, memory, or storage. It's straightforward to implement but limited by hardware constraints. On the other hand, horizontal scaling (scaling out) distributes workloads across additional nodes, offering better fault tolerance. However, it requires applications to be built for distributed systems. To avoid unexpected expenses during automated scaling, set a maximum limit on the number of scale units. For example, some services like API Management instances may take up to 45 minutes to complete a scaling operation[14].
Cost Control and Resource Optimisation Strategies
Managing costs and optimising resources go hand in hand with scaling. A staggering 94% of organisations experience unnecessary cloud costs due to idle or over-provisioned resources[16]. To avoid this, focus on right-sizing workloads: adjust CPU and memory allocations to match actual usage. Over-provisioning wastes resources, while under-provisioning harms performance[17]. Tools like the Vertical Pod Autoscaler can help by running in audit mode
to suggest resource adjustments before applying them automatically[17].
For cost-effective scaling:
- Use Spot instances for fault-tolerant tasks.
- Leverage Savings Plans or Reserved Instances for predictable workloads.
- Reserve On-Demand instances for handling traffic spikes[17].
A 2023 case study found that adopting Terraform Cloud for self-service infrastructure provisioning saved over £20,000 monthly[16]. You can also schedule scaling to reduce resources to zero or a minimal baseline during off-peak hours, particularly in non-production environments[17]. Additionally, monitor critical time
- the duration from message dispatch to processing - rather than just queue length, to ensure scaling decisions are cost-effective[15].
Integration with CI/CD Pipelines
Defining scaling policies through Infrastructure as Code (IaC) ensures consistency and allows you to store configurations alongside application code in version control[19][7]. This approach simplifies updates and ensures that resource changes are automatically triggered by code changes. Use CI/CD pipelines to manage the provisioning process, from linting and validating IaC templates to deploying changes in staging environments and running automated tests before production rollouts[19].
For CI/CD infrastructure itself, tools like KEDA can autoscale runners based on pending job queue length, reducing wait times while keeping costs in check[18]. Include rollback mechanisms to revert changes in case of performance issues or deployment failures[19]. Finally, connect your CI/CD pipelines to monitoring systems to validate the effectiveness of new scaling policies immediately after deployment[19][15]. These practices create a reliable and efficient scaling setup, reducing risks and simplifying operations.
Common Pitfalls and Troubleshooting Strategies
Once you've implemented best practices, it's essential to prepare for potential challenges. Even the most well-designed automation systems can encounter hiccups, especially as they scale. By understanding where issues typically arise, you can create more resilient systems and respond quickly when problems occur.
Vendor Lock-In and Interoperability Issues
Relying heavily on a single vendor's proprietary tools can be risky in the long run. If you decide to migrate workloads or adopt a multi-cloud strategy, you might face the challenge of rewriting automation workflows. As Víctor Rampérez Martín pointed out in his doctoral thesis at Universidad Politécnica de Madrid:
Auto-scaling systems that can be used in multi-cloud environments are scarce, mainly due to the lack of a set of monitoring metrics that can be measured across multiple providers
[26].
To avoid being tied to a single provider, consider using cloud-agnostic Infrastructure as Code tools like Terraform or Pulumi. These tools keep your configurations portable and consistent across various environments[27][28]. Containerisation tools like Kubernetes also help by abstracting workload deployment, allowing you to move resources seamlessly between private and public clouds without major refactoring. Using vendor-neutral metrics that map across different monitoring systems can help you maintain SLA compliance above 99% of the time[26].
Another good practice is running what-if
simulations before applying automated changes. This allows you to preview the potential impact and avoid unintended disruptions[27]. Once interoperability is addressed, it’s important to consider delays and bottlenecks that can hinder scaling performance.
Scaling Delays and Performance Bottlenecks
Delays in scaling often occur due to metric aggregation lags. In private cloud environments, these delays can be worsened by physical hardware limitations, leading to automation failures when resource pools run out[20].
Here’s a breakdown of common scaling issues and their fixes:
| Scaling Issue | Common Cause | Recommended Fix |
|---|---|---|
| Flapping | Scale-out and scale-in thresholds are too close | Widen margins (e.g., scale out at 80% CPU, scale in at 60%)[15] |
| Scale-Up Failure | Pod resource requests exceed node capacity | Use larger machine types or adjust resource requests[21] |
| Halted Scaling | Over 45% of cluster nodes are unhealthy | Address node health issues before resuming scaling[21] |
| Slow Response | Long metric aggregation windows | Pre-scale resources or shorten aggregation windows to around 25 minutes[15] |
For traffic patterns that follow predictable trends, it’s better to pre-scale resources in anticipation of peak periods rather than waiting for demand to trigger scaling[15]. Additionally, ensure workload definitions are accurate. For instance, if a Kubernetes Pod requests more resources than any single node can provide, the autoscaler won’t initiate a scale-up[21].
Designing applications to be stateless can also help. By using distributed caches or databases, new instances can handle traffic immediately without waiting for synchronisation[20][15]. Once delays are managed, focus on debugging and alerting strategies to handle automation failures effectively.
Debugging and Alerting for Automation Failures
Troubleshooting automation failures requires clear visibility into the underlying issues. Common problems include missing resource baselines (e.g., containers without defined resources.requests), manual interventions that disrupt automation (like deleting instances individually instead of using scale-set commands), and overly strict PodDisruptionBudgets that block scale-in actions[23][22][24].
Centralising autoscale logs in a workspace like Log Analytics can help. You can query logs by CorrelationId to identify the rules that triggered scaling events[22]. Pay attention to the gap between the Observed Metric Value
and the Metric Threshold.
For example, Kubernetes' Horizontal Pod Autoscaler typically operates within a 10% tolerance, only triggering scaling when usage falls outside the 0.9 to 1.1 range[23].
Manual changes can also cause delays, as synchronisation with autoscale services may take up to an hour[22]. For pods not managed by a controller, adding the annotation "cluster-autoscaler.kubernetes.io/safe-to-evict": "true" ensures they don’t block node scale-downs[24]. Finally, setting a 10-minute cool-off period between scaling actions can prevent rapid, unnecessary node fluctuations[25][1].
Conclusion
Scaling a private cloud effectively involves blending continuous monitoring, policy triggers, and orchestration to create a seamless process [29]. This can be achieved by setting up monitoring tools, defining scaling policies using Infrastructure as Code (IaC), integrating Kubernetes for container-based workloads, and running load simulations to test your setup.
Unlike public cloud models, private cloud scaling works within a fixed resource pool, requiring a careful balance between horizontal scaling (adding replicas) and vertical scaling (adjusting CPU/memory) [3][4]. The AWS Well-Architected Framework emphasises this principle:
Use the elasticity of the cloud to scale your compute resources up or down dynamically to match your needs and avoid over- or under-provisioning capacity for your workload[31].
To make this work, you’ll need to focus on selecting the right metrics, setting appropriate cooldown periods, and addressing potential challenges like vendor lock-in or delays in scaling actions. For instance, standard autoscaling configurations often require metrics to meet thresholds for three consecutive minutes before triggering an event [30]. In some private cloud setups, this stabilisation period may extend to 30 minutes to ensure consistent performance [1].
FAQs
What are the advantages of using Infrastructure as Code for scaling resources in private clouds?
Using Infrastructure as Code (IaC) to manage resource scaling in private clouds offers several practical benefits. It enables consistent and automated provisioning, which cuts down on manual errors and simplifies deployment tasks. This level of automation also supports dynamic scaling by responding to real-time performance data, ensuring systems can quickly adjust to fluctuating demands.
IaC makes it easier to update and manage policies, helping to enforce compliance while making better use of resources. This approach improves scalability, allowing businesses to run their private clouds in a way that's more efficient, dependable, and cost-conscious.
How does Kubernetes handle resource scaling compared to other orchestration tools?
Kubernetes manages resource scaling using Horizontal Pod Autoscaling (HPA), which automatically adjusts the number of Pods based on real-time workload demands. This system helps balance resource usage efficiently, scaling up during periods of high demand and scaling down when the load decreases.
While some orchestration tools lean more heavily on manual scaling or vertical scaling (adding more resources to a single instance), Kubernetes focuses on automation and adaptability. This approach is especially useful for maintaining both performance and cost control in ever-changing environments.
How can I stop resource flapping in automated scaling systems?
To keep automated scaling systems steady and avoid resource flapping, try using stabilisation windows and cooldown periods. These mechanisms allow the system to pause for a set time before making adjustments, preventing constant scaling up and down.
Another key step is to configure your resource requests and limits accurately. Align these settings with actual workload requirements to avoid scaling issues caused by overestimating or underestimating resource needs. Incorporating multiple metrics - like CPU usage, memory consumption, and even custom application metrics - into your scaling decisions can also lead to a more balanced and dependable process.
Combining these approaches helps reduce disruptions and boosts the efficiency of your private cloud setup.