
Managing multi-cloud latency is all about reducing delays across different cloud providers like AWS, Azure, and GCP. UK businesses leveraging these platforms face challenges such as slower cross-cloud communication, unpredictable routing, and increased costs. Here's what you need to know:
- Latency Sources: Delays stem from network transit, compute processing, storage I/O, and application logic. Cross-cloud traffic often takes longer routes, adding milliseconds to user interactions.
- Impact: Even a 100 ms delay can lower conversion rates by 1%, while a 500 ms delay cuts revenue by 20%.
- Solutions:
- Choose Closely Located Regions: For UK deployments, use AWS London (eu-west-2) or GCP London (europe-west2) to keep latency under 5 ms.
- Private Connectivity: Tools like AWS Direct Connect or the new AWS Interconnect reduce costs and improve speed.
- Monitoring Tools: Use OpenTelemetry and distributed tracing to pinpoint latency issues.
- Optimise Routing: DNS-based routing, Anycast, and caching help cut delays.
- Continuous Testing: Embed latency checks in CI/CD pipelines to catch issues early.
Reducing multi-cloud latency isn’t just about speed - it’s about improving user experience, reliability, and cost efficiency. The guide dives deeper into tools and strategies for optimising performance across cloud environments.
Understanding Latency in Multi-Cloud Deployments
Types of Latency in Multi-Cloud
Latency in multi-cloud environments arises from delays across four main layers: network transit, compute processing, storage I/O, and application logic [1].
- Network latency is the most noticeable. It includes:
- Propagation delay: The time it takes signals to travel physical distances.
- Transmission delay: A factor of bandwidth limitations.
- Queuing delay: Caused by network congestion.
- Compute latency refers to the time taken for code execution, with extra delays often introduced by virtualisation.
- Storage I/O latency can range from sub-millisecond speeds (e.g., local NVMe storage) to tens of milliseconds (e.g., remote object storage) [1].
- Application latency stems from software architecture, such as the number of microservice hops, database query efficiency, and whether calls are synchronous or asynchronous.
In multi-cloud setups, these latency layers build upon one another. Cross-cloud traffic often takes longer routes compared to in-cloud traffic because cloud providers prioritise internal routing [2]. Even if call sequences look efficient on paper, they can result in unexpected delays in practice. Together, these factors highlight the challenges and trade-offs inherent in multi-cloud latency.
Key Constraints and Trade-Offs
One of the biggest constraints in addressing multi-cloud latency is unchangeable: the speed of light. For example, a round-trip across the Atlantic inherently takes around 70–90 milliseconds, regardless of bandwidth [1][3]. As Brian Bauman, Solutions Architect at Megaport, explains:
A larger pipe helps with throughput, but not travel time. The only reliable fixes for tackling latency are placing your multicloud resources strategically... and using private connectivity.[7]
For deployments in the UK and Europe, this means placing workloads in proximity matters. For instance, using AWS eu-west-2 and GCP europe-west2 within London ensures traffic stays within UK data centres, which not only reduces latency but also meets UK GDPR data residency requirements [9]. Similarly, co-locating workloads in closely situated regions, such as AWS and Azure's UK South facilities, can keep round-trip times under 5 milliseconds [6].
Cost also plays a major role in managing latency. Public internet egress charges average £0.07–£0.09 per GB, depending on the provider. By contrast, private interconnects like AWS Direct Connect can cut that to as low as £0.016 per GB, representing a saving of roughly 78% [9]. However, private connectivity adds complexity, such as configuring BGP, managing physical cross-connects, and ensuring encryption for regulated workloads.
Latency Metrics and SLOs
When defining Service Level Objectives (SLOs), it’s better to focus on tail latency - specifically p95 and p99 - rather than average latency. Average latency can mask the slowest user experiences, while p95 and p99 reflect the worst-case scenarios for the slowest 5% and 1% of requests, respectively. In distributed systems, a single request involving multiple microservices will only be as fast as its slowest component [1].
Another key factor is jitter, which refers to variability in latency over time. Even if average latency seems acceptable, unpredictable delays can cause issues like buffering and quality drops in real-time applications such as VoIP or video conferencing.
Here are some common latency thresholds:
| Metric | Target Threshold | Context |
|---|---|---|
| Time to First Byte (TTFB) | < 200 ms | Competitive threshold for Google Core Web Vitals [1] |
| API response time (p99) | < 500 ms | Typical SLA for transactional APIs [1] |
| Real-time apps (RTT) | < 150 ms | Threshold where lag becomes noticeable to users [1] |
| Intra-region latency | 1–5 ms | Typical for regional cross-datacentre traffic [1] |
| Database query (p50) | < 20 ms | Goal for optimised OLTP workloads [3] |
It’s worth noting that database queries often account for 60–80% of total API response time in cloud applications [3]. As a result, optimising storage and query performance tends to have a greater impact on reducing overall latency than focusing solely on network improvements. Accurate measurement of these metrics is essential when refining multi-cloud architectures, as explored in later sections.
Hybrid Multicloud Architecture: Reducing Latency and VPN Reliance
Monitoring and Observability for Latency Management
Understanding where latency comes from is just the beginning. To manage it effectively, you need clear, real-time visibility across all your cloud environments. As Opsolute aptly states: Visibility isn't optional when most of their workloads run in cloud environments.
[10]
Required Metrics and Telemetry
Start with the basics: collect the core network metrics - Round-Trip Time (RTT), jitter, packet loss, and bandwidth utilisation. Pair these with application-level telemetry like request latency, error rates, and throughput. Together, these metrics help identify where delays occur and how they affect users.
For setups involving microservices across multiple providers (e.g., an AWS Lambda function calling an Azure service), distributed tracing becomes a must. Each request creates a chain of spans that map the request's entire journey. By standardising on W3C Trace Context with traceparent and tracestate headers, you ensure seamless trace continuity across provider boundaries, avoiding gaps in your visibility [11][12].
A helpful way to organise your monitoring efforts is the Golden Signals framework: Latency (e.g., p99), Traffic (request count), Errors (5xx rates), and Saturation (CPU/memory usage). By consistently tracking these signals across platforms like AWS, Azure, and GCP, you establish a dependable baseline for identifying issues quickly [13].
This comprehensive metric collection sets the stage for effective cross-cloud monitoring.
Cross-Cloud Observability Architectures
Dealing with telemetry from multiple clouds? A centralised collector can simplify things. Cláudio Filipe Lima Rapôso, Systems Architect at NTT DATA, explains:
Implementing a unified multicloud observability pipeline using OpenTelemetry resolves this telemetry fragmentation.[11]
One approach is deploying a standalone OpenTelemetry (OTel) Collector - perhaps on AWS Fargate - as a gateway to gather telemetry from all environments. This setup can then send data to multiple backends, such as AWS X-Ray and Azure Monitor, simultaneously. The advantage? Your application code stays independent of any specific vendor's SDK, making it easier to switch observability platforms without modifying your services [11].
For metrics, tools like Thanos extend Prometheus to provide a global query view across multiple Prometheus instances, even in different cloud regions. This creates a unified interface for cross-cloud metrics - a necessity for organisations managing workloads across an average of 2.4 public cloud providers. Manual correlation is no longer feasible [15][16].
To control costs, consider tail-based sampling. Configure your OTel Collector to temporarily store traces and only save those that exceed a latency threshold (e.g., over 2,000 ms) or contain errors. For successful transactions, keep just a 1% probabilistic sample [11].
Tools and Automation for Observability
OpenTelemetry has emerged as the go-to standard for vendor-neutral instrumentation. Its flexibility allows you to instrument once and export data to any backend [13]. However, if you're using AWS X-Ray as your backend, make sure to configure the SDK with the AwsXRayIdGenerator to ensure compatibility with X-Ray's 128-bit trace ID format [11].
For network-level insights without altering applications, Hubble (built on eBPF) offers detailed L7 protocol latency data for HTTP, Kafka, gRPC, and more. It even provides p95 and p99 latency metrics for HTTP requests across clusters, directly from the kernel [14].
To ensure consistent monitoring across all environments, use Infrastructure-as-Code tools like Terraform. These can provision OTel Collector configurations, SSM parameters, and cloud-native exporters, ensuring every environment is instrumented from the start [11][13].
Cost management is essential too, as observability can make up 15–25% of cloud expenses. Pairing this with AI-driven alert correlation can reduce noise dramatically. Platforms using topology-aware models consolidate fragmented latency alerts into a single incident, cutting down on alert fatigue. According to PagerDuty, the average on-call engineer receives around 50 alerts weekly, but only 2–5% require action [16]. Automating this process ensures latency issues are swiftly identified and addressed, no matter how complex your cloud environment.
Designing Low-Latency Multi-Cloud Architectures
::: @figure 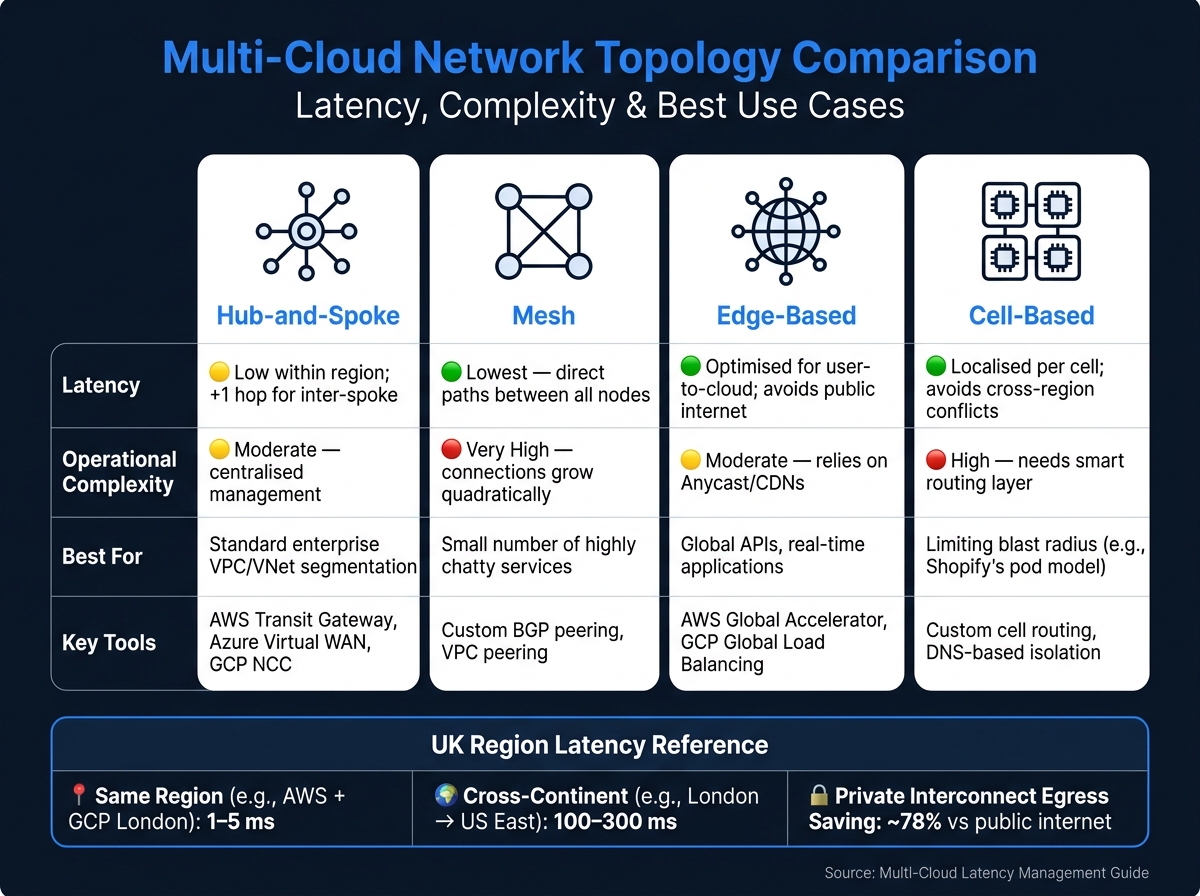 {Multi-Cloud Network Topology Comparison: Latency, Complexity & Best Use Cases}
:::
{Multi-Cloud Network Topology Comparison: Latency, Complexity & Best Use Cases}
:::
Choosing Providers and Regions
When it comes to reducing latency, physical distance is a game-changer. For users in the UK and Europe, the choice of cloud regions can make or break performance. Key options include AWS London (eu-west-2), GCP London (europe-west2), AWS Frankfurt (eu-central-1), and AWS Dublin (eu-west-1). Why does this matter? Because cross-continent requests can add a hefty 100–300 ms of latency, while same-region API calls typically stay in the 1–5 ms range [3]. That’s a huge difference, making region selection one of the most impactful decisions you’ll make.
For UK-specific deployments, especially those with data residency requirements, the London region pair is a smart pick. It ensures data stays within UK borders, aligning with GDPR regulations while also delivering strong performance [9]. If your workload leans heavily on analytics, GCP’s Premium Tier networking could be a big win. It routes traffic through Google’s private fibre backbone, starting at the nearest edge point, which can offer noticeable latency improvements [9].
Multi-cloud is the operational reality for most enterprises... treating it as a configuration task rather than an architectural discipline is a mistake.- CloudAndClear.uk [9]
The next step? Focusing on connectivity configurations to further optimise latency.
Connectivity and Network Optimisation
Where your clouds are located is only part of the equation - how they communicate is just as critical. One common pitfall is assuming that inter-cloud traffic automatically uses private networks. As Inderdeep Singh of The Network DNA points out:
The most common and most dangerous assumption engineers make is that traffic between cloud providers travels over a private network. By default, it does not.- Inderdeep Singh, The Network DNA [18]
For smaller-scale needs, like dev/test environments or data transfers under 1 TB per month, standard internet-based VPNs can work. However, they come with variable latency (20–100 ms) and can rack up high egress costs. For example, transferring 100 TB of data annually between clouds could cost between £80,000 and £115,000 over the public internet [9]. That’s where private interconnects like AWS Direct Connect come in, slashing egress rates to around £0.016 per GB - about 78% less than standard internet charges [9].
A noteworthy development is AWS Interconnect multicloud, which became generally available in April 2026. This service provides direct, managed, and MACsec-encrypted links between AWS and GCP without requiring customer-managed infrastructure. Azure integration is expected later in the year. However, keep in mind that traditional private interconnects like Direct Connect and ExpressRoute aren’t encrypted at Layer 2/3. For regulated workloads, you’ll need to add MACsec encryption or use an IPsec overlay [9].
For global APIs and real-time applications, Anycast routing tools like AWS Global Accelerator or GCP Global Load Balancing can make a huge difference. They ensure users are directed to the nearest healthy edge location, reducing failover times to seconds and bypassing the delays caused by DNS TTL [17].
Network Topology Designs
Once you’ve nailed down connectivity, refining your network topology can further enhance latency performance. Different topologies offer varying trade-offs in terms of performance, complexity, and cost.
| Topology | Latency Implications | Operational Complexity | Best For |
|---|---|---|---|
| Hub-and-Spoke | Low within region; adds one hop for inter-spoke traffic | Moderate; centralised management | Standard enterprise VPC/VNet segmentation |
| Mesh | Lowest latency (direct paths between all nodes) | Very high; connections grow quadratically | Small number of highly chatty services |
| Edge-Based | Optimised for user-to-cloud; avoids public internet | Moderate; relies on Anycast/CDNs | Global APIs, real-time apps |
| Cell-Based | Localised to each cell; avoids cross-region conflicts | High; needs a smart routing layer | Limiting blast radius (e.g., Shopify's pod model) |
The hub-and-spoke model is a common starting point for many enterprises. Tools like AWS Transit Gateway, Azure Virtual WAN, and GCP Network Connectivity Centre simplify this setup. Each offers unique benefits: AWS TGW provides detailed route table control, Azure vWAN offers a fully managed global transit backbone, and GCP NCC acts as a connectivity broker using Google’s private backbone [9][4].
Before connecting your clouds, establish a centralised IP address management (IPAM) registry. Allocate non-overlapping CIDR blocks across all environments upfront. Overlapping ranges can cause major headaches down the line, and fixing them post-deployment is a disruption you’ll want to avoid [9].
Techniques for Reducing Multi-Cloud Latency
Traffic Routing and Management
Once your network topology is set, the next step is managing how traffic flows through it. This is where routing decisions come into play, offering significant opportunities to cut down latency.
DNS is the first routing decision in any distributed system. It runs before any TCP connection is established, before any load balancer sees a packet.- LetsBuildSolutions [22]
DNS-based routing offers three key strategies:
- Latency-based routing: Directs users to the region with the fastest round-trip time.
- Geolocation routing: Maps traffic based on the origin IP to meet data residency rules.
- Weighted round-robin: Ideal for testing new deployments (like canary releases).
These strategies can be layered for better precision [17][22].
A lesser-discussed but impactful tool is EDNS Client Subnet (ECS). Without ECS, nameservers only see the resolver's IP, which can skew latency and geolocation decisions. Enabling ECS is a simple tweak that improves routing accuracy in multi-cloud setups [20][22].
When it comes to DNS TTL management, the TTL value you choose has practical implications. A short TTL (30–60 seconds) allows for quick failovers and migrations, while a longer one (300 seconds) is better for stable traffic. For planned changes, reduce TTL 10–15 minutes in advance, and for unexpected events, rely on health-check-based record suppression [22].
If you're using tools like AWS Global Accelerator, terminating TCP handshakes at the edge rather than the origin can cut p99 latency by 20–30% and reduce connection penalties by about 180 ms [19]. These are substantial gains for real-time applications, achieved without major architectural changes.
Emerging predictive AI routing takes things further by using Real User Monitoring (RUM) and synthetic probes to anticipate latency spikes. To avoid ping-pong
routing oscillations, set hysteresis thresholds: switch only if latency improves by more than 8%, with a 60-second cooldown and a traffic shift ceiling of 10% per minute [21].
Once routing is optimised, the next step is reducing the distance data has to travel - and that’s where caching comes in.
Caching and Data Locality
While routing optimises the path data takes, caching reduces how often the path needs to be used. By placing data closer to users, you can significantly cut read latency - studies show this can reduce response times by over 20% [23].
The best results come from combining two layers of caching:
- Edge caching via CDNs for static assets like images and scripts. This can cut latency for these resources by 30–70% [3].
- Regional caching for dynamic data, such as session states, using tools like ElastiCache Global Datastore. This ensures users aren't constantly querying a distant origin.
For databases, the trade-off between synchronous and asynchronous replication directly impacts latency. For example:
- GCP Cloud Spanner offers synchronous replication with zero data loss (RPO) but adds 10–20 ms of write latency in dual-region setups.
- AWS Aurora Global Database uses asynchronous replication, providing lower write latency but with the risk of slightly outdated reads [4][25].
If latency is a top concern, geo-sharding - splitting users and data by region - can eliminate cross-region replication entirely. Combined with an active-active deployment model (where multiple regions serve live traffic), this approach delivers near-zero recovery time (RTO) and minimal data loss (RPO). Capital One demonstrated this approach at scale, migrating 2,000 applications to a multi-region active-active setup with AWS Lambda and DynamoDB, cutting provisioning times from months to minutes [4][24].
While caching handles immediate data retrieval, the work doesn’t stop there. Continuous tuning ensures those gains hold up as workloads shift.
Continuous Optimisation and Automation
Latency management isn’t a one-and-done task - it requires constant monitoring and adjustments. A reliable framework for this is the Measure, Decide, Act, Validate
loop:
- Measure latency data across your system.
- Compare it to your service level objectives (SLOs).
- Make adjustments (e.g., routing or caching changes).
- Validate the results before moving forward [8].
This process can be streamlined by integrating automated load tests and latency checks into CI/CD pipelines. For instance, poorly optimised database queries often account for 60–80% of total API latency. Proper indexing alone can cut query times by up to 90% - an issue that can be caught pre-deployment with latency gates [3].
Other practical steps include:
- Using VPC endpoints for services like S3 or DynamoDB to bypass NAT gateways, reducing latency by 10–20 ms per call in multi-cloud setups [3].
- Enabling HTTP/2 for inter-cloud communication, which can speed up resource loading by up to four times compared to HTTP/1.1 through multiplexing [3].
For complex multi-cloud environments, expert support can make all the difference. Hokstad Consulting specialises in embedding performance optimisation into existing DevOps workflows, ensuring the Measure, Decide, Act, Validate
loop functions seamlessly.
Latency is not just a metric - it's a competitive differentiator.- CloudRoute [26]
Governance and DevOps Practices for Latency Control
Managing latency effectively requires more than just technical tweaks - it demands a solid framework of governance and well-integrated DevOps practices. Without these, improvements made through techniques like routing optimisation or caching can quickly unravel as new code is deployed, services are added, or workloads shift. The key is to make latency control a proactive, built-in process rather than a reactive fix.
Performance Testing in CI/CD Pipelines
To ensure latency improvements are sustainable, robust governance and DevOps practices must be in place. One of the best ways to prevent latency issues is by catching them early in the development process. This can be achieved by embedding load tests and latency checks directly into the CI/CD pipeline, rather than treating them as occasional, manual tasks [5].
A practical approach involves setting latency gates - automated checks that halt a build if p95 or p99 response times exceed pre-defined thresholds. Unlike average response times, which can mask issues, tail latency metrics (like p95 and p99) highlight the slowest requests that users encounter. These metrics are crucial for identifying potential bottlenecks [5]. Treating latency regression testing with the same importance as functional regression testing ensures it becomes a mandatory, automated, and blocking step in the pipeline. This creates a foundation for policy-driven automation to enforce latency standards consistently.
Policy-Driven Automation
Once acceptable latency levels are defined, enforcing them requires automation. Infrastructure as Code (IaC) and policy-as-code tools make it possible to codify standards for latency, covering aspects like region placement, health-check configurations, and routing policies. These tools ensure that latency rules are applied consistently across all deployments [8].
A centralised policy engine can streamline decisions related to Anycast, BGP, and DNS routing, balancing cost, risk, and latency targets simultaneously [8]. This coordination reduces the likelihood of isolated routing decisions that might inadvertently increase latency. Additionally, failover processes should be managed through version-controlled code using tools like AWS Application Recovery Controller or Azure Site Recovery. This approach ensures recovery procedures are both repeatable and auditable [4].
The cost of downtime is no small matter - unplanned cloud outages cost UK businesses an average of £4,700 per minute [4]. Policy-driven automation is a critical step in reducing the frequency and impact of such events.
Working with Expert Consultants
Managing latency in multi-cloud environments involves numerous components, from DNS settings and network topology to database replication and governance frameworks. Often, the challenge isn’t a lack of knowledge but rather the time and expertise required to apply it consistently.
Collaborating with specialists can make a significant difference. Hokstad Consulting works with organisations to design and implement latency-optimised multi-cloud architectures. Their approach integrates performance controls into existing DevOps workflows, covering areas like cloud cost management, CI/CD automation, and continuous performance tuning. This partnership not only speeds up the deployment of optimised architectures but also helps reduce technical debt. Together, these governance strategies play a vital role in maintaining latency improvements, even as systems and requirements evolve over time.
Conclusion and Key Takeaways
Managing latency in multi-cloud setups is an ongoing process that demands regular fine-tuning. As workloads evolve and cloud platforms update, it's crucial to continuously revisit strategies for routing, caching, and observability.
The main takeaway? Optimisation needs to span all four layers - network transit, compute processing, storage I/O, and application logic. Focusing on just one won't cut it because latency isn't just a technical concern; it directly impacts business outcomes [1].
To address latency effectively, organisations can implement a range of practical measures. For instance, using BGP Anycast allows for smarter traffic routing, while switching to gRPC enhances inter-service communication [1]. On top of that, integrating latency gates into CI/CD pipelines ensures performance issues are caught early. Tracking tail latency metrics like p95 and p99 (instead of relying on averages) is another proactive approach to shift from merely reacting to problems to engineering better performance [5].
FAQs
How do I pick the best cloud regions for UK users?
When selecting cloud regions for users in the UK, it's essential to break down your workloads based on factors like performance requirements, data gravity, compliance needs, and cost flexibility. Here's how to approach it:
- Performance: Opt for regions located near the UK to minimise latency and enhance user experience.
- Compliance: If your workloads are governed by UK GDPR or have strict data residency rules, ensure your data remains within an approved jurisdiction, such as a UK-based region or a sovereign cloud.
- Provider Strengths: Evaluate what each cloud provider offers. Some excel in low-latency connections, others in hybrid cloud setups or extensive global reach. Match these strengths to your specific business needs.
By aligning these considerations with your priorities, you can make informed decisions that balance compliance, performance, and cost.
When should I use private interconnects instead of VPNs?
When your workloads demand consistent and predictable performance that public internet connections can't guarantee, private interconnects are the way to go. They're especially important if you need bandwidth exceeding 5 Gbps, jitter below 5 ms, or handle data volumes over 50 TB per month. For regulated workloads, private interconnects are essential to ensure that traffic avoids public nodes entirely.
Hokstad Consulting recommends starting with VPNs to monitor and evaluate your usage before investing in the higher costs of private circuits.
What latency metrics should my SLOs track (p95/p99)?
Your Service Level Objectives (SLOs) should focus on tail latency metrics such as p95 and p99, which capture the slowest 1% to 5% of user experiences. These metrics go beyond average latency, highlighting hidden bottlenecks in distributed systems. In such environments, delays in a single microservice can ripple through and affect the entire system's performance. By keeping an eye on these percentiles, you can maintain greater reliability and consistent performance across your multi-cloud infrastructure.