
Managing multiple Kubernetes clusters is challenging. Observability is the key to understanding and fixing issues across clusters effectively. Unlike basic monitoring, observability digs deeper into logs, metrics, and traces to explain why and how problems occur. This becomes critical when handling complex, multi-cluster CI/CD pipelines.
Key takeaways:
- Challenges: Data silos, fragmented monitoring, scalability issues, and broken dependencies across clusters.
- Solutions: Use tools like Prometheus, Grafana, and Jaeger for metrics, visualisation, and tracing. Employ strategies like centralising data, automating processes, and setting dynamic baselines.
- Benefits: Faster incident resolution, reduced costs, and improved system reliability.
If you’re deploying applications across multiple clusters, having a robust observability framework is non-negotiable. This guide explains the tools, challenges, and best practices to help you build an effective multi-cluster observability setup.
Ask an OpenShift Expert | Ep 163 | MultiCluster Observability
Need help optimizing your cloud costs?
Get expert advice on how to reduce your cloud expenses without sacrificing performance.
Challenges in Multi-Cluster CI/CD Observability
Managing deployments across multiple clusters comes with its own set of hurdles, particularly when it comes to observability. Each cluster produces its own logs, metrics, and traces, but these data streams often don't align or integrate seamlessly. Below, we explore the main challenges, from data silos to tracking dependencies across clusters.
Data Silos and Fragmented Monitoring
One major issue is the lack of standardisation in monitoring setups across clusters. Without consistent configurations, it's tough to establish performance benchmarks or compare metrics across your systems [1]. For instance, one cluster might use service_name while another uses app_id, creating inconsistent metric labelling. This inconsistency makes it nearly impossible to detect patterns or anomalies that span multiple clusters.
Another problem is data gravity - the idea that telemetry data becomes less useful the longer it takes to reach your central observability platform [4]. Transferring logs and metrics between regions or cloud providers introduces delays, which can render this data ineffective for real-time alerts.
Scalability and Performance Issues
As the number of clusters increases, so does the volume of telemetry data, often at an exponential rate. High-cardinality labels, like user IDs or session tokens, can quickly inflate storage costs and bog down query performance [3]. Without proper cardinality management, your observability system could end up consuming more resources than the applications it's monitoring.
Then there's the complexity of tail sampling. In single-cluster setups, sampling decisions are straightforward. However, in multi-cluster environments, ensuring that all trace spans are processed together becomes a technical headache [5]. If even one span is missed, you lose the ability to see the full transaction, leaving critical blind spots.
Tracking Dependencies Across Clusters
Modern applications often involve multiple clusters working together. For example, a user request might interact with a payment service in one cluster, an inventory database in another, and a notification service in a third. When something goes wrong, tracing this entire path is essential - but context propagation often breaks down at cluster boundaries [3]. Asynchronous systems like message queues or serverless functions can drop trace IDs, leaving you with fragmented data instead of a complete picture.
| Challenge | Primary Impact | Mitigation Approach |
|---|---|---|
| Configuration Drift | Inconsistent cluster behaviour | Automate using Infrastructure as Code |
| Cross-Cluster Communication | Service connectivity issues | Implement service mesh solutions |
| Monitoring Fragmentation | Delayed incident response | Use unified observability platforms |
| Network Latency | Devalued telemetry data | Emit data between environments only when business value is gained |
These challenges highlight the need for a well-thought-out observability strategy to ensure seamless monitoring across multiple clusters. Addressing these issues directly can make all the difference in maintaining system reliability and performance.
Tools for Multi-Cluster CI/CD Observability
::: @figure 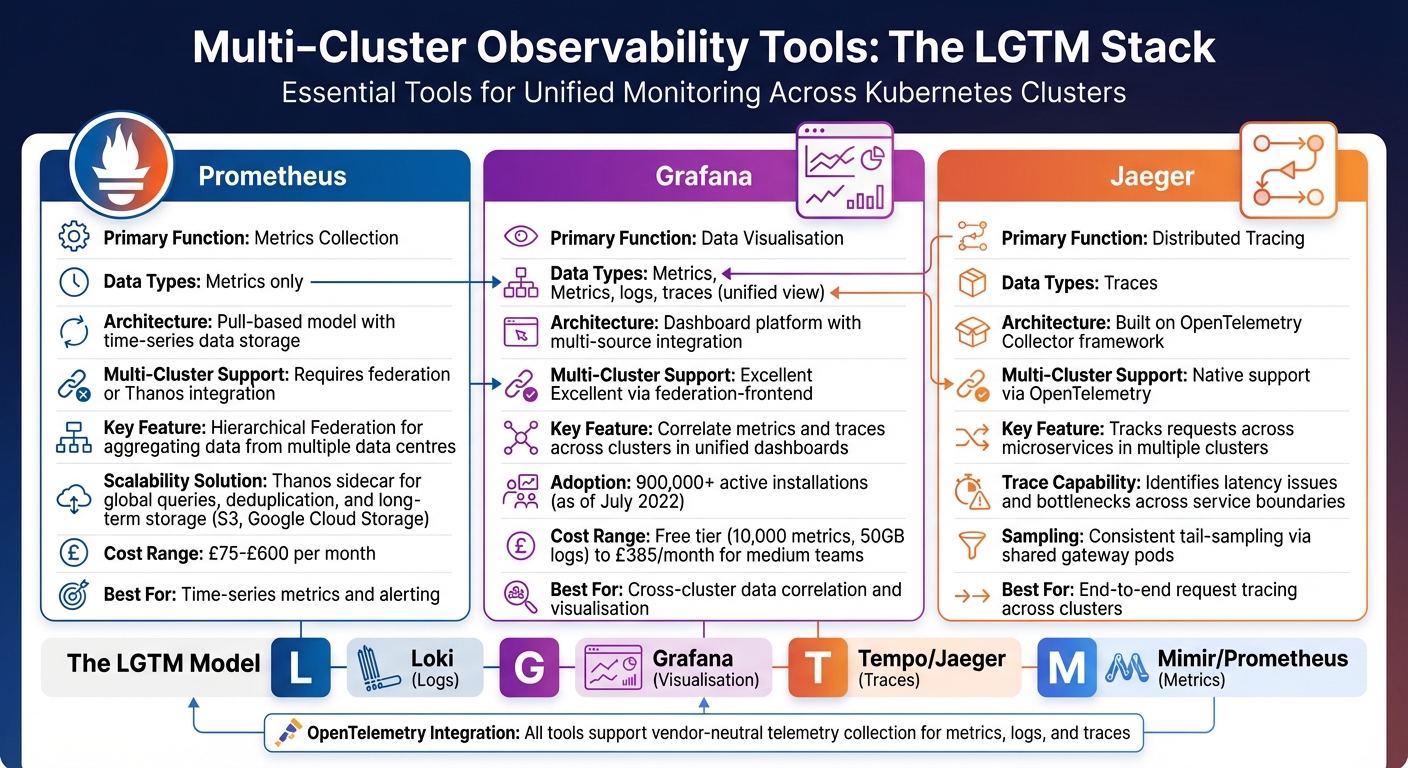 {Multi-Cluster Observability Tools Comparison: Prometheus, Grafana, and Jaeger}
:::
{Multi-Cluster Observability Tools Comparison: Prometheus, Grafana, and Jaeger}
:::
When dealing with data silos and performance bottlenecks, selecting the right tools becomes essential. The most effective setups for multi-cluster observability rely on a trio of tools: Prometheus for metrics, Grafana for visualisation, and Jaeger for distributed tracing. Together, they form the LGTM
model - short for Loki (logs), Grafana (visualisation), Tempo/Jaeger (traces), and Mimir/Prometheus (metrics) - which enables unified monitoring across your systems [13].
Unlike traditional tools that only signal when an issue occurs, these solutions help uncover the root causes [14]. For instance, Grafana, with over 900,000 active installations as of July 2022, highlights their widespread adoption. The rise of open standards like OpenTelemetry has further simplified integrating these tools, helping teams transition away from proprietary systems. Let's explore how each tool contributes to a cohesive observability framework.
Prometheus for Metrics Collection
Prometheus is the backbone of metrics collection, employing a pull-based model to fetch time-series data from applications and exporters [7]. It operates by scraping metrics at regular intervals and storing them locally for querying and alerting. However, a standard Prometheus setup is limited to single-cluster environments, lacking native support for global querying or extended data storage [12].
To tackle multi-cluster challenges, Hierarchical Federation can be introduced. This approach allows higher-level Prometheus instances to aggregate data from local servers, enabling the monitoring of numerous data centres without overloading any single instance [8]. For further scalability, tools like Thanos can be added as a sidecar to each Prometheus instance. Thanos supports global queries, data deduplication, and long-term storage in solutions like S3 or Google Cloud Storage [16][12]. Depending on the scale, infrastructure costs for this setup range from £75 to £600 per month [15].
Grafana for Dashboards and Visualisation
Grafana works seamlessly with Prometheus, Jaeger, and logging tools to create unified dashboards, allowing you to correlate metrics and traces across clusters. Its federation feature is a standout, enabling data queries from multiple regional clusters in one view [10]. By standardising labels such as app, role, and environment, Grafana simplifies multi-cluster observability.
For smaller teams, Grafana Cloud offers a free tier that includes 10,000 metrics and 50GB of logs. Medium-sized teams, however, may spend around £385 monthly for more comprehensive usage [13][15]. This scalability ensures that Grafana suits organisations of all sizes, from startups to large enterprises.
Jaeger for Distributed Tracing
Jaeger excels in distributed tracing, tracking requests across microservices spread across clusters [9][11]. It identifies latency issues and bottlenecks by pinpointing where a request slows down or fails. Built on the OpenTelemetry Collector framework, the latest Jaeger release is optimised for modern cloud-native environments [11].
Observability requires high-quality, portable, and accurate telemetry data. OpenTelemetry's mission is to make this telemetry a built-in feature of cloud native software.- Austin Parker, Head of Developer Relations, Lightstep
In multi-cluster setups, Jaeger can be configured to route spans of a single trace to a shared gateway pod, ensuring consistent tail-sampling decisions [5]. This setup allows you to trace a user request from a payment service in one cluster, through an inventory database in another, and finally to a notification service in a third - all within a single view.
Tool Overview for Multi-Cluster Support
| Tool | Primary Function | Data Types | Multi-Cluster Support |
|---|---|---|---|
| Prometheus | Metrics collection | Metrics only | Requires federation or Thanos [8][12] |
| Jaeger | Distributed tracing | Traces | Native support via OpenTelemetry [9][11] |
| Grafana | Data visualisation | Metrics, logs, traces | Excellent via federation-frontend [10] |
| OpenTelemetry | Telemetry collection | Metrics, logs, traces | Native support; vendor-neutral |
Implementation Best Practices
Building on earlier discussions about tools, effective implementation relies on three pillars: centralisation, automation, and dynamic baselines. These elements are crucial for achieving observability across multiple clusters without introducing new bottlenecks.
Centralising Observability Data
Centralising observability data means turning scattered telemetry into actionable insights. A practical way to do this is by deploying DaemonSet agents to collect telemetry data and forward it to a central gateway. This setup ensures local resilience while enabling unified policy enforcement.
The gateway plays a key role: it aggregates data, performs tail sampling, and rate-limits traffic before sending it to your backend. This keeps storage costs manageable [5]. To enable cross-cluster correlation, every piece of telemetry should include a unique cluster identifier, such as k8s.cluster.name [5]. For metrics, a hierarchical federation works best. Deploy local Prometheus instances in each cluster and federate their data to a mesh-wide production instance [2].
Also, be mindful of cardinality right from the start. Avoid using unbounded identifiers like user IDs in metrics to prevent label explosion [3].
Once centralisation is in place, automation becomes the next logical step to handle scale efficiently.
Automating Monitoring and Alerts
Manual monitoring quickly becomes unmanageable as the number of clusters grows. Automation is critical - not just for setting up alerts but also for monitoring the health of the observability pipeline itself. For example, tracking internal metrics like otelcol_exporter_queue_size and otelcol_processor_dropped_spans can help you detect and prevent silent data loss [5].
In multi-cluster setups, consistent tail sampling is essential. To achieve this, all spans for a single trace must route to the same gateway pod [5]. A load balancer with Trace ID affinity or the OpenTelemetry loadbalancing exporter can help ensure this consistency.
Your alerting strategy will also depend on whether you opt for an agent-only or gateway-based pattern. While agent-only setups offer lower latency, they can complicate centralised policy enforcement. On the other hand, a gateway pattern allows for complex tail sampling but may introduce a single point of failure. A hybrid approach - combining agents with gateways - offers the best of both worlds, providing local buffering during outages while maintaining centralised control [5].
Automation is only part of the solution. To make sense of the data, you also need adaptive baselines that reflect the unique characteristics of each cluster.
Setting Baselines and Analysing Trends
Static thresholds often create unnecessary noise. What's considered normal
in a production cluster in London might differ significantly from a staging environment in Manchester [6]. Dynamic baselines, which adjust to each cluster's specific patterns, can help reduce false positives caused by routine workload variations.
Designing an alerting system that is both sensitive to anomalies and specific enough to avoid false positives is challenging... This requires sophisticated algorithms and, often, machine learning models that can adjust to the changing norms of each cluster.
This insight from Andreas Prins, CEO of StackState [6], underscores the importance of adaptive algorithms that evolve alongside your clusters.
Defining clear Service Level Objectives (SLOs) is another critical step. As AWS Observability Best Practices explains, You don't need to fix every tiny issue if it doesn't affect your main goals
[4]. Focus on the metrics that matter most: Deployment Frequency, Lead Time for Changes, Change Failure Rate, and Mean Time to Recovery (MTTR) [17].
Finally, use duration filters in your alert rules to ignore transient spikes. A CPU spike lasting three seconds might not matter, but one lasting three minutes likely signals a real problem. Applying alerting at the node, pod, and namespace levels can help you catch localised issues before they escalate across your entire multi-cluster environment.
Hokstad Consulting Services for Multi-Cluster Observability
Hokstad Consulting offers tailored solutions designed to turn scattered monitoring systems into a unified multi-cluster observability framework. Their expertise lies in streamlining DevOps workflows and creating observability strategies that align operational efficiency with business objectives. By focusing on centralisation, automation, and dynamic baselines, they ensure a smooth shift from planning to implementation.
Custom Observability Solutions
Hokstad Consulting builds monitoring architectures that are both scalable and secure, customised to fit the unique needs of each organisation's multi-cluster environment. Their approach ensures seamless data correlation across clusters by enhancing access controls and securing inter-cluster communication. With their automation solutions, teams can reduce overhead and tackle issues proactively, preventing problems from escalating across clusters.
Cloud Cost Optimisation Through Observability
Improved observability isn't just about performance - it can also lead to significant cost savings. Hokstad Consulting uses observability metrics to help organisations cut Kubernetes resource costs by as much as 80%. By linking these metrics to SLAs and SLOs, they drive both efficiency and consistent performance. Their No Savings, No Fee
model means their fees are tied to the savings they achieve, ensuring their goals are aligned with yours.
Continuous Support and Performance Tuning
Maintaining effective multi-cluster observability requires constant fine-tuning. Hokstad Consulting offers ongoing support through retainer-based services, which include monitoring, performance optimisation, and incident response. Their efforts help align technical metrics with business goals, improving customer satisfaction and reducing MTTR by over 25%. Regular audits ensure robust RBAC configurations, TLS encryption, and compliance, lowering the risk of data breaches. A quick 30-minute consultation can uncover potential cost savings and performance improvements tailored to your needs.
Conclusion
Managing multi-cluster CI/CD pipelines without proper observability leads to fragmented visibility, sluggish performance, and operational headaches. To tackle these challenges, a unified framework built on Prometheus, Grafana, and Jaeger becomes essential. This approach not only addresses technical shortcomings but also boosts operational efficiency in a meaningful way.
Consider this: elite DevOps teams deploy 973 times more frequently and resolve incidents 6,570 times faster [18]. The difference lies in prioritising observability as a fundamental practice. As Craig Risi puts it:
Observability in a CI pipeline is essential for maintaining the reliability and efficiency of the pipeline and allows developers to quickly identify and resolve any issues that may arise [19].
Achieving this level of performance requires centralising observability data, automating monitoring with consistent agent deployment, and setting clear baselines tied to your SLAs and SLOs. These steps not only lower costs but also enhance deployment confidence and reduce mean time to resolution.
Hokstad Consulting takes this further by offering tailored solutions that incorporate these best practices into your ecosystem. Their custom observability frameworks tackle technical hurdles while aligning with broader business goals. Clients have reported up to 80% reductions in Kubernetes resource costs without sacrificing performance. Plus, their No Savings, No Fee
model and ongoing retainer services ensure that your observability strategy delivers actionable results - not just pretty dashboards.
A quick 30-minute consultation with Hokstad Consulting could uncover specific ways to enhance your multi-cluster observability, streamline operations, and align technical metrics with your business objectives.
FAQs
How do I standardise labels across clusters?
To keep labels consistent across Kubernetes clusters, stick to shared, clearly defined labels with uniform naming conventions. For instance, use prefixes like app.kubernetes.io to maintain clarity and prevent conflicts. Establish a standard set of labels to represent applications, environments, or instances, and ensure they're applied systematically when creating resources. This approach not only simplifies management but also enhances observability, allowing tools like Grafana or Prometheus to efficiently gather and analyse data across multiple clusters.
When should I use a central gateway vs agent-only telemetry?
In multi-cluster observability, a central gateway is ideal when you require centralised control, scalability, and easier management. It collects telemetry data from multiple clusters, providing a single, unified view. This setup also enhances security, making it well-suited for large-scale environments.
On the other hand, agent-only telemetry prioritises resilience and independence. Here, each cluster functions autonomously, which helps minimise single points of failure. This method works best for distributed systems or scenarios where network limitations make centralised data collection less feasible.
How can I reduce metric cardinality without losing insight?
To keep metric cardinality in check without losing valuable insights, you can start by eliminating high-cardinality attributes such as user IDs or full URLs, as these tend to generate an overwhelming number of unique values. Another effective approach is to normalise dynamic data, which reduces unnecessary variations in labels.
You can also implement system-level safeguards by setting limits on cardinality. This might involve restricting the number of label combinations or applying aggregation and filtering during data collection. These methods strike a balance between maintaining observability and managing both system resources and costs efficiently.