
Debugging multi-cluster CI/CD pipelines is challenging due to distributed systems' complexity and hidden root causes. Common issues include resource constraints, infrastructure problems, and configuration mismatches, often leading to delays, pod failures, or communication errors across clusters. Effective debugging requires unified monitoring, centralised logging, and distributed tracing to identify and resolve bottlenecks. Here's a quick breakdown:
- Key Causes of Bottlenecks: Resource shortages, mismatched configurations, and infrastructure failures.
- Symptoms to Watch For: Slow deployments, pods stuck in Pending, or nodes marked NotReady.
- Tools to Use: Prometheus, Grafana, Loki, and OpenTelemetry for metrics, logs, and traces.
- Practical Fixes: Set clear resource limits, validate configurations, and automate health checks.
- Preventive Measures: Regular audits, automated diagnostics, and GitOps-based rollbacks.
Multi-branch Pipeline with Argo Workflows and CI/CD Debugging - Gosha Dozoretz, Rookout
Need help optimizing your cloud costs?
Get expert advice on how to reduce your cloud expenses without sacrificing performance.
What Causes Performance Bottlenecks in Multi-Cluster Pipelines
Performance bottlenecks in multi-cluster pipelines typically arise from three key factors: resource constraints, infrastructure issues, and configuration mismatches. Let's break these down.
Resource constraints often lead to job queues building up. This happens when executors are unavailable or when CPU and memory limits in Pod specifications are set too low, preventing workloads from running smoothly. For instance, if a JVM heap exceeds 16 GB, horizontal scaling becomes necessary to maintain performance [4][5].
Infrastructure problems can make things worse. Virtual machine shutdowns, network partitions, or the unavailability of persistent storage like AWS EBS or GCE PD can bring pipelines to a halt [3]. Additionally, Kubernetes errors such as CrashLoopBackOff, OOMKilled, and CreateContainerConfigError - often flagged by monitoring systems - are signs of resource strain impacting overall performance [1].
Configuration mismatches are another frequent culprit. Manual changes or inconsistent update schedules can cause clusters to drift apart, leading to gaps in monitoring and unexpected connectivity failures. For example, mismatched firewall rules or certificates can disrupt secure communication between clusters.
Common Challenges in Multi-Cluster Environments
These bottlenecks often translate into broader challenges specific to multi-cluster setups. One of the biggest hurdles is cross-cluster communication delays. Telemetry data often suffers from latency - sometimes called gravity
- which can reduce its value by the time it reaches alerting systems [7]. Similarly, locality load balancing can obscure failures at remote cluster endpoints if monitoring isn't thorough [6].
Resource contention is another major issue. High volumes of concurrent tasks can increase pod creation delays, deepen work queues, and leave many pods pending. Memory or disk pressure may even cause the Kubelet to stop reporting node status, marking nodes as NotReady and triggering pod evictions after a grace period [3]. Misconfigured resource requests can exacerbate this, leaving pods stuck in a Pending state. Additionally, CI tools like Jenkins, when configured with high durability settings to safeguard data integrity, may inadvertently slow down performance at scale [4].
These challenges underscore the need to recognise early warning signs of pipeline bottlenecks.
How to Recognise Pipeline Bottlenecks
Recognising bottlenecks in multi-cluster environments can be critical. Some common warning signs include:
- Jobs taking longer than expected to queue
- Pods stuck in a Pending state
- Nodes marked as NotReady
Errors like OOMKilled often indicate memory exhaustion, leading to pod evictions and pipeline restarts. Java-based workloads, in particular, are prone to memory-related issues that can cause stalls if unchecked [5]. Cross-cluster load balancing failures may show up as timeout errors or upstream connect error
messages, even when basic connectivity tests pass.
| Warning Sign | Multi-Cluster Manifestation |
|---|---|
| Slow Deployments | Traffic stuck in local-cluster instances despite multi-cluster configuration [6] |
Node NotReady |
Kubelet stops posting status due to network partitions or resource strain [3] |
Tools and Methods for Monitoring Multi-Cluster Pipelines
::: @figure 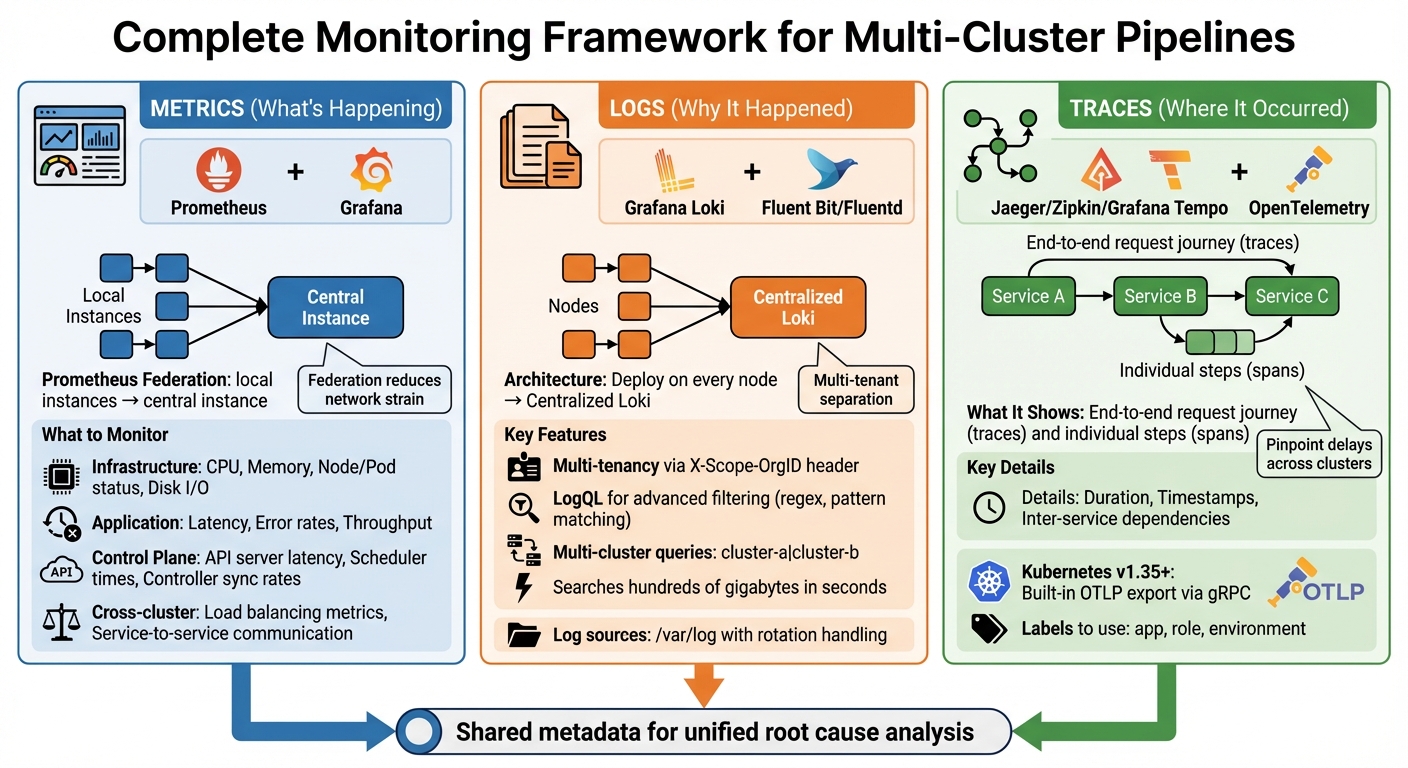 {Multi-Cluster Pipeline Debugging Framework: Monitoring Tools and Methods}
:::
{Multi-Cluster Pipeline Debugging Framework: Monitoring Tools and Methods}
:::
To get to the bottom of the issues discussed earlier, you need solid monitoring strategies. Here's how you can achieve that in multi-cluster environments.
In such setups, you need to combine metrics (what's happening), logs (why it happened), and traces (where it occurred). Together, these provide the full picture. Below are the key techniques to monitor and address pipeline performance challenges effectively.
Resource Usage and Control Plane Health
Start by tracking resource usage at the container, pod, and node levels. Monitoring CPU and memory consumption is crucial to catch resource limitations before they escalate into delays or failures [8]. Keep an eye on the control plane health, focusing on Kubernetes components like kube-apiserver, kube-scheduler, and kube-controller-manager. Any bottlenecks here can directly slow down deployments [10]. Additionally, metrics like error rates, request-response codes, and throughput can help you differentiate between infrastructure issues and application-level bugs [9].
Using Metrics and Dashboards
Metrics-based monitoring relies heavily on Prometheus and Grafana. Prometheus collects time-series data, while Grafana turns it into visual dashboards. For multi-cluster setups, use Prometheus federation by deploying local instances in each cluster and linking them to a central instance [11].
Your dashboards should cover both infrastructure metrics (e.g., CPU, memory, node/pod status, disk I/O) and application metrics (e.g., latency, error rates, throughput). This combination allows for quicker issue diagnosis [8][9][10]. Don't forget to include control plane metrics like API server latency, scheduler times, and controller sync rates to identify cluster management issues [10]. In multi-cluster setups, pay close attention to cross-cluster load balancing and service-to-service communication metrics, ensuring traffic isn't being blocked by misconfigurations or firewalls [2].
Centralised Logging for Debugging
Centralised logging simplifies debugging by collecting log data from all clusters into one location. Grafana Loki is particularly effective here, as it uses labels and supports multi-tenancy through the X-Scope-OrgID HTTP header. This makes it easier to separate data by cluster or tenant [12].
To aggregate logs, deploy Fluent Bit or Fluentd on every node. These tools can tail logs from /var/log and handle log rotation to avoid uncontrolled file growth [10]. Loki's query language, LogQL, allows for advanced filtering, including regex and pattern matching. Christophe Collot, a Site Reliability Engineer, shared:
Loki's query language, LogQL, is very powerful, and we use it to effortlessly detect blocked traffic to specific TCP ports or IP ranges, searching through hundreds of gigabytes in a matter of seconds [13].
For multi-cluster queries, enable multi_tenant_queries_enabled: true in Loki. This lets you query multiple clusters in one go by separating their IDs with a pipe (e.g., X-Scope-OrgID: cluster-a|cluster-b) [12]. To streamline root cause analysis, ensure your logs share metadata with metrics and traces [13].
Distributed Tracing for Finding Root Causes
Distributed tracing provides an end-to-end view of a request's journey (trace) and its individual steps (spans). It captures details like duration and timestamps, helping you pinpoint where delays occur across clusters [9]. Tools like Jaeger, Zipkin, and Grafana Tempo are great for visualising and storing traces. Meanwhile, OpenTelemetry offers a unified framework for collecting telemetry data.
With Kubernetes (v1.35+), you can export spans directly using the OpenTelemetry Protocol (OTLP) via built-in gRPC exporters or an OpenTelemetry Collector [10]. In service mesh setups like Istio, cross-cluster tracing requires manually configuring a shared root of trust (certificates) across clusters [2]. Use consistent labels - such as app, role, and environment - to organise traces and alerts across hybrid clusters efficiently [14].
Tracing reveals inter-service dependencies and unexpected interactions that metrics might miss. By analysing span durations and trace ID propagation, you can pinpoint whether delays are caused by network latency, slow database queries, or inefficient service calls [9].
How to Debug Common Failure Scenarios
Even with strong monitoring in place, tackling specific failure patterns requires targeted debugging. Two common issues to focus on are build failures and flaky tests. Let’s dive into practical approaches for addressing these challenges.
Build Failures and Resource Constraints
Build failures in multi-cluster pipelines often stem from mismatched environments, resource shortages, or misconfigurations. For example, differences in Kubernetes versions - like using v1.28 in local development but v1.26 in CI/CD agents - can cause builds to break. Similarly, missing SDKs after agent updates or relying on outdated container images tagged as :latest can lead to inconsistent results across clusters.
Resource issues, especially during high-demand periods, are another major culprit. Low memory or CPU limits can trigger OOMKilled events and pod evictions. A 2023 incident at a UK fintech company highlighted this problem: intermittent test failures during peak times were traced to memory constraints. By using Prometheus and Grafana to correlate logs with resource metrics, they identified pod evictions as the root cause. After optimising resource requests, they managed to cut test flakiness by 40% [17].
To avoid such problems:
- Pin exact Dockerfile versions (e.g.,
FROM node:18.17.1-alpine3.18) instead of using:latesttags. - Set explicit resource requests and limits, like
requests: { memory: "1Gi" }andlimits: { memory: "2Gi" }. - Use tools like
kubectl describe podto identify issues like MemoryPressure, DiskPressure, or PIDPressure. - Validate YAML configurations with tools such as yamllint, kubeval, or
kubectl --dry-run, as misconfigurations (e.g., wrong indentation or missing environment blocks) account for about 25% of pipeline failures in large-scale setups [2].
Flaky Tests and Dependency Conflicts
Once build issues are under control, focus on resolving flaky test behaviours, which can severely disrupt pipeline reliability.
Flaky tests are unpredictable - they might pass once but fail under the same conditions [15]. In multi-cluster environments, these issues often arise due to dependency mismatches, environmental differences, or intermittent resource constraints. For instance, in 2023, a major online retailer found that infrastructure limits, not code defects, were causing inconsistent test results. By upgrading their infrastructure (e.g., allocating 8GB RAM and 30GB for Elasticsearch) and fine-tuning autoscaler configurations, they reduced pipeline disruptions by 70%.
To tackle flaky tests:
- Use correlation IDs to trace failures across different components (e.g., Rails, Gitaly, Postgres) and centralise this data in tools like Kibana or Sentry.
- Set retry limits while enabling detailed debugging logs (e.g., QA_LOG_LEVEL=debug).
- Implement circuit breakers to stop execution if error rates exceed a threshold (e.g., 5%) [16].
- Employ lock files (e.g., package-lock.json or poetry.lock) and private package mirrors to maintain consistent dependency versions and avoid supply chain issues.
How to Optimise and Prevent Performance Issues
To address and avoid performance bottlenecks, focus on automating diagnostics, implementing quick rollback procedures, and conducting regular audits. Building on earlier monitoring techniques, these steps help to anticipate and resolve potential issues before they escalate.
Automated Diagnostics and Alerts
Set up alert systems to catch problems early. For example, Prometheus hierarchical federation is highly effective in multi-cluster setups. It works by having cluster-local instances gather metrics initially, which are then federated to a central production instance for broader monitoring. This design reduces network strain while maintaining visibility across clusters [18][11].
Integrate these alert systems with collaboration tools like Slack, Microsoft Teams, or Discord using solutions such as Argo CD Notifications or Botkube [1][19]. This ensures real-time updates and faster troubleshooting. When deploying updates, use canary releases with tools like Argo Rollouts or Flagger. This method allows you to release changes to a small portion of traffic, monitor their impact, and roll back automatically if performance metrics decline [19].
Additionally, give developers access to observability data early on, such as metrics, traces, and logs [1]. This enables engineers to spot and address performance issues during development, well before the code reaches production. Use Kubernetes Jobs or Argo Workflows to automate regular health checks on critical resources and dependencies [19].
Rollback Strategies and Post-Mortems
Even with early detection, having a reliable rollback plan is critical for quick recovery. GitOps-driven rollbacks are a great option - by simply reverting a commit, you can restore stability swiftly [19][21]. This method is not only fast but also provides a clear audit trail, showing exactly what changes were made and when.
To safeguard data, take periodic snapshots of etcd to prevent loss and minimise errors [3]. After an incident, conduct detailed post-mortems to uncover root causes and refine your processes. Document what went wrong, why it wasn’t detected earlier, and what adjustments will prevent similar issues in the future.
Regular Audits and Continuous Optimisation
Perform quarterly audits of alert thresholds to ensure notifications are meaningful and actionable [20]. Centralising observability across clusters creates a unified system that helps developers address issues more efficiently [1]. Tools like Argo CD and Tekton can streamline workflows by managing declarative states and standardising CI/CD components. Drift detection features in these tools compare live cluster states with desired configurations stored in Git, catching discrepancies before they lead to failures [19].
For organisations needing customised solutions, Hokstad Consulting (https://hokstadconsulting.com) offers tailored strategies. Their expertise includes DevOps transformation, cloud cost management, and automated CI/CD pipelines, all designed to reduce deployment times and cut infrastructure expenses.
Conclusion
Debugging multi-cluster pipelines effectively hinges on consistent monitoring, structured troubleshooting, and ongoing fine-tuning. Without unified telemetry across clusters, identifying issues can feel like guesswork. As highlighted earlier, unified telemetry is a non-negotiable element. Tools like Prometheus, OpenTelemetry, and Grafana lay the groundwork for visibility, while GitOps platforms such as ArgoCD help maintain configuration consistency and enable quick rollbacks when problems arise. These tools underscore the importance of unified observability and proactive management strategies.
As infrastructure grows, bottlenecks can multiply. Regular audits, automated diagnostics, and early-stage observability integration are crucial to catching and addressing inefficiencies before they spiral into larger issues. Proactive optimisation ensures that small performance hiccups don’t escalate into major disruptions.
For UK organisations navigating complex multi-cloud environments, expert guidance can make all the difference. Hokstad Consulting (https://hokstadconsulting.com) offers specialised support in DevOps transformation and cloud cost engineering, helping businesses reduce infrastructure expenses by 30–50% and improve deployment cycles with measurable, low-risk solutions. Aligning with such expertise ensures high-performing, scalable pipelines remain sustainable.
FAQs
What tools are best for monitoring multi-cluster CI/CD pipelines?
When it comes to keeping an eye on multi-cluster CI/CD pipelines, Prometheus and Grafana are a solid pair. Prometheus excels at hierarchical federation, making it easier to gather and aggregate metrics across multiple clusters. This approach simplifies centralised monitoring by pulling everything into one place. Grafana steps in to visualise this data, offering clear and interactive dashboards that make understanding performance and resource usage a breeze.
For distributed tracing, OpenTelemetry proves to be a handy tool. It helps pinpoint bottlenecks and troubleshoot issues across clusters, giving you a clear view of what's happening under the hood. And if you're working with service meshes like Istio, Prometheus can handle federated metrics collection seamlessly. Adding to this, tools like Kiali provide a closer look at the health of your service mesh and traffic flows, offering deeper insights.
By combining these tools, you get a comprehensive setup for monitoring, diagnosing, and fine-tuning your multi-cluster CI/CD pipelines. This ensures everything runs smoothly and troubleshooting becomes a much more manageable task.
How can I avoid configuration mismatches in multi-cluster environments?
To keep multi-cluster environments running smoothly, it's essential to standardise and validate configurations across all clusters. This means aligning Kubernetes versions, setting consistent resource limits, and applying uniform network policies. Without this, you risk issues like build failures or unexpected service disruptions.
Tools can make this process much easier. Centralised monitoring and configuration management solutions help you spot and fix configuration drifts early on. Additionally, automated tools such as YAML linters and resource validation scripts are great for routinely checking YAML files, dependency versions, and network setups. These tools significantly reduce the chances of mismatches slipping through the cracks.
By sticking to proven configuration management practices and using multi-cluster management features, you can ensure consistency, enhance reliability, and make troubleshooting far less of a headache in complex setups.
How can flaky tests be managed effectively in CI/CD pipelines?
Flaky tests can seriously shake confidence in your CI/CD pipelines, making it crucial to tackle them head-on. The first step is identifying these unreliable tests. You can do this by running tests repeatedly or using automated tools specifically designed to spot instability. Once you've pinpointed the culprits, isolate them to reduce their impact and prioritise fixing them to avoid unnecessary disruptions.
To make your tests more reliable, focus on common problem areas like race conditions, timing issues, or inconsistent environments. For instance, steer clear of arbitrary delays in your tests and ensure proper synchronisation between processes. If you must use retries, apply them sparingly and only on tests you’ve confirmed as flaky - this prevents masking deeper, underlying problems. Regularly revisiting and maintaining your test suite is another essential step in keeping flakiness at bay and ensuring your pipeline remains stable.
By combining early detection, focused fixes, and ongoing monitoring, you can achieve smoother deployments and rebuild trust in your automation workflows.