
If I had to sum this up in one line: pick a few user-focused metrics, set clear targets, track the error budget, and use that data to control releases, scaling, and cloud spend.
I’d boil the article down to this:
- SLIs are the numbers I track, such as success rate, latency, job completion, or message delay.
- SLOs are the targets I set against those numbers, such as 99.9% over 28 days.
- Error budgets show how much failure I can allow before I need to slow changes or stop risky releases.
- In cloud-native systems, I should measure what users feel, not just CPU, memory, or pod health.
- For APIs, workers, and event-driven services, the right SLI is often different.
- I need to choose the right measurement point: edge, service, application, or client side.
- I should keep segmentation tight: by tier, region, or critical path where it matters.
- A 28-day rolling window is often better than a calendar month for daily decisions.
- A 99.9% target leaves about 40 minutes of downtime in 28 days.
- Burn-rate alerts are better than raw error alerts because they show whether the budget is being used too fast.
- SLOs should sit in Git, feed dashboards and alerts, and help drive canary rollbacks, scaling, and right-sizing.
- Too many metrics, weak ownership, and targets that are too high can make the whole setup hard to trust.
A few numbers stand out. The article compares 99.0%, 99.5%, 99.9%, 99.95%, and 99.99% availability, and shows how each extra nine cuts downtime but adds more work and more spend. It also suggests a simple release policy:
- More than 50% budget left: ship as normal
- 20% to 50% left: slow risky changes
- Below 20%: pause non-core releases
My takeaway: this is not just about uptime. It is about making reliability a clear trade-off against speed and cost, in a way product and engineering can both use.
If I were reading the full piece, I’d expect help with what to measure, where to measure it, how to set targets, and how to turn the numbers into day-to-day rules.
SRE Fundamentals - Understanding SLIs, SLOs, SLAs & Error Budgets
Choose SLIs that reflect real user experience
Once the target is clear, pick the indicator that best shows whether the user actually got what they came for.
A common slip-up is choosing metrics that are easy to pull instead of metrics that show user impact. Even application data can mislead if it tracks system output rather than user success. “Checkout API returned 200” is not the same thing as “order placed and confirmed.” That gap is exactly where reliability issues tend to sit.
Google's SRE guidance says it plainly:
Measure availability and performance in terms that matter to an end user.[2]
A good starting point is three to five key user journeys, such as sign-in, search, checkout, or report generation. From there, work backwards to the metric that proves each journey finished as expected.
Core SLI types for APIs, workers and event-driven services
Most cloud-native services rely on four SLI types: availability, latency, error rate, and saturation. The trick is simple: use the SLI that matches how that service delivers value to the user.
For request-response APIs, availability is the share of successful requests out of total requests, where success means HTTP 2xx and a valid business outcome. Latency should be tracked at the 95th or 99th percentile. Averages smooth over the slowest requests and can make things look better than they are. [3][5] For example, a UK e-commerce checkout might aim for 95% of Place Order requests to finish within 2 seconds, with a payment provider error rate below 0.5% over 30 days.
For background workers and schedulers, availability means job completion rate: jobs finished without failure divided by jobs scheduled. Latency becomes time-to-completion. A typical target could be 99% of invoice generation jobs finishing within 5 minutes of being queued. Queue depth and queue age are useful saturation signals because backlogs often show up before outright failures.
For event-driven pipelines, the main latency SLI is end-to-end processing delay: the time from an event being published to it being fully processed downstream. For a UK retail platform taking in point-of-sale data, a sensible target might be 99.9% of events processed into the analytics warehouse within 5 minutes. Dead-letter queue rate, meaning the share of messages that cannot be processed, is a practical error SLI here, with a typical target below 0.1% of total messages over 7 days.
| Service type | Availability SLI | Latency SLI | Saturation SLI |
|---|---|---|---|
| Request-response API | % of requests returning 2xx with valid business outcome | 95th/99th percentile response time | Connection pool usage, CPU |
| Background worker | % of jobs completed without failure | Time from job creation to completion | Queue depth, queue age |
| Event-driven pipeline | % of messages acknowledged and processed | End-to-end processing delay | Consumer lag, dead-letter queue depth |
How to pick metric sources and measurement points
After defining the SLI, the next step is deciding where to measure it.
This matters just as much as the metric itself. Measure in the wrong place and your SLI can look far better than what users are living through.
The table below sums up the main trade-offs. [3][4]
| Measurement location | Pros | Cons | Best suited for |
|---|---|---|---|
| Edge (CDN, API gateway, load balancer) | Unified external view; minimal instrumentation changes; good for availability and coarse latency | Limited business context; misses internal retries and background jobs | Public APIs, multi-region front doors, basic uptime reporting for UK/EU tenants |
| Service mesh (e.g. Istio, Linkerd) | Consistent per-service telemetry without code changes; strong for microservice dependencies | Limited business semantics; operational overhead; requires mesh adoption | Internal microservices in Kubernetes; tracing inter-service dependencies |
| Application level (instrumented code) | Rich business context; precise successdefinitions; supports worker and pipeline SLIs |
Developer effort required; risk of inconsistent metric naming across teams | Critical business journeys, background workers, event-driven pipelines |
| Client side (RUM, synthetic tests) | Direct view of what UK users actually experience, including network and rendering delays | Noisy data; device variability; harder to isolate server-side failures | High-value UX flows such as checkout and login; UK-specific performance monitoring |
Use the source that best fits the reliability question you’re trying to answer.
Segment SLIs by tenant, region and service criticality
A single global view is useful, but it can hide the stuff that hurts most. If a UK enterprise tenant on a dedicated plan is dealing with poor checkout performance while the global average still looks healthy, one rolled-up metric will not flag the problem.
Segment only when contracts, compliance rules, or traffic patterns differ. A multi-tenant SaaS platform might track availability separately for enterprise and standard tiers, for example ≥ 99.95% for enterprise customers on dedicated infrastructure and ≥ 99.5% for standard-tier users on shared resources. In the same way, if data residency rules require EU workloads to stay in-region, then tracking EU data centre API latency separately from UK region latency is not optional; it is a compliance requirement.
That said, there’s a trap here too: over-segmentation. Keeping per-customer SLIs for every account creates a messy setup that becomes hard to run and hard to trust. A better route is to use a small, stable set of dimensions, such as tier (standard/premium) × region (UK/EU) × criticality (critical/non-critical). Then use per-account tracking only for a small number of key enterprise accounts where the contract calls for it. If UK and EU performance keep matching each other, one regional view is enough.
Turn SLIs into practical SLOs and error-budget policies
::: @figure 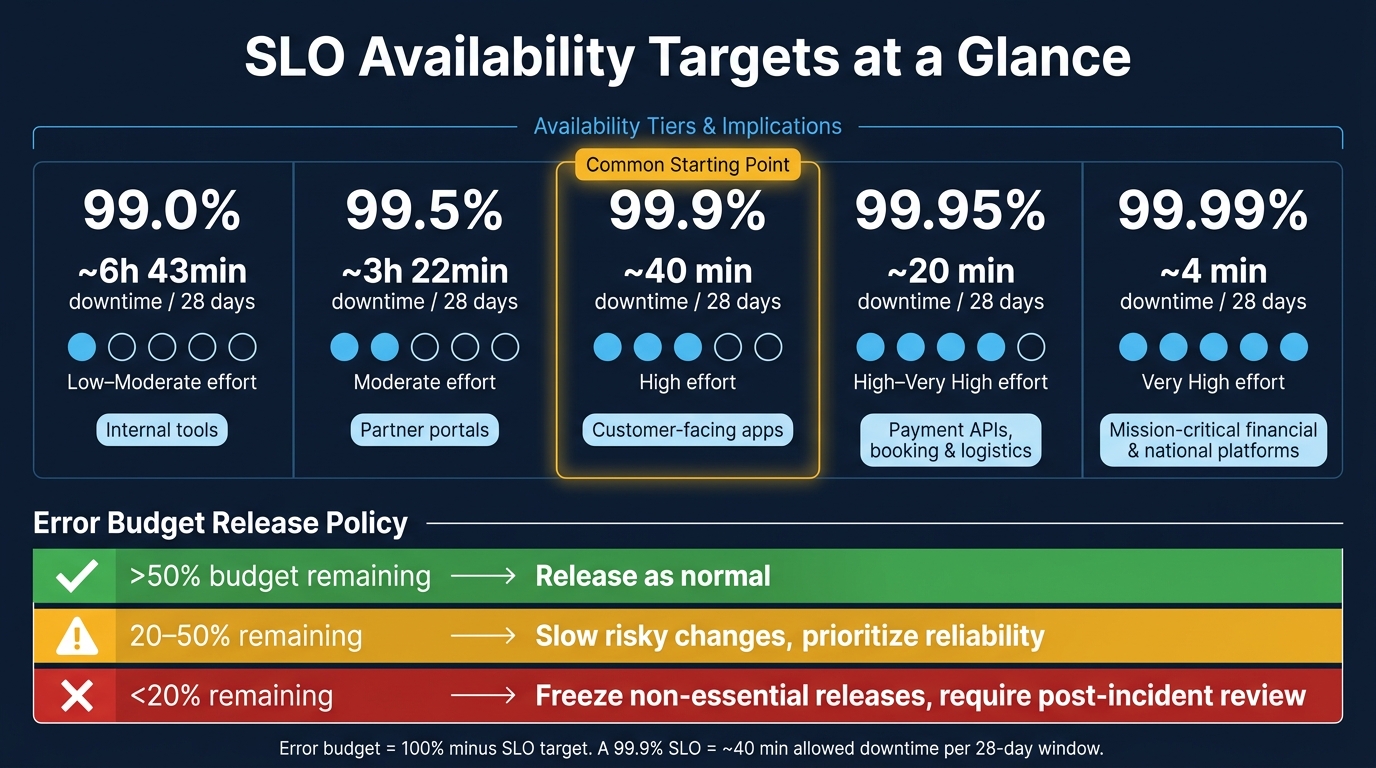 {SLO Availability Targets: Downtime, Effort & Cost Compared}
:::
{SLO Availability Targets: Downtime, Effort & Cost Compared}
:::
Take each SLI and turn it into an SLO. Then attach an error-budget policy that tells the team what happens when that budget starts shrinking. If you skip the policy part, the SLO often ends up as just another number on a dashboard.
An SLO needs four parts:
- the population: which requests or events count
- the metric and threshold: what “good” looks like
- the target percentage
- the time window
For example: 99.9% of customer-facing checkout requests must complete in under 300 ms over a 28-day rolling window. Use that same pattern for each critical journey, tenant, or region. Don’t lump everything into one global target.[8][9][12][14]
For day-to-day operations, use a 28-day rolling window. It keeps recent incidents in view and avoids the fake clean slate you get at the end of a calendar month. Monthly or quarterly reports still work well for stakeholders, but operational calls should come from the rolling 28-day view.[7][8][11]
Once the target is set, the error budget becomes the release policy. Error budget = 100% minus the SLO target.[6][13] So a 99.9% SLO leaves a 0.1% budget, which is about 40 minutes of allowed downtime across a 28-day window.[8][9] That figure should shape release decisions in a direct way, not sit there unread.
A practical policy usually has three bands:
- Healthy (>50% remaining): release as normal.
- Warning (20–50% remaining): slow down risky changes and put reliability work first.
- Budget below 20%: freeze non-essential releases until the budget recovers. Require a post-incident review before lifting the freeze.[6][7][8][15]
This needs to be agreed in writing by engineering, product, and, where it matters, account managers. That way, a budget freeze doesn’t land like a shock. It’s a planned reliability response. In teams with more mature delivery setups, SLO status can also gate deployments in the CI/CD pipeline, with an engineering lead needing to give an explicit override if the budget is in a critical state.[6][7]
Availability targets compared by cost and effort
Every extra nine costs more in engineering time, infrastructure, and operational work. That’s the trade-off. These bands help you judge whether a target is worth the extra spend and effort.[8][9][10]
| Availability target | Allowed downtime per 28 days | Operational effort | Typical use case |
|---|---|---|---|
| 99.0% | ~6 h 43 min | Low–moderate; single-region, basic monitoring and on-call | Internal tools |
| 99.5% | ~3 h 22 min | Moderate; multi-AZ strongly recommended, automated rollbacks, well-defined runbooks | Partner portals |
| 99.9% | ~40 min | High; robust CI/CD, canary releases, 24/7 on-call for critical paths | Customer-facing apps |
| 99.95% | ~20 min | High–very high; strict change control, rapid failover, regular incident drills | Payment processing APIs, booking and logistics systems |
| 99.99% | ~4 min | Very high; multi-region redundancy, mature operations, heavy staffing and tooling investment | Mission-critical financial services, national-scale platforms |
A sensible starting point for a new customer-facing service is 99.5%. Track incident patterns for a few months, then move the SLO up or down based on what you see in the incidents, what users report, and what the cost looks like. Jumping straight to 99.99% without the operational discipline to back it up usually adds cost and complexity you didn’t need.[6][8][9][10]
Implement and monitor SLOs in Kubernetes and modern DevOps workflows
Instrument services with metrics, logs and traces
Once you've defined your SLIs and SLOs, the next job is to wire them into edge, service and platform telemetry. Put simply, those targets need to show up in metrics, alerts and deployment controls.
Start at the edge. Ingress controllers such as NGINX or Envoy expose metrics like requests, request_duration_seconds and upstream_errors. That gives you a way to set availability and latency SLIs before you even get into deeper application instrumentation.[20][25] From there, instrument each service with a Prometheus client library and export RED metrics - rate, errors and duration - so you can track success rate, error count and P95/P99 latency.[20][25]
For internal microservices and asynchronous workers, don't stop at basic host signals. Collect metrics, structured logs and distributed traces. If workers are processing Kafka or RabbitMQ messages, track queue depth, message age and job success rate, not just CPU use. If your team has a processing SLO like 95% of uploaded files processed within 10 minutes, record both the receive timestamp and the completion timestamp.[20]
Then join the dots with OpenTelemetry-based tracing, using tools such as Jaeger or Grafana Tempo, plus shared correlation IDs in logs. When something breaks, that setup lets you trace the full path across services instead of guessing where the problem started.[20][25]
Define SLOs as code and alert on burn rate
Store SLO definitions as YAML in the same Git repository as your application or infrastructure code. Tools such as Sloth or Pyrra can turn those files into Prometheus recording rules and PrometheusRule resources, while GitOps tools such as Argo CD or Flux can apply them to the cluster automatically.[21][25][26] In practice, changing an SLO target goes through pull request review just like any other production change.
For alerting, use multi-window burn-rate alerts instead of plain threshold rules. A burn rate of 1.0 means the error budget is being used at the planned pace. A burn rate of 14.4 is a common fast-burn paging threshold for a 30-day SLO.[17][22][23] Fast-burn alerts should go to paging. Slow-burn alerts are better sent to a team channel or ticket queue, because a slow decline and a sharp outage need different responses.[18][24]
Infrastructure signals such as pod restarts or CPU spikes still matter, but mainly as diagnostic signals. They shouldn't page anyone unless they are burning the error budget.[16][24]
Once those burn-rate alerts are working, you can feed them straight into rollout decisions.
Use SLOs to guide scaling, releases and cloud cost decisions
SLO data becomes far more useful when it drives day-to-day choices instead of sitting on a dashboard.
During a canary rollout, tools such as Argo Rollouts or Flagger can compare the canary's error rate and latency against the SLO threshold. If the canary starts burning the error budget faster, the deployment can pause or roll back on its own.[19][26] If your team isn't using progressive delivery tooling yet, a simple rule works well: avoid risky changes when less than 20% of the monthly error budget remains.[11][26]
The same SLO data can guide scaling and capacity choices too. If latency creeps up near the target during peak traffic, that points to scaling. If queue depth or message age starts pushing against a processing SLO, add worker capacity or tune concurrency. On the other hand, if you're meeting the SLO with loads of headroom, that may be a sign you're paying for more infrastructure than you need.
| Decision type | Relevant SLO signal | Typical action | Cost or reliability impact |
|---|---|---|---|
| Web API scaling | P95 latency approaching the SLO threshold at peak | Increase HPA replica count; add nodes in a UK region | Higher hourly cost; fewer SLO breaches during peak traffic |
| Worker queue scaling | Message age or queue depth threatening a processing SLO | Add worker replicas; tune concurrency | Moderate cost increase; backlog stays within target |
| Canary release control | Rising error-budget burn during rollout | Pause or roll back the canary | Slight delivery delay; avoids customer-visible outage |
| Right-sizing | SLO consistently met with large headroom | Reduce replicas or instance size | Lower monthly cloud spend; slightly less buffer |
| Capacity planning | Historical SLO performance during seasonal peaks such as Black Friday or Boxing Day | Pre-scale key services; reserve capacity in advance | Predictable higher cost during peaks; maintains reliability |
Governance, common mistakes and next steps
Once SLOs start shaping releases and scaling, governance is what keeps them honest. It ties SLOs back to user value, release discipline and cloud cost control.
Ownership, review cadence and change control
Every SLO needs one clear owner. If everyone owns it, no one does.
A simple split often works best. Product defines the journeys that matter most and the reliability target for each service tier. Engineering or SRE owns the SLIs, alerts and error budgets. Platform or DevOps owns shared observability and reusable templates. [1][28]
That ownership only means something if teams review SLOs on a set rhythm. A solid default is:
- quarterly for most services
- monthly for critical paths such as payments or authentication
- every six months for lower-risk internal tools [36][35]
On top of that, review error budget and burn rate weekly or once per sprint, and include SLO impact in every post-incident review. Framing incidents in error-budget terms gives leadership a much clearer basis for action. [30][34]
Change control should stay light, not bloated. Store SLO definitions as versioned YAML in Git, require sign-off from product and tech leads before changing a target, and log the reason for each change. That reason might be a new customer contract, a traffic shift or an incident that exposed a measurement gap. [1][28]
Common SLO mistakes in cloud-native environments
When SLOs drift away from user journeys, teams start tuning the wrong dials.
| Mistake | Why it causes problems | How to fix it |
|---|---|---|
| Too many SLIs | Dashboards and alerts lose signal | Limit each product to 3–7 SLOs tied to real user journeys [31][33][35] |
| Infrastructure-only SLIs (CPU, pod restarts) | These metrics track platform health, not user experience | Measure from the edge using synthetic monitoring or real user monitoring [31][33][34] |
| Unrealistic 99.999% targets | Constant breach indications erode trust in the SLO system | Base targets on 6–12 months of historical performance data [6][2][32][35] |
| SLAs tighter than internal SLOs | Removes the error-budget buffer | Ensure SLAs sit at or below internal SLO targets [6][2][31] |
| Alerting on raw errors rather than burn rate | Raw-error paging creates noise and hides budget use | Switch to multi-window burn-rate alerts [27][24][29][23] |
Most of these problems come back to the same few issues: weak ownership, poor scope, or targets set without operational discipline.
Conclusion: build reliable systems without overspending
The main idea in this guide is pretty simple. Choose a small set of SLIs that reflect what users actually feel. Set targets based on historical data and cost reality. Manage error budgets on purpose. Then connect SLOs to your observability stack and delivery workflows.
Done well, SLOs help teams improve reliability without buying more capacity than they need.
If your organisation already has SLO dashboards but release and scaling calls still come down to gut feel, that tells you something. The same goes if cloud spend keeps rising while incidents keep landing. In both cases, the practice is there on paper, but not yet built into day-to-day work.
Hokstad Consulting can help design business-aligned SLOs, connect them to DevOps workflows and observability pipelines, and use them to keep cloud spend under control.
FAQs
How do I choose my first SLI?
Start with metrics that show what users actually feel and what the business cares about. A simple place to begin is the Four Golden Signals: latency, traffic, errors and saturation.
Work from the top down. Look at the broader application layers first, then drill into the business logic underneath. That way, you spot system-level pain before getting lost in the weeds.
When you measure latency, don’t lean on averages. They can hide slow experiences that hit a smaller slice of users but still do real damage. Focus on tail latency instead, such as p95 or p99.
Historical data helps here. Use it to set baselines, so you’re not guessing what “normal” looks like.
Above all, pick indicators you can measure and act on. If a metric can’t help you make a decision or fix a problem, it’s probably noise.
What is a good starting SLO target?
A good starting SLO target should come from historical performance data, business needs, and user expectations, not a made-up threshold.
Start with user-focused metrics like latency, error rates, and availability. Common early targets include 99.9% uptime, error rates below 0.1% to 1%, and p95 latency under 500 milliseconds.
Keep those targets achievable. If they’re too strict, teams end up dealing with alert fatigue. If they’re too loose, there’s little pressure to improve.
When should error budgets block releases?
Error budgets should block releases when the accumulated error rate goes past your predefined SLOs. An error budget is the amount of unreliability your service can get away with. Once that budget is used up, the service has hit its failure threshold.
At that point, new feature releases should pause. Teams need to focus on stability, run root-cause analysis, and earn back the budget.