
A single cloud cost forecast often fails in multi-cloud setups. If spend can miss by 25% or more, I would not plan with one number alone. I would plan with a small set of scenarios in £ so finance and engineering can test growth, migration delays, commitment choices, and downside risk before the budget goes off track.
Here’s the short version:
- I’d start with clean billing data from AWS, Azure and Google Cloud
- I’d convert all costs into GBP using one agreed FX source and date
- I’d make sure spend is tied to teams, workloads, environments and owners
- I’d build a baseline from the last 60–90 days and track unit costs such as:
- cost per user
- cost per transaction
- cost per GB stored
- cost per GB transferred
- I’d use trend data plus business drivers instead of trends alone
- I’d keep to four core scenario types:
- growth
- migration
- commitments
- risk
- I’d review variances weekly, reforecast monthly, and review commitments quarterly
- I’d track forecast accuracy with MAPE, with a medium-term target of 10–15%
A few numbers stand out. Commitment discounts can be large, with Google Cloud CUDs reaching up to 57% off in some cases. FX moves of 10–20% can also change effective costs for UK firms billed in USD. And if commitment use drops too far, a deal that looked cheap on paper can turn into waste.
AWS re:Invent 2025 - Advanced multicloud cost reporting with FOCUS (COP419)
Quick comparison
| Area | What I’d focus on | Why it matters |
|---|---|---|
| Data | One cost model across all clouds in £ | Makes budgets and variance checks line up |
| Allocation | 85–95% tag coverage | Lets me model spend by workload and team |
| Forecasting | Trends + 5–10 business drivers | Links cost to demand, not guesswork |
| Scenarios | Growth, migration, commitments, risk | Covers the main sources of cost change |
| Review cycle | Weekly, monthly, quarterly | Keeps the forecast tied to actual spend |
| Accuracy | MAPE and forecast bias | Shows where assumptions are weak |
My main takeaway is simple: if you want cloud budgets you can defend, build one clean cost base, model a few clear scenarios, and review them every month against actuals and changing assumptions.
Build a clean cost data foundation across clouds
Scenario planning is only as good as the data underneath it. So the next move is simple: take scattered billing records and turn them into one cost base you can model against.
For UK organisations, that usually means pulling billing and usage data from AWS, Azure and Google Cloud, then normalising and reconciling everything in GBP. Cloud invoices often land in USD, EUR or other currencies, so convert them at ingestion using an agreed FX source and date, such as daily Bank of England rates. That way, you can compare spend across clouds on a like-for-like basis.
Collect billing exports from AWS, Azure and Google Cloud
Each cloud has its own export route. All three should feed into one central store, usually a data warehouse or cost platform, where records are mapped into the same schema.
| Provider | Export Method | Data Granularity | Refresh Frequency |
|---|---|---|---|
| AWS | Cost and Usage Reports (CUR) to S3; Cost Explorer API | Hourly or daily, with optional resource-level detail | Daily |
| Azure | Cost Management exports to Azure Storage (CSV or Parquet) | Daily or hourly, depending on the export setup | Scheduled daily or hourly |
| Google Cloud | Cloud Billing export to BigQuery | Daily; detailed export adds resource-level data | Near real time [5] |
Map provider fields into one shared structure: service, region, environment, team, workload, usage type and billing entity - account, subscription or project. Keep both the original billed amount and the GBP amount so month-end reconciliation stays clean. If you align the model to FOCUS, field drift across clouds becomes much easier to control.
Set tagging and allocation rules that support forecasting
Good tagging is what turns raw billing data into something you can plan with. Without it, too much spend ends up in an unallocated bucket, and that makes workload-level scenarios far less reliable.
| Tag Dimension | Why It Matters | Scenario Types That Depend on It |
|---|---|---|
| Cost Centre | Maps spend to finance codes and GBP budgets | Budgeting, chargeback, risk |
| Business Unit | Groups workloads by strategic line of business | Growth, portfolio-level planning |
| Application / Workload | Identifies specific services or products | Migration, decommissioning, rightsizing |
| Environment | Separates production, staging, test and development | Risk, non-production reduction scenarios |
| Owner | Assigns accountability to a team or individual | Commitments, rightsizing, optimisation |
Tag cost-driving resources at 85–95% coverage [7][8]. Use AWS Config, Azure Policy and Google Cloud organisation policies to enforce tags. Then make those tags mandatory in Terraform, CloudFormation and Bicep. For older resources, virtual tagging can plug gaps without changing the underlying infrastructure.
Build baseline unit costs before modelling change
Before you model any change, set baseline unit costs using the last 60–90 days of data, while excluding incidents and load tests [9]. This gives you a steadier starting point instead of one distorted by one-off spikes.
Track unit costs such as:
- cost per active user
- cost per transaction
- cost per GB stored
- cost per GB transferred
- cost per environment
Once that baseline is clean, you can test each scenario against the same cost base.
Model the scenarios that matter to budgets and strategy
::: @figure 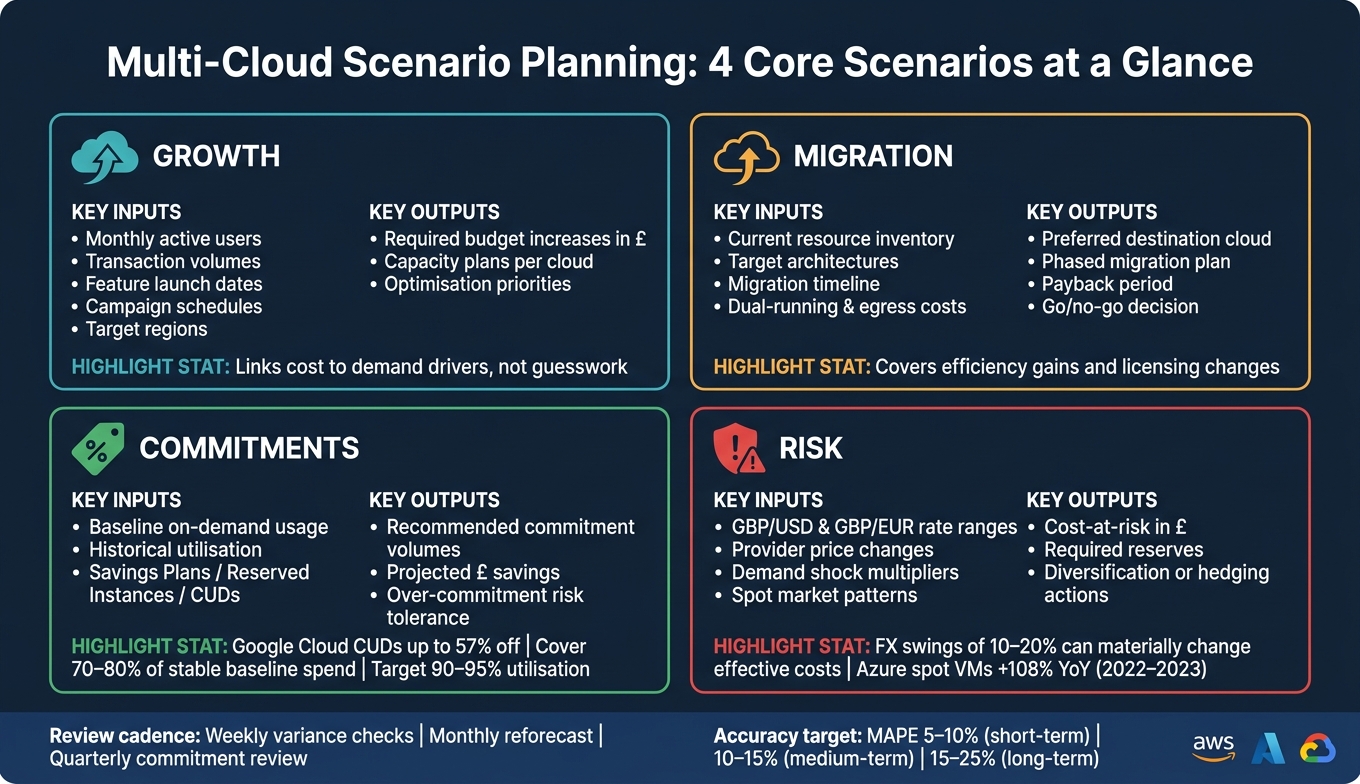 {Multi-Cloud Scenario Planning: 4 Core Scenarios at a Glance}
:::
{Multi-Cloud Scenario Planning: 4 Core Scenarios at a Glance}
:::
Combine trend-based and driver-based forecasts
Use the baseline from the previous section as your starting point, then add demand drivers on top. Begin with monthly spend by provider and major cost category. Use the last 12–24 months to project baseline spend with seasonality and simple regression.
That gives you a useful trend line. But it only becomes fit for planning when you add the business changes that push usage up or down. Think customer growth, product launches, campaigns, expansion, and regulatory change. Turn those business drivers into usage shifts, then apply unit prices to build a forecast that finance and engineering can both challenge and test.
A good starting range is five to ten drivers. Recalibrate the model each month against actual spend and usage. For medium-term forecasts, aim for MAPE below 15%.[1]
Once the forecast is driven by those inputs, turn it into repeatable scenario templates.
4 scenario templates: growth, migration, commitments and risk
Instead of building one all-purpose forecast, organise planning around four reusable scenario types. Each one answers a different question. And each one gives you outputs you can use in budget reviews, engineering conversations, and board packs.
| Scenario type | Key inputs | Assumptions | Outputs |
|---|---|---|---|
| Growth | Monthly active users; transaction volumes; feature launch dates; campaign schedules; target regions | Driver-to-usage relationships; autoscaling policies; service-level objectives | Required budget increases in £; capacity plans per cloud; optimisation priorities |
| Migration | Current resource inventory; target architectures; migration timeline; dual-running and egress costs | Efficiency gains on the target platform; acceptable downtime; licensing changes | Preferred destination cloud; phased migration plan; payback period; go/no-go decision |
| Commitments | Baseline on-demand usage; historical utilisation; provider discount options (Savings Plans, Reserved Instances, committed use discounts) | Workload stability over multiple years; target utilisation levels; expected growth or shrinkage | Recommended commitment volumes; projected £ savings; over-commitment risk tolerance; signing strategy |
| Risk | GBP/USD and GBP/EUR rate ranges; potential provider price changes; demand shock multipliers; spot market patterns | Likelihood and magnitude of FX shifts; correlation between demand spikes and capacity limits | Cost-at-risk in £; required reserves; diversification or hedging actions |
Some of the numbers here are hard to ignore. Google Cloud's committed use discounts for Compute Engine can reach up to 57% off normal prices[12], while Azure spot VM pricing rose 108% year-on-year between 2022 and 2023, compared with a 21% increase on AWS and a roughly 26% decrease on GCP[14]. That kind of movement is exactly why risk deserves its own scenario.
For commitments, a sensible rule is to cover 70–80% of stable baseline hourly spend on AWS Savings Plans, while leaving the rest on demand to handle variability. Aim for utilisation in the 90–95% range.[10][13] Then stress-test it. If utilisation falls to 70%, the maths on a 3-year Reserved Instance can go south fast.
When to use Monte Carlo simulation
Use deterministic scenarios for most planning cycles. Switch to Monte Carlo when several uncertainties move at the same time.
Instead of giving you one forecast number, Monte Carlo runs thousands of iterations across plausible input ranges and returns a distribution of annual cloud spend in £. That matters when exposure stacks up. A 10–20% swing in GBP/USD can materially change effective cloud costs for a UK organisation billed mainly in USD, so a single-point forecast can miss the problem entirely.
Monte Carlo is useful because it shows tail risk that three fixed scenarios may not catch. Use it for tail risk, not day-to-day budget planning.
The next step is to run these scenarios through monthly review and provider tools.
Tools and workflows for ongoing scenario planning
Once the scenarios are modelled, the next job is keeping them up to date. This only works with a steady rhythm. You need recent actuals, clear owners, and a simple hand-off between engineering, finance and leadership.
The best setup is usually a mix: use each cloud provider’s own tools for baseline forecasts and quick what-if checks, then feed those numbers into one central view.
Use provider-native tools for forecasts and what-if checks
Each major cloud provider has forecasting and budgeting tools that can anchor a baseline forecast.
AWS Cost Explorer generates usage and cost forecasts from past data, with an 80% prediction interval. It also includes commitment reports, so you can test different Savings Plans or Reserved Instance coverage levels before you commit. It does need enough billing history to work well. If an account is new or tagging is poor, forecasts may be blank.[18]
Azure Cost Management gives daily and accumulated cost views that can be projected up to a year ahead. For forward-looking scenarios, use amortised cost because it includes the effect of reservations.[20][11] Azure also supports forecast-based budget alerts, which fire before actual spend passes a threshold.
Google Cloud Billing supports budget alerts on forecasted spend too. That means budgets can warn you about overspend before actual spend crosses the limit.[17][19]
To make all three comparable, line them up to the same windows: next month, next quarter and next 12 months. Then convert every output to GBP using one FX rate agreed at the start of each planning cycle. It also helps to set one central scenario template - base, high-growth, migration-heavy - and require each provider’s native tools to fill it using the same date ranges and business-driver assumptions.[1][21]
Use these outputs as inputs to the central forecast, not as stand-alone answers.
Run a monthly reforecast and variance review
A simple cadence works well here:
Weekly checks use provider dashboards to spot week-on-week deviations above 10% by tag or cost centre. Engineering then looks into the cause, such as misconfigured autoscaling, unused volumes or unexpected data transfer. Finance logs any variance that is likely to last more than a week.
Monthly reforecasting pulls actuals from all providers, reconciles them against the previous forecast in a central model in GBP, updates driver-based assumptions like active users, transaction volumes and data ingested, and refreshes the three to 12-month outlook. Every changed assumption should be logged with an effective date, owner and rationale.[16] At that point, review growth, migration, commitment and risk scenarios against actuals.
Track MAPE and forecast bias as well. A positive bias means you keep over-forecasting. A negative bias means you are under-estimating, and that is the riskier pattern of the two.[22] Indicative targets depend on how mature the model is:
| Forecast horizon | Target MAPE |
|---|---|
| Short-term (1–30 days) | 5–10% |
| Medium-term (3–12 months) | 10–15% |
| Long-term (12–36 months) | 15–25% |
Calculate MAPE at the main product or team level, not just at total cloud level. That is where weak assumptions tend to show up first. The monthly review can then show whether driver definitions or look-back windows need changing. Quarterly commitment reviews bring leadership, finance and engineering together to check utilisation across AWS Savings Plans, Azure Reservations and Google Committed Use Discounts, and decide whether to add new commitments or adjust existing ones based on the latest scenarios.
How Hokstad Consulting can help
Some teams just do not have the time or headcount to run this cadence well. In those cases, it can make sense to outsource the setup and day-to-day upkeep.
Hokstad Consulting can build the operating model behind this process: cost audits, unified tagging, policy-as-code guardrails, migration modelling and automation across public, private, hybrid and managed environments.
Conclusion: Turn Multi-Cloud Uncertainty into Clear Cost Decisions
Multi-cloud cost management doesn't have to feel unpredictable. Scenario planning gives you a clear way to stay ahead of change instead of trying to explain cost swings after they've already happened. Once that frame is in place, the focus shifts to clean data, steady assumptions and shared ownership.
For UK organisations, the upside is plain: when scenarios are shown in £ and tied to 1 April–31 March budgets, finance and engineering can work from the same budget picture. That makes commitment decisions - Savings Plans, Azure Reservations, Committed Use Discounts - much easier to back, and migration business cases easier to defend.
Carry these points into the next budgeting cycle:
Start with clean, attributable cost data. Without it, scenario outputs become too high-level to act on.[3][2][23][6]
Keep to a small standard set: base, growth, migration, commitments and risk. Each scenario should include clear assumptions - growth rates, migration timelines and commitment levels. Then, if actuals drift, you can see which assumption failed.
Set clear ownership and review assumptions each month. Engineering should provide the architecture and timing assumptions, while finance should check them against budget limits and fiscal rules. Treat scenario planning as a monthly operating habit, not a one-off budgeting task. Track workload-level MAPE each month so the model keeps finance on side.[22]
FAQs
How do I start scenario planning with messy multi-cloud billing data?
Start by cleaning and lining up the data. Pull in 12–24 months of billing and usage from each cloud, put it into one daily format, convert all costs to a single GBP baseline, and keep tags aligned across providers. Strip out one-off charges, deleted resources, and odd spikes that would skew the numbers.
Next, build a driver-based baseline. Split fixed commitments from variable costs, then model key changes as scheduled deltas with ramp logic. After that, test best-case, expected, and worst-case scenarios against the unified dataset.
Which business drivers matter most in a multi-cloud cost forecast?
The drivers that matter most are the ones that link cloud usage to revenue or day-to-day operations.
Focus on:
- Internal drivers, like product launches and regional expansion
- Strategic drivers, like Reserved Instances and storage optimisation
- External drivers, like vendor pricing, regulation, and GBP/USD exchange-rate changes
- Reverse drivers, like workload reductions and decommissioning
Don’t build forecasts on past spend alone. Base them on clear assumptions tied to business events.
When should I use Monte Carlo instead of simple cost scenarios?
Use Monte Carlo instead of simple cost scenarios when you need to test uncertainty across a broad range of possible outcomes.
Simple scenarios look at a few fixed events. Monte Carlo does more than that. It models changing variables and shows a spread of future cost outcomes, not just one or two set paths.
That matters most in multi-cloud environments, where costs can shift for lots of reasons at once. With Monte Carlo, you can put numbers on risk, spot the main cost drivers, and make steadier financial decisions.