
Self-healing systems are transforming how microservices scale. They autonomously detect, diagnose, and resolve issues, reducing downtime and manual intervention. These systems are built on four core functions: detection, diagnosis, recovery, and learning. For example, Kubernetes plays a key role by restarting failed containers and isolating unhealthy pods.
Key Benefits:
- Faster Recovery: Automated fixes resolve issues in under 5 minutes, compared to 20+ minutes manually.
- Cost Savings: Avoid downtime losses (e.g., £115,000–£445,000/hour) with automation costing around £400/month.
- Reduced Engineer Fatigue: Cuts alert fatigue by over 90% and allows teams to focus on improvements.
How It Works:
- Observability: Metrics, logs, and traces provide system health insights.
- Decision-Making: Policies guide automated actions (e.g., scaling, rollbacks).
- Execution: Recovery actions like restarting containers or rerouting traffic are carried out seamlessly.
Real-World Success:
In 2025, a company avoided £8 million in losses by implementing circuit breakers and bulkheads, ensuring recovery within 5 minutes during an AWS zone failure.
Takeaway: Start small with Kubernetes' built-in features, then expand with advanced tools like AI-driven remediation and chaos engineering to ensure long-term resilience.
::: @figure 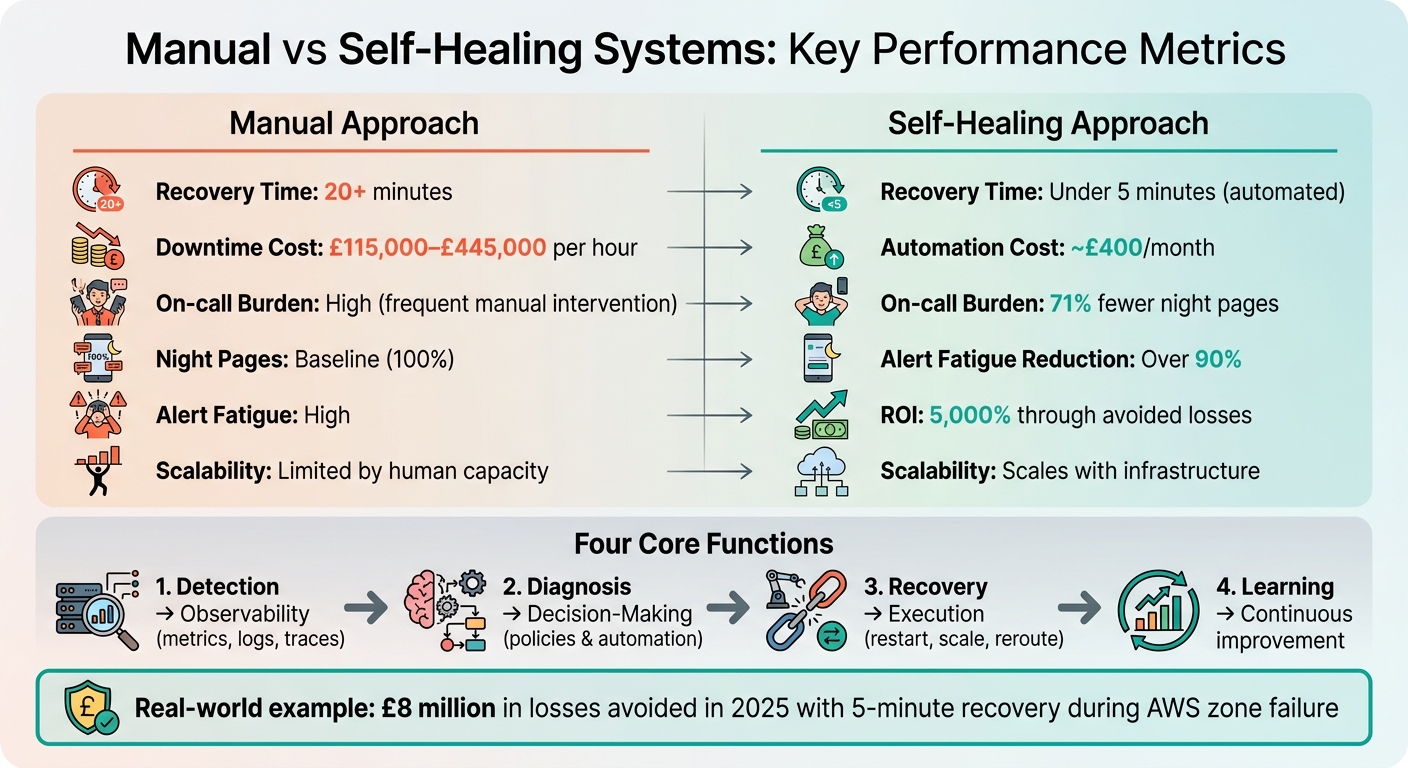 {Manual vs Self-Healing Systems: Recovery Time, Cost Impact, and ROI Comparison}
:::
{Manual vs Self-Healing Systems: Recovery Time, Cost Impact, and ROI Comparison}
:::
Kubernetes Self-Healing Explained: How Your Apps Fix Themselves!
Need help optimizing your cloud costs?
Get expert advice on how to reduce your cloud expenses without sacrificing performance.
Core Components of Self-Healing Microservices
To ensure microservices can recover autonomously and scale effectively, a self-healing architecture relies on three main layers: observability, decision-making, and execution. These layers work together to detect issues, decide on the best course of action, and implement recovery measures.
Observability and Monitoring
Observability is the foundation of any self-healing system. Without a clear view of what’s happening inside your services, automated recovery simply isn’t possible. This layer collects three types of telemetry data:
- Metrics: Numerical data, such as CPU usage or memory consumption.
- Logs: Event records that detail what occurred within the system.
- Traces: Maps of request paths across service boundaries.
These data points combine to give a comprehensive picture of system health.
Monitoring focuses on four golden signals to assess service performance:
- Latency: Measures how long requests take to process.
- Traffic: Tracks demand levels on the system.
- Errors: Monitors failure rates.
- Saturation: Observes resource usage.
For example, if error rates exceed 5% or latency spikes occur, automated responses like scaling or activating circuit breakers can be triggered. Additionally, probes like liveness, readiness, and startup checks help identify failure states and initiate the appropriate recovery actions. These probes ensure services monitor both their internal health and the health of their dependencies.
Using correlation IDs across systems is another critical component. These IDs link traces, logs, and metrics to a single user request, simplifying the process of pinpointing failures in complex service chains. Once anomalies are identified, the decision-making layer takes over to evaluate them against predefined policies.
Automated Decision-Making and Remediation
The decision-making layer acts as the brain of the self-healing system. It evaluates detected anomalies against predefined policies and applies safety constraints to prevent unintended consequences. This layer ensures that specific failure modes are matched with the right remediation actions.
For instance:
- A OOMKilled error might trigger a policy to increase memory limits by 50%.
- A CrashLoopBackOff event could initiate a rollback to the last stable deployment.
Here’s a table illustrating some common remediation rules:
| Remediation Rule | Trigger Event | Automated Action |
|---|---|---|
| Resource Adjustment | OOMKilled | Increase memory limits (e.g., by 50%) [2] |
| Version Control | CrashLoopBackOff | Rollback to the previous stable deployment [2] |
| Traffic Management | Readiness Probe Failure | Remove instance from load balancer pool [2] |
| Process Recovery | Liveness Probe Failure | Restart the container or service instance [2] |
To begin, it’s often best to implement rule-based automation for straightforward, low-risk issues. Over time, more advanced AI-driven models can be introduced for handling complex scenarios [5]. It’s also important to record the outcomes of these actions to improve future responses [5][3]. However, frequent automated restarts should raise alerts to ensure root causes aren’t being overlooked [6].
Execution Layers for Automation
Once a decision is made, the execution layer steps in to carry out the recovery actions seamlessly. In Kubernetes environments, for example, a remediation controller monitors specific pod events via the API and executes recovery actions tailored to the failure type [2]. These actions might include scaling resources, restarting containers, or rerouting traffic away from unhealthy instances.
Separating liveness and readiness probes is crucial for effective recovery. A failed liveness probe signals the need for a restart, while a failed readiness probe removes the instance from the load balancer pool without terminating the container [7][2]. Finally, the system must verify that services have returned to a stable state after recovery, ensuring issues are resolved rather than assuming success.
How to Implement Self-Healing Systems
To implement self-healing systems, start by defining service health using Service Level Objectives (SLOs) and Key Performance Indicators (KPIs). Then, align your platform's capabilities with clearly defined, codified policies to ensure consistent behaviour.
Using Kubernetes for Self-Healing
Kubernetes is well-equipped with built-in self-healing features, thanks to its control plane. For instance, the kubelet automatically restarts failed containers, and controllers like Deployments and StatefulSets replace failed Pods to maintain the desired state [1]. If a Pod becomes unhealthy, Kubernetes removes it from service endpoints, ensuring traffic is routed only to healthy instances [1].
Key tools like liveness, readiness, and startup probes play a crucial role in self-healing. They help restart failing Pods, manage traffic flow, and support applications that take longer to start. Deployment strategies also influence fault tolerance. For example:
- ReplicaSets: Spread across multiple availability zones, they manage Pod and zone failures with moderate complexity.
- StatefulSets: Ideal for distributed databases, offering robust fault tolerance but requiring careful configuration [8][9].
To ensure availability during disruptions, Pod Disruption Budgets (PDBs) maintain a minimum number of replicas during node maintenance or automated evictions [8][9]. For event-driven workloads, Kubernetes Event-Driven Autoscaler (KEDA) dynamically scales services based on external triggers like RabbitMQ queue depth [2][9]. However, avoid targeting the same metric with both the Horizontal Pod Autoscaler (HPA) and Vertical Pod Autoscaler (VPA), as this can lead to conflicts and instability [9].
Beyond Kubernetes' native features, managed cloud platforms offer additional tools to simplify recovery processes.
Cloud Platform Solutions
Managed cloud platforms enhance self-healing by ensuring environments are reproducible and recoverable through Infrastructure as Code (IaC) and chaos engineering. Tools like Terraform and Pulumi enable automatic re-provisioning of environments to a stable state after failures. Chaos engineering, on the other hand, tests recovery processes by simulating failures in controlled environments using tools such as Azure Chaos Studio or AWS Fault Injection Simulator.
For organisations needing expert guidance, Hokstad Consulting (https://hokstadconsulting.com) provides tailored services for cloud infrastructure optimisation and DevOps transformation.
When automating remediation, follow this four-step process:
- Detect issues using event sources.
- Decide on actions based on pre-defined logic.
- Act by running scripts or making API calls.
- Verify the fix through logs.
Start with simple tasks, like adding missing tags, before moving to more complex actions such as restarting services or deleting resources. Always test new self-healing logic in a dry-run mode for at least two weeks before enabling automated execution.
Event-Driven Architectures with AI
AI-driven solutions take self-healing to the next level by enabling smarter, proactive decision-making. These systems can differentiate between critical failures and transient issues, reducing unnecessary interventions. For example, Large Language Models (LLMs) can classify events - such as distinguishing an out-of-memory error from a configuration issue - to determine if automated remediation is appropriate [10].
A Deployment replacing a failed pod is self-healing... The interesting territory is the middle: observe, diagnose, act conditionally.
- Aram Hakobyan, Founder & CEO of OpsWorker [10].
Filtering event noise is crucial for AI systems. Investigating every transient event can overwhelm teams, so setting a threshold (e.g., three or more occurrences) helps reduce false positives [10]. Reliable AI systems often require confidence scores of 0.90 or higher before executing automated actions [10]. High-risk actions, such as cordoning nodes or altering network configurations, should always require human approval - regardless of AI confidence levels [10].
The goal is not to replace humans with AI, but to create powerful partnerships where AI handles routine tasks and humans focus on strategic decisions and innovation.
- Appropri8 Team [8].
Monitoring Tools for Self-Healing Systems
Effective monitoring is the backbone of self-healing systems. It ensures metrics are collected, system health is visualised, and automated responses are triggered when issues arise.
Prometheus and Grafana for Observability
Prometheus acts as a time-series monitoring tool, pulling metrics from Kubernetes components and microservices through a dimensional data model [11][12]. It focuses on collecting the Four Golden Signals - latency, traffic, errors, and saturation - which are key to assessing service health. Grafana complements this by visualising these metrics in dashboards, making it easier to spot anomalies.
Prometheus’ Alertmanager plays a critical role in self-healing by triggering automated actions like restarting pods or scaling resources when certain thresholds are breached [13][14]. To maintain dashboard performance during high-scale incidents, recording rules are used to pre-compute complex queries [13].
The difference between a 5-minute incident and a 5-hour one is almost always the same thing: observability.- Saqeeb Mohammed Bijapur, Engineer - Site Reliability [13]
For more effective alerts, focus on symptoms rather than causes. For instance, trigger alerts based on user-facing issues like high error rates instead of internal metrics to minimise alert fatigue [13]. Consistency in label naming (e.g., using service instead of app) across microservices is crucial for smooth querying and visualisation [13]. At scales exceeding 5 million active series, functional sharding with multiple Prometheus instances and a unified Thanos Query layer ensures the system can handle the load efficiently [13].
Building on these tools, service meshes and distributed tracing provide deeper insights into inter-service communication, which is vital for diagnosing complex failures.
Service Meshes and Distributed Tracing
Istio enhances visibility by generating detailed telemetry, including metrics, traces, and logs, through Envoy sidecars. These sidecars collect both proxy-level and service-level metrics, offering a clear picture of request flows across services. Istio’s ambient mode significantly reduces resource consumption, cutting CPU usage from 0.20 vCPU to 0.06 vCPU per 1,000 requests and memory use from 60 MB to 12 MB. This efficiency not only conserves resources but also ensures uninterrupted visibility, which is essential for self-healing.
OpenTelemetry is a widely adopted standard for capturing traces, metrics, and logs. By 2025, 48.5% of organisations are expected to use OpenTelemetry to standardise their observability data [12]. Tools like Jaeger and Zipkin serve as backends for visualising request flows, making it easier to pinpoint bottlenecks and latency issues that might otherwise go unnoticed.
The RED Method - Rate, Errors, Duration - provides a structured way to monitor services [15]. Multi-window alerts, which evaluate both short-term (5-minute) and long-term (1-hour) data, help filter out transient noise while catching prolonged issues [15]. Additionally, monitoring burn rates - how quickly the error budget is being consumed - offers a more dynamic approach than relying on static thresholds [15].
To ensure these mechanisms work under stress, chaos engineering tools simulate real-world failures, validating the system’s ability to recover.
Integration with Chaos Engineering
Chaos engineering tools like Azure Chaos Studio and AWS Fault Injection Simulator test self-healing mechanisms by simulating failures such as node shutdowns, network delays, or resource exhaustion. These controlled experiments confirm that automated remediation processes function as intended.
Tools like Flagger and Argo Rollouts take this further by automating canary deployments and rollbacks. They monitor Prometheus metrics in real-time and revert traffic if error thresholds are crossed. Pre-deployment checks, such as using istioctl analyze for static analysis and ValidatingWebhooks for policy enforcement, catch configuration issues early. These practices ensure that recovery mechanisms are both timely and reliable.
Finally, it’s essential to monitor the health of the monitoring stack itself. External checks should be in place to ensure that tools like Prometheus and Grafana remain operational, as their failure could create a single point of vulnerability [13].
Measuring Success and Best Practices
Key Metrics for Success
To truly gauge the effectiveness of self-healing systems, you need clear and measurable outcomes. One critical metric is Mean Time to Recovery (MTTR), which tracks how quickly a system can bounce back. Another is Service Level Objectives (SLOs) - these set the performance benchmarks and availability targets your system should meet. For instance, achieving 99.99% uptime translates to only a few minutes of allowable downtime per month [3].
The financial stakes are high. For large enterprises, unplanned downtime can cost anywhere from £115,000 to £445,000 per hour [6]. This makes automation not just an operational benefit but a financial necessity. Self-healing systems also ease the burden on engineers, with studies showing a 71% reduction in middle-of-the-night incident alerts [6]. To measure overall resilience, the Resilience Evaluation Score (RES) provides a structured 10-point checklist. It evaluates aspects like failure mode definitions, tail latency (e.g., P95/P99), and idempotency [16].
In the era of big data, insights collected from cloud services running at the scale of Azure quickly exceed the attention span of humans.– Mark Russinovich, CTO of Microsoft Azure
Self-healing systems address this challenge by processing and acting on data far faster than any human team could. The table below highlights how automated self-healing stacks up against manual approaches.
Table: Manual vs Self-Healing Approaches
| Metric | Manual Approach | Self-Healing Approach |
|---|---|---|
| On-call Burden | High (frequent manual intervention) | 71% fewer night pages [6] |
| Recovery Time | Hours (engineer availability) | Minutes to seconds (automated) |
| Performance Overhead | None | ~8ms additional latency per request [4] |
| Cost Impact | £115,000–£445,000 per hour downtime [6] | 5,000% ROI through avoided losses [4] |
| Scalability | Limited by human capacity | Scales with infrastructure |
Best Practices for Deployment
To ensure your self-healing systems deliver consistent results, follow these practical strategies:
- Define Service Health: Establish baselines for key metrics like CPU usage, memory, and response times before rolling out automation. Without these benchmarks, the system won't know when to intervene [3].
- Implement Layered Health Checks: Monitor infrastructure, applications, and critical dependencies with multiple layers of checks. Use proper health endpoints for precise tracking [6][2].
Automation needs to be carefully managed to avoid unintended consequences. For instance, set guardrails to limit the scope of automated actions. Define maximum retry attempts and ensure there are escalation paths to human operators if automated processes fail [2][6]. When configuring retries, use exponential backoff with jitter to avoid overwhelming systems with retry storms [16].
Another important practice is the use of synthetic transactions. These simulate key business operations to detect subtle failures that might go unnoticed by basic health checks [6]. Additionally, adopting immutable infrastructure principles can improve reliability. Instead of patching failing components, replace them with new instances created from a known good image.
A real-world example of this approach comes from Amazon Web Services' 2022 Lambda update, led by Principal Engineer John O'Brien. By externalising state to DynamoDB and enforcing idempotent event handlers, they reduced duplicate event processing by 98% and maintained 99.99% uptime.
Finally, the Resilience Maturity Model (RML) provides a structured path to improvement. It ranges from RML-1 (manual restarts) to RML-5 (AI-assisted anomaly detection and continuous chaos testing) [16]. This roadmap helps organisations evolve their systems systematically, ensuring long-term reliability and efficiency.
Conclusion and Next Steps
Self-healing systems play a key role in scaling microservices, shifting the focus from reactive problem-solving to automated resilience. For organisations that adopt self-healing automation, the benefits are clear: faster incident response times and reduced pressure on engineering teams.
To build on the principles we've covered, visibility is critical. Services need to provide endpoints that confirm real functionality - like database connectivity or API responsiveness - rather than just checking if processes are running[2]. Establishing clear Service Level Objectives (SLOs) is equally important, as they act as benchmarks for your monitoring tools[3]. These practices form the backbone of confident automation, enabling early issue detection and creating a foundation for reliable automated responses.
Once you've established strong monitoring, implement automation with well-defined safeguards. Limit retry attempts, set timeouts, and define clear escalation paths to human intervention for scenarios where automation falls short[2][6]. Be cautious of auto-restart mechanisms, as they can obscure deeper problems[6]. Make sure every automated action is logged in detail to help uncover root causes behind recurring failures.
Start small, with straightforward solutions like automatic container restarts in Kubernetes. Gradually move towards more advanced patterns, such as circuit breakers or event-driven architectures. Test each step rigorously through chaos engineering to ensure your systems are ready for real-world challenges before they hit production[3][2]. By continuously refining your self-healing processes, you'll maintain strong performance and resilience over time.
FAQs
What should I automate first in a self-healing Kubernetes setup?
Start by automating thorough health checks to catch issues as early as possible. Prioritise checks at the application level, such as verifying HTTP responses, confirming database connections, and assessing the status of dependencies.
Once these health checks are established, implement automated responses to handle detected issues. This might include restarting containers, adjusting scaling, or rerouting traffic. These measures enable continuous monitoring and automated fixes, minimising downtime and limiting the need for manual intervention - key elements of a self-healing system.
How do I stop self-healing from hiding recurring root causes?
To ensure self-healing systems don't hide recurring root issues, make use of detailed monitoring and observability tools. These tools can log extensive failure data, making it easier to conduct thorough root cause analysis. Pair automated fixes with manual reviews for problems that occur often, ensuring they are completely resolved rather than just temporarily patched. Continuously refine diagnostic patterns and take lessons from past failures to tackle underlying issues, promoting ongoing improvement instead of depending too much on automation.
Which SLOs and alert thresholds work best for triggering safe auto-remediation?
The most effective SLOs and alert thresholds for safe auto-remediation focus on monitoring error rates, latency, resource utilisation, and failure counts. Establish thresholds that can catch anomalies early - like increasing error rates or latency exceeding acceptable levels. This allows automated responses such as retries, circuit breakers, or restarts to kick in, helping maintain system stability and reducing the impact on users.