
Kubernetes resource optimisation can cut cloud costs by up to 60%. At its core, rightsizing ensures your workloads have the right amount of CPU and memory - no more, no less. This avoids wasting resources while preventing performance issues like throttling or crashes.
Here’s what you need to know:
- Resource requests guarantee the minimum resources a container needs.
- Resource limits cap the maximum resources a container can use.
- Over-provisioning wastes money; under-provisioning risks instability.
- Tools like Prometheus, Grafana, and Vertical Pod Autoscaler (VPA) simplify monitoring and adjustments.
Kubernetes resource optimization: From manual tuning to AI-driven automation, with Andrew Hillier
Monitoring Kubernetes Resource Usage
Keeping a close eye on resource usage is critical for setting accurate requests and limits in Kubernetes. Without clear data, you're left guessing, which can lead to inefficiencies. Kubernetes provides two main ways to monitor resources: the resource metrics pipeline for real-time data and the full metrics pipeline for historical insights [6].
The Metrics Server is a key tool for real-time monitoring. It gathers CPU and memory metrics from Kubelets on each node and makes them available through the metrics.k8s.io API [6][8]. However, it doesn't store historical data, so it can't help with trend analysis.
To make well-informed rightsizing decisions, you need both real-time data and historical trends. While the kubectl top command gives a quick snapshot of current usage, tools like Prometheus and Grafana offer a deeper dive into patterns over time. Let’s walk through these tools.
Using kubectl for Real-Time Metrics
The kubectl top command is a quick and simple way to check resource usage across your cluster. It’s especially handy for spotting immediate issues.
If you want to see pod-level metrics in a specific namespace, you can run:
kubectl top pods --namespace=production
This shows current CPU usage (in millicores) and memory usage (in MiB) for all pods in the given namespace. To get an overview of resource usage at the node level across the cluster, use:
kubectl top nodes
While kubectl top is great for snapshots of current usage, it doesn’t provide any historical data. That’s where Prometheus and Grafana come in.
Monitoring with Prometheus and Grafana
For a more detailed and long-term view of resource usage, Prometheus and Grafana are the go-to tools. Prometheus collects time-series metrics by scraping data from the /metrics endpoints of Kubernetes components. These metrics are stored, enabling historical analysis at the node, pod, and container levels [6][7][8][3].
Grafana works alongside Prometheus to create visual dashboards from the raw data. These dashboards can be customised to show trends over time, helping you identify patterns like peak usage periods or consistent resource demands [6][8][3]. This kind of historical perspective is invaluable for rightsizing, as it reveals whether workloads have predictable spikes or steady consumption.
Additionally, kubelets expose detailed metrics through endpoints like /metrics/cadvisor. These include Pressure Stall Information (PSI), which measures CPU, memory, and I/O contention [7]. PSI metrics show how much time containers spend waiting for resources, which can highlight bottlenecks. By analysing these metrics in Grafana, you can fine-tune resource requests and limits based on actual workload behaviour, rather than relying on assumptions. This data-driven approach ensures better resource allocation and performance.
Setting Resource Requests and Limits
After gathering data about actual resource usage, the next step is to configure resource requests and limits in your Kubernetes manifests. Resource requests define the minimum CPU and memory a container needs, while resource limits cap the maximum amount it can consume [1][10][11]. These play a crucial role: the scheduler uses requests to place Pods on nodes with enough resources, and the kubelet enforces limits using Linux cgroups [1][10]. It's worth noting that exceeding CPU limits results in throttling, but surpassing memory limits can lead to OOM (Out of Memory) kills [1][11][12].
Getting this balance right is critical. If you under-provision, performance suffers, and OOM kills become more likely. On the other hand, over-provisioning wastes resources and increases costs [13]. CPU is measured in units like 250m (0.25 CPU), allowing you to specify fractional values [1][10]. For memory, you use byte units with suffixes like Mi (mebibytes) or Gi (gibibytes), such as 128Mi [1][10]. Use this information to fine-tune your manifests so resource allocation matches your workload needs.
Best Practices for Requests and Limits
When setting requests and limits, base your configuration on actual usage data. For requests, use the average observed usage, adding a small buffer to ensure stability. This helps ensure containers have the resources they need while aiding the scheduler in efficient Pod placement [10]. For limits, align them with the peak resource usage captured in your monitoring data. This prevents excessive throttling and shields your cluster from runaway resource consumption.
Since CPU throttling only slows down containers, you can afford slightly tighter CPU limits. However, memory limits require more caution - setting them too low can lead to pod terminations. For workloads with unpredictable memory patterns, start with conservative memory limits. Monitor usage over time (days or weeks) to capture realistic peaks, and adjust as necessary.
YAML Configuration Examples
Here’s a YAML example of a Pod manifest with resource requests and limits. This configuration requests 250 millicores (0.25 CPU) and 128Mi of memory, with limits set at 500 millicores and 256Mi:
apiVersion: v1
kind: Pod
metadata:
  name: example-pod
spec:
  containers:
  - name: app-container
    image: nginx:latest
    resources:
      requests:
        memory: "128Mi"
        cpu: "250m"
      limits:
        memory: "256Mi"
        cpu: "500m"
For production workloads requiring more resources, you might use something like this. Here, the container requests 1 CPU and 1Gi of memory, with limits set at 2 CPUs and 2Gi:
apiVersion: v1
kind: Pod
metadata:
  name: production-pod
spec:
  containers:
  - name: backend-service
    image: my-app:v2.1
    resources:
      requests:
        memory: "1Gi"
        cpu: "1000m"
      limits:
        memory: "2Gi"
        cpu: "2000m"
To apply these configurations, use the command: kubectl apply -f your-manifest.yaml. The scheduler will ensure Pods are placed on nodes that meet the resource requests, while the kubelet enforces limits to maintain cluster stability [1][10].
Need help optimizing your cloud costs?
Get expert advice on how to reduce your cloud expenses without sacrificing performance.
Automated Rightsizing Tools
::: @figure 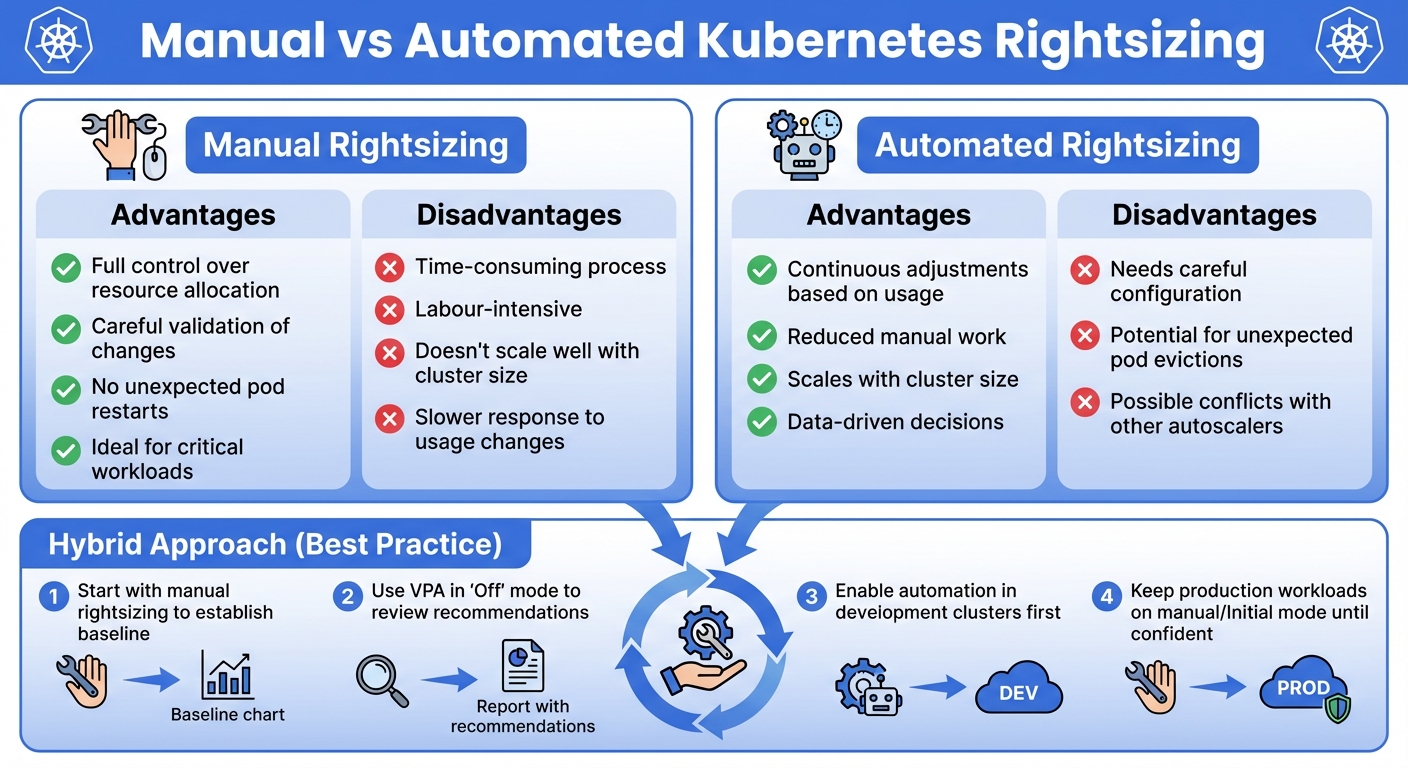 {Manual vs Automated Kubernetes Rightsizing: Advantages and Disadvantages Comparison}
:::
{Manual vs Automated Kubernetes Rightsizing: Advantages and Disadvantages Comparison}
:::
Accurate resource allocation is crucial, but managing it manually at scale can be exhausting. That’s where automated tools come in, simplifying the process and reducing manual effort. These tools monitor resource usage and adjust pod or node resources dynamically, ensuring your system stays efficient [15].
Two standout tools in this space are the Vertical Pod Autoscaler (VPA) and the Cluster Autoscaler (CA). VPA focuses on optimising pod resource requests and limits, while CA adjusts the number of nodes in your cluster. Together, they create a system that adapts to workload changes without constant human oversight.
Using Vertical Pod Autoscaler (VPA)
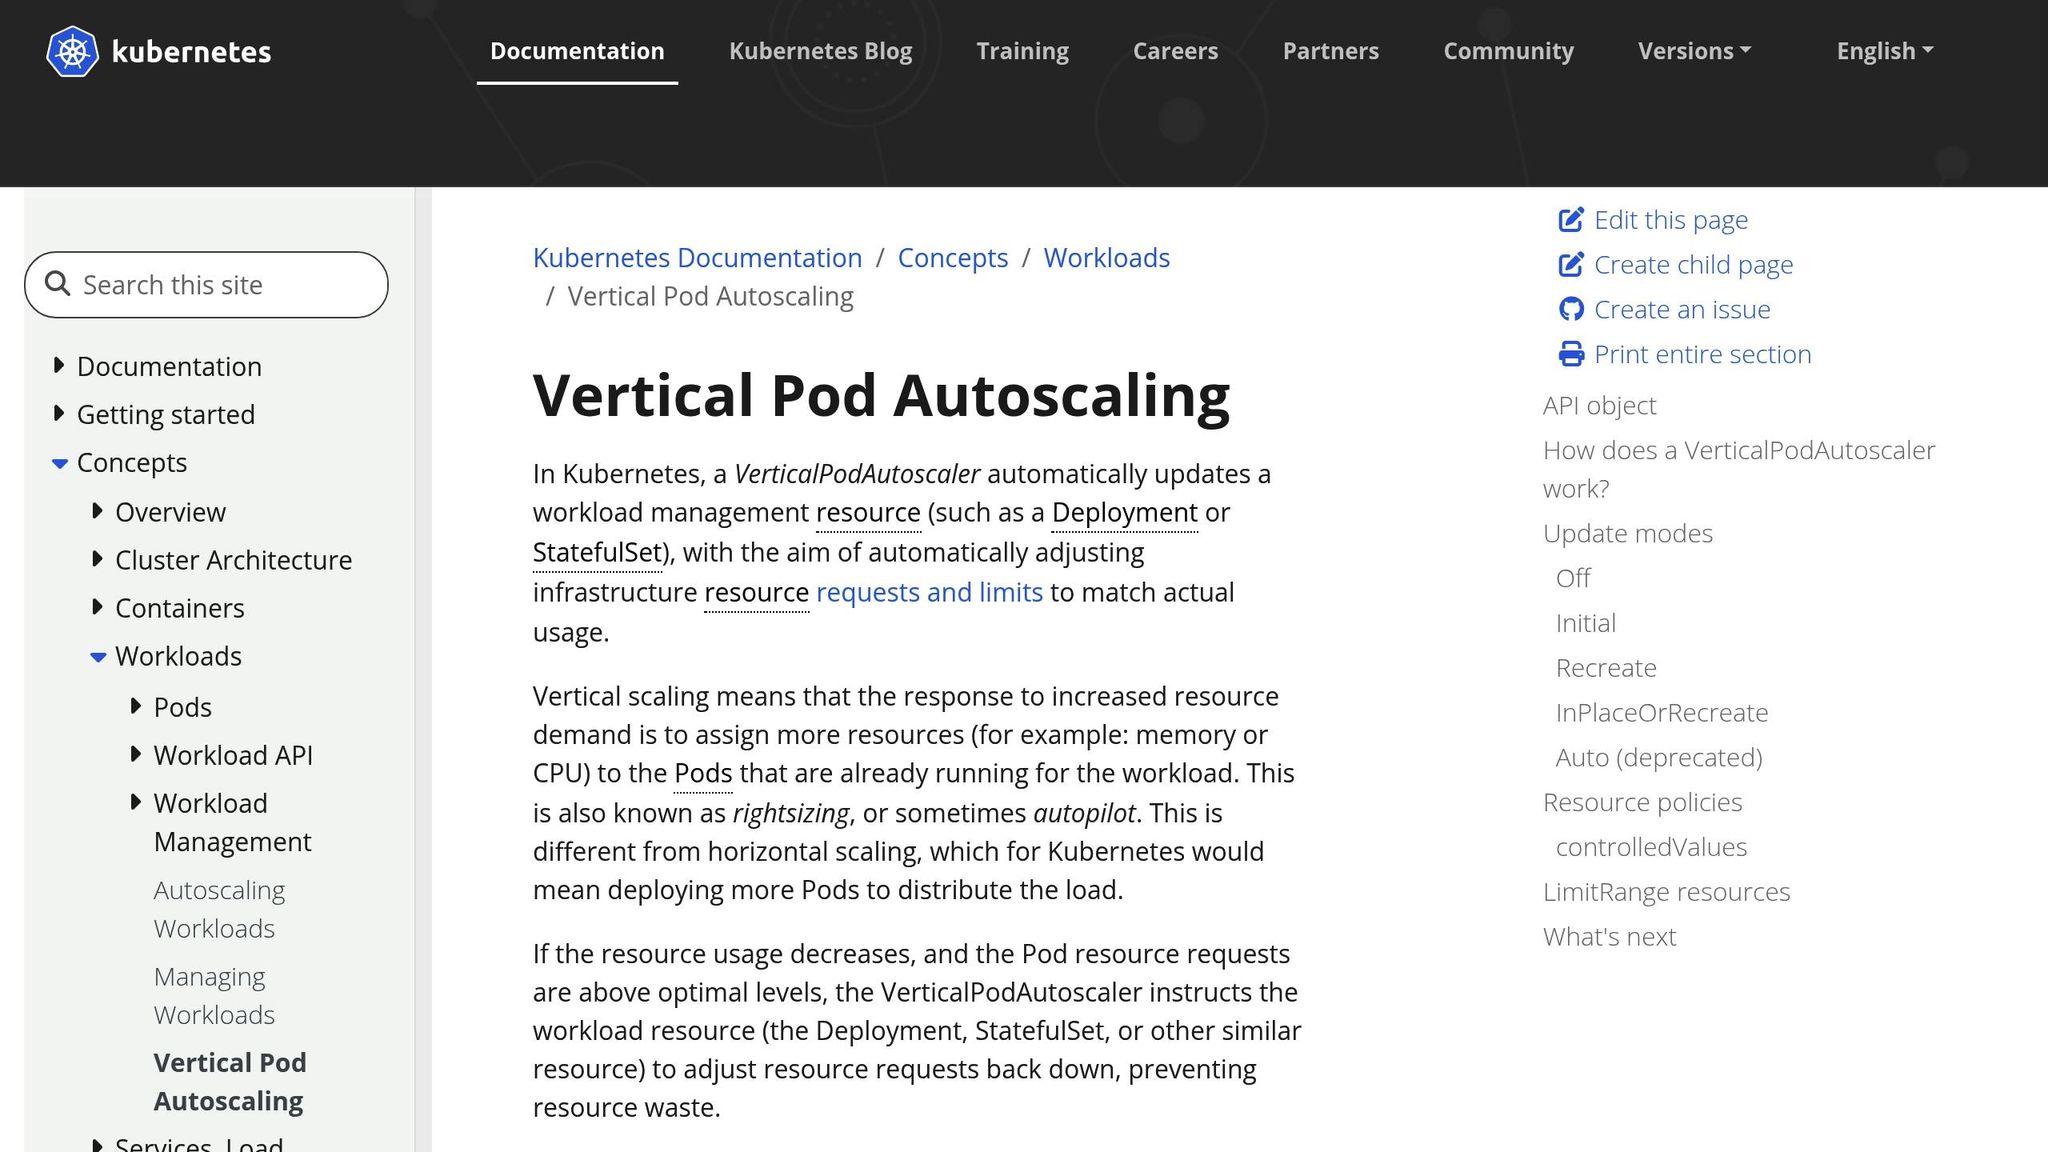
The VPA continuously tracks CPU and memory usage in your pods, offering updated recommendations for resource requests and limits [14][15]. Unlike horizontal scaling, which increases the number of pod replicas, VPA adjusts resource allocation within each pod. It has three key components:
- Recommender: Analyses historical data and suggests resource adjustments.
- Updater: Decides when to apply recommendations, often restarting pods to implement changes.
- Admission Controller: Injects recommended resources during pod creation [15].
VPA operates in different modes:
- Auto (Recreate) Mode: Evicts and restarts pods to apply changes.
- Initial Mode: Sets resource allocations at pod creation without further updates.
- Off Mode: Generates recommendations for review without automatically applying them.
- InPlaceOrRecreate Mode: (Available in Kubernetes 1.34.0-gke.2011000 and later) Updates resources in place when possible, falling back to Auto mode if required [14].
To start, use the Off mode to validate recommendations before automating. Avoid conflicts with the Horizontal Pod Autoscaler (HPA) by using HPA for CPU-based scaling and reserving VPA for memory requests. VPA works best for stable, long-running workloads. Keep the number of VerticalPodAutoscaler objects below 1,000 per cluster to avoid disruptions [14].
Here’s an example configuration for VPA:
apiVersion: autoscaling.k8s.io/v1
kind: VerticalPodAutoscaler
metadata:
  name: example-vpa
spec:
  targetRef:
    apiVersion: apps/v1
    kind: Deployment
    name: backend-service
  updatePolicy:
    updateMode: "Off"
  resourcePolicy:
    containerPolicies:
    - containerName: app-container
      minAllowed:
        cpu: 100m
        memory: 128Mi
      maxAllowed:
        cpu: 2000m
        memory: 2Gi
Next, let’s look at how the Cluster Autoscaler complements pod-level optimisation by managing nodes.
Cluster Autoscaler for Node Management
While VPA fine-tunes pod resources, the Cluster Autoscaler (CA) focuses on adjusting the cluster’s nodes. If pods can’t be scheduled due to insufficient resources, CA scales up by requesting additional nodes from your cloud provider. Conversely, when nodes are underused, CA triggers a scale-down, evicting pods and removing unused nodes to optimise costs [16][17].
CA respects Kubernetes constraints like PodDisruptionBudgets, taints, and tolerations to ensure workloads remain stable and are placed on compatible nodes [16][18]. However, it bases its decisions on pod resource requests rather than real-time usage, which can lead to over-provisioning if requests aren’t accurate [3]. Combining CA with VPA can help align resource requests with actual usage while maintaining the right number of nodes [15][17].
For best results:
- Define accurate resource requests for pods.
- Use multiple node groups for cost efficiency and flexibility.
- Configure Pod Disruption Budgets to minimise disruptions during scale-down.
- Consolidate resources into larger node groups for better bin-packing and lower costs [18].
Together, VPA and CA provide a scalable and efficient approach to rightsizing, but how do they compare to manual methods?
Manual vs Automated Rightsizing
Each approach has its strengths and weaknesses, and the right choice often depends on your specific needs.
| Approach | Advantages | Disadvantages |
|---|---|---|
| Manual | Full control, careful validation, no unexpected restarts, ideal for critical workloads | Time-consuming, labour-intensive, doesn’t scale well, slower response to usage changes |
| Automated | Continuous adjustments, reduced manual work, scales with cluster size, data-driven | Needs careful configuration, potential for unexpected evictions, conflicts with other autoscalers |
A hybrid approach often works best. Start with manual rightsizing to establish a baseline and understand your workloads. Then, gradually introduce automation in less critical environments. For instance, you could use VPA in Off mode to review recommendations initially, enabling Auto mode for development clusters while keeping production workloads on manual or Initial mode until you’re confident in the automation [15].
Best Practices for Kubernetes Rightsizing
Rightsizing isn’t something you do once and forget about. Workloads change, traffic patterns fluctuate, and applications evolve. Over time, even a well-optimised Kubernetes cluster can become inefficient. As Debo Ray, Co-Founder and CEO of DevZero, explains:
Kubernetes does almost nothing to prevent waste on its own. Even healthy clusters drift toward inefficiency unless you constantly correct for it [24].
To stay efficient, you need a repeatable process that aligns resource allocations with actual usage. This involves collecting meaningful data, testing changes carefully, and enforcing policies to prevent resource sprawl. Continuous monitoring and regular adjustments are crucial to keep up with workload changes. Start by gathering baseline data to guide your decisions.
Collect and Analyse Baseline Data
Understanding your workloads begins with gathering detailed metrics during both peak and off-peak times. Make sure the Metrics Server is active, and then monitor baseline, peak, and idle usage. For deeper insights, use tools like Prometheus and Grafana, which can be set up via the Kube-Prometheus Stack with Helm [5][4].
Focus on three key usage patterns:
- Baseline usage: The minimum resources your pods consistently need.
- Peak usage: The maximum resources used during traffic spikes.
- Idle usage: Resources consumed when activity is low.
Pay attention to containers without CPU or memory limits that consume excessive resources - they can destabilise nodes [2]. Also, identify containers that consistently use more than 80% of their limits, as they risk throttling or running out of memory [2].
In June 2021, Sysdig shared PromQL queries to spot inefficiencies. For instance, to find the top 10 containers without CPU limits but using the most CPU:
topk(10,sum by (namespace,pod,container)(rate(container_cpu_usage_seconds_total{container!="
}\[5m\])) unless sum by (namespace,pod,container)(kube\_pod\_container\_resource\_limits{resource=cpu"}))
To detect containers nearing their memory limits:
(sum by (namespace,pod,container)(container_memory_usage_bytes{container!="
}) / sum by (namespace,pod,container)(kube\_pod\_container\_resource\_limits{resource=memory"})) > 0.8 [2]
Tools like kube-capacity provide detailed consumption data, while Goldilocks uses Vertical Pod Autoscaler (VPA) recommendations to suggest optimal settings. To enable Goldilocks for a namespace, use:
kubectl annotate namespace your-namespace goldilocks.fairwinds.com/enabled=true [4].
Regular profiling ensures your resource settings remain accurate as workloads evolve [5][4].
Test and Adjust Resource Settings
Once you’ve collected baseline data, adjust resource settings based on performance monitoring. Start with conservative resource requests - based on average usage - and set limits slightly above peak consumption [5]. Fine-tune these settings through iterative adjustments, using load testing tools like k6, JMeter, or Locust to simulate traffic [5][3]. Profiling tools like Jaeger or Zipkin can help identify resource-heavy sections of your code [3].
Kubernetes v1.35 introduced In-Place Pod Resizing, allowing resource adjustments without restarting pods. Use commands like kubectl patch or kubectl edit --subresource resize to make changes with minimal disruption [9][21]. This feature has made VPA a critical tool for saving costs and reducing inefficiencies [20].
For example, one organisation cut Out-of-Memory (OOM) errors by 80% and improved cost efficiency by 20% through systematic resource adjustments [5]. The trick is to balance performance and cost - avoiding both overprovisioning (wasting resources) and underprovisioning (causing throttling or memory errors) [5][3]. To set limits, you can either use the maximum observed consumption (more cautious) or the 99th percentile (more aggressive) [2].
Enforce Cluster-Wide Resource Policies
To maintain efficiency, enforce resource policies across your cluster. Tools like LimitRange, ResourceQuota, and Pod Disruption Budgets help keep workloads stable [22][3].
- LimitRange: Sets minimum and maximum CPU/memory allocations for pods and containers, along with default requests and limits [22][23][3].
- ResourceQuota: Defines aggregate resource limits and object counts (e.g., number of pods or services) within a namespace [22][3].
Apply these policies consistently to prevent any team from monopolising cluster resources. Use Quality of Service (QoS) classes to prioritise critical workloads while managing non-critical ones flexibly [3]. Node selectors, affinity rules, and pod priority can help place workloads on the right nodes [3][24].
Educate developers on setting appropriate resource requests and limits, as policy enforcement works best when paired with organisational awareness [3]. Poor resource configuration can lead to cluster utilisation rates as low as 30% [20], so consistent policies are key. Regularly review and update these policies to adapt to changing workloads and maintain optimal resource allocation.
Conclusion
Balancing cost and performance in Kubernetes requires ongoing attention to resource allocation. Even well-optimised clusters can drift towards inefficiency over time, leading to wasted resources and rising costs. To avoid this, it’s essential to regularly monitor usage, fine-tune requests and limits, leverage tools like the Vertical Pod Autoscaler, and enforce clear cluster policies.
The process of accurately estimating resource needs, identifying workloads that need adjustment, and automating continuous optimisation is no small feat [25]. However, proper rightsizing eliminates overprovisioning - where you pay for unused infrastructure - and avoids under-provisioning, which risks performance issues and potential outages [2] [19]. By maximising resource utilisation, Kubernetes clusters can achieve better operational performance while keeping costs in check [25]. Techniques like node autoscaling and consolidation dynamically adapt to fluctuating demand, ensuring all pods are efficiently scheduled without inflating expenses [17]. Remember, rightsizing isn’t a one-and-done task; it’s an ongoing process.
For those who find Kubernetes optimisation daunting, professional support can make a significant difference. Hokstad Consulting specialises in reducing cloud costs by 30–50% through strategic resource allocation and automation. With deep expertise in Kubernetes, cloud migration, and tailored automation solutions, they help align resource usage with actual demand.
Expert guidance not only simplifies the optimisation process but also delivers tangible savings while maintaining top-tier application performance.
FAQs
How do Prometheus and Grafana help monitor Kubernetes resources effectively?
Prometheus gathers comprehensive metrics from Kubernetes, covering areas like CPU, memory, and storage usage, along with custom application-specific signals. These metrics offer a clear view of resource consumption and system performance.
Grafana takes this data and transforms it into real-time dashboards, offering an intuitive way to spot bottlenecks, anticipate problems, and fine-tune resource requests and limits. When used together, these tools help teams strike the right balance between performance and cost, ensuring Kubernetes environments remain stable and efficient.
What are the advantages of using the Vertical Pod Autoscaler in Kubernetes?
The Vertical Pod Autoscaler (VPA) automatically tunes a pod's CPU and memory requests and limits based on real usage. This ensures your applications get the resources they need, improving performance while avoiding over-provisioning and cutting down on unnecessary cloud expenses.
With its ability to automate resource adjustments, the VPA streamlines resource management, reduces operational complexity, and keeps your applications running efficiently - all without requiring manual intervention. It's an essential tool for maintaining a balance between performance and cost in Kubernetes setups.
What’s the difference between manual and automated rightsizing in Kubernetes?
Manual rightsizing requires engineers to analyse historical CPU and memory usage data to fine-tune pod resource requests and limits. While this method can help avoid over-provisioning or throttling, it has its downsides. It’s labour-intensive, susceptible to mistakes, and becomes increasingly challenging to manage as workloads grow. Each adjustment demands careful identification, testing, and manual implementation - a process that can be both tedious and slow.
Automated rightsizing offers a smarter alternative. By leveraging telemetry data and predefined optimisation policies, it dynamically updates resource settings without human intervention. This not only saves time but also minimises the chance of errors and adapts swiftly to fluctuating workload requirements. The result? Consistent efficiency and performance on a larger scale, making it a practical choice for expanding Kubernetes environments.