
Most managed search clusters cost too much or run too hot because the setup no longer matches the workload. If I had to cut this down to the main point, it would be this: keep shard sizes around 10–50 GB, keep replica counts tied to actual failure needs, move old data off hot storage fast, and review cost plus performance on a fixed schedule.
If you run Elasticsearch or OpenSearch in AWS, Azure, or Elastic Cloud, I’d look at four things first:
- Shard count and shard size: too many small shards waste heap; very large shards slow recovery
- Replicas: more replicas mean more storage, more indexing work, and more £ per month
- Retention and tiering: old data left on hot nodes keeps bills climbing
- Scaling rules: scaling on CPU alone often adds nodes without fixing slow queries
A few numbers matter straight away:
- Elastic suggests 10–50 GB per shard
- AWS points to no more than 25 shards per GiB of Java heap
- Heap use sustained above 75% is a warning sign
- A rollback trigger such as p95 latency up more than 20% helps stop bad changes from lingering
My short take: if search is slowing down, ingestion is lagging, cluster health is turning yellow or red, or spend in £/month keeps climbing without matching growth in traffic or data, the cluster likely needs re-sizing rather than another blind scale-up.
This piece is about trimming waste, keeping recovery times under control, and making sure your search estate stays fast enough without paying for node capacity you do not need.
Elasticsearch Performance and Cost Efficiency in Production Webinar

Need help optimizing your cloud costs?
Get expert advice on how to reduce your cloud expenses without sacrificing performance.
Common problems in mis-sized Elasticsearch and OpenSearch clusters

Mis-sized clusters tend to go wrong quietly at first. Then the symptoms show up: slower queries, shaky cluster health, and storage bills that keep creeping up. In most cases, the root cause comes down to three things: too many shards, shards that are too large, and data staying online far longer than it should.
Too many small shards and too many indices
Over-sharding is one of the most common production problems, especially in log and metrics setups. It usually happens when teams create daily indices with multiple primary shards for low-volume services, or when time-series data is split across far more indices than the workload needs.
Each open shard uses about 1–2 MB of JVM heap for cluster-state overhead [3]. That may not sound like much, but at scale it adds up fast. Thousands of tiny shards burn memory and slow cluster-state updates. Elastic’s own production guidance says master nodes should stay below 3,000 indices per GB of heap [1]. A lot of clusters drift past that line without anyone noticing.
Heap use is only part of the problem. The cluster state grows with every index and mapping, and master nodes have to load that state and pass it to every other node. Once it gets bloated, normal admin work starts dragging: index creation slows, mapping updates lag, and rolling upgrades get more risky. Teams often spot the issue only when a routine change tips the cluster into yellow or red.
AWS OpenSearch Service documentation calls out over-sharding as a direct cost problem. It recommends no more than 25 shards per GiB of Java heap and no more than 1,000 shards per data node [5]. Go past those limits and the cluster starts spending money on metadata overhead instead of search work.
Oversized shards, node pressure, and slow recovery
The opposite problem is oversized shards. These make recovery and rebalancing much slower. When shards get too big - especially past the practical 10–50 GB range - a node failure that should clear in minutes can leave the cluster in a yellow or red state for hours. Why? Because each shard move means shifting a large amount of data over the network.
That recovery window matters. During it, the cluster has less redundancy. If another failure hits before recovery finishes, the chance of data loss goes up. Incidents tied to oversized shards often show the same pattern: high disk I/O, heavy network traffic, and read latency spikes at exactly the worst moment, such as peak traffic or a maintenance window.
Elastic’s guidance is plain: aim for shard sizes between 10 GB and 50 GB [1]. That range helps keep recovery measured in minutes instead of hours, keeps Lucene’s internal structures under control, and reduces segment-merge contention that can drag down queries during busy periods.
Unnecessary replicas, weak retention, and poor storage tiering
Even when shard counts look fine, costs can still climb if replicas and old data are left untouched. Replica settings often get picked once and then ignored. But every extra replica duplicates storage, adds indexing CPU load, and increases the total shard count. That feeds straight back into the heap and cluster-state issues above.
Extra replicas and retained data also push up node, storage, and snapshot costs. Managed Elasticsearch and OpenSearch services charge per node instance and per GB of storage. Double the replicas on large log indices and you roughly double storage use. If retention rules are weak, the bill keeps stacking up. Indices that should have been deleted after their required retention period just sit there, quietly filling hot-tier storage. Unpruned snapshots add another layer of object-storage cost.
Poor storage tiering makes all of this worse. Many managed clusters leave older data on costly hot storage unless lifecycle and tiering policies are set up on purpose. Moving older data to warm or cold tiers - or deleting it when it no longer needs to be kept - can cut the effective cost per GB by a lot. But that only happens if those policies exist. Without them, the invoice grows faster than the workload.
How to right-size shards, nodes, and data lifecycle
::: @figure 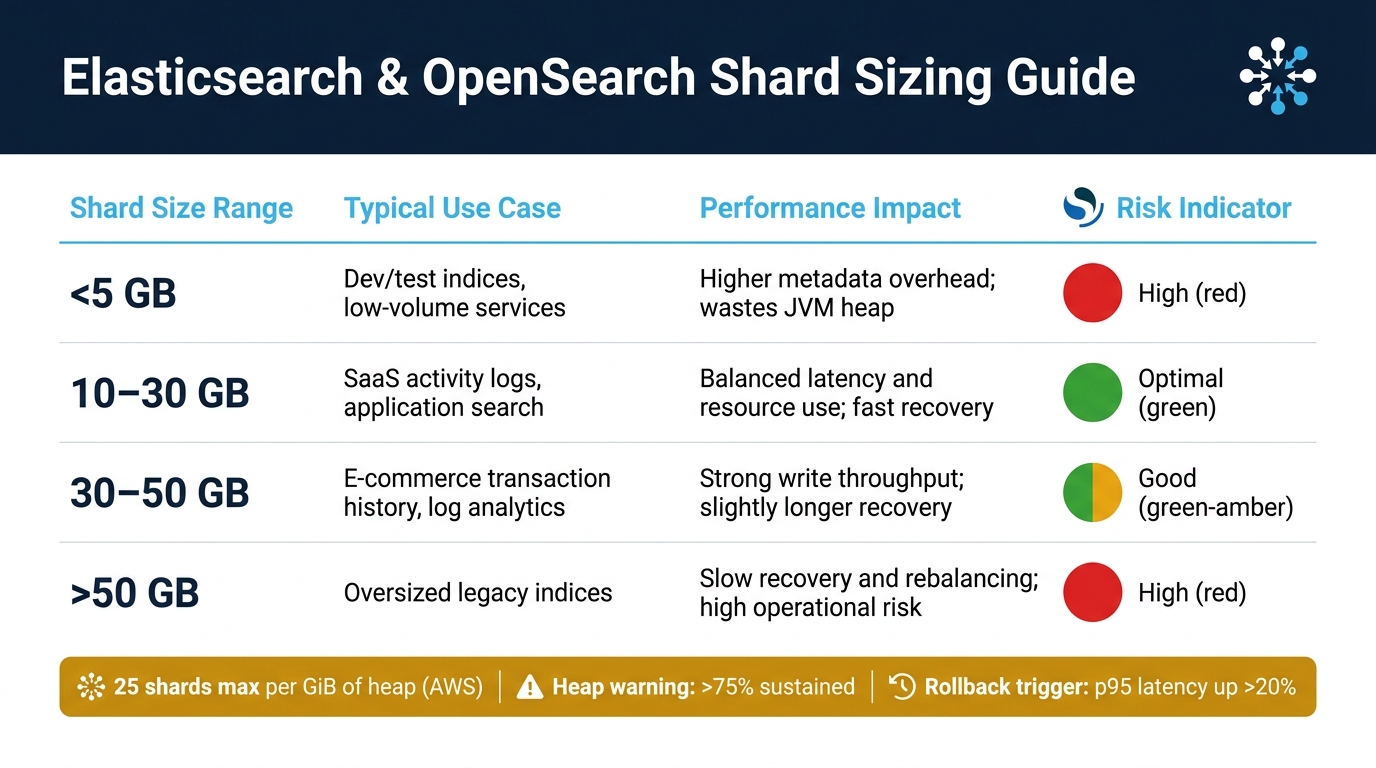 {Elasticsearch & OpenSearch Right-Sizing: Shard Size Guide}
:::
{Elasticsearch & OpenSearch Right-Sizing: Shard Size Guide}
:::
Set shard targets from data volume and query patterns
Once you've spotted shard sprawl and oversized indices, the next step is to turn workload volume into a shard target. The goal isn't to land on some magic shard count. It's to run a cluster that stays fast, recoverable, and affordable.
Start with three inputs:
- daily ingest
- retention window
- target shard size
Then do the maths. Multiply daily ingest by the retention window, then divide by your target shard size. For example, 50 GB/day over 7 days gives you 350 GB. At 25 GB per shard, that works out to about 14 primary shards. If rounding to a neat number makes day-to-day operations easier, that's fine. Just test it under realistic load before you send it to production.
| Shard Size Range | Typical Use Case | Performance Impact |
|---|---|---|
| <5 GB | Dev/test indices, low-volume services | Higher than needed because small shards increase metadata overhead |
| 10–30 GB | UK SaaS user activity logs, application search | Balanced latency and resource use; manageable recovery |
| 30–50 GB | E-commerce transaction history, log analytics | Strong write throughput; slightly longer recovery |
| >50 GB | Oversized legacy indices | Slower recovery and rebalancing; higher operational risk |
Benchmark changes before production rollout.
Use rollover and lifecycle policies to control index growth
Once shard sizing is in a good place, keep index growth in check with rollover instead of fixed calendar-based indices.
Date-based indices with fixed shard layouts tend to swell over time. Elasticsearch ILM and OpenSearch's equivalent both support max_primary_shard_size as a rollover condition. Set it to 50 GB, and the index rolls when it's full, not just because the date changed. [6][4] Add a max_age condition, such as 30 days, and you get a safety net for low-volume indices that might otherwise stay open for far too long.
Retention policy is also a direct cost lever. It shouldn't be treated like back-office housekeeping. A sensible tiering setup might keep the last 14 days in the hot tier, move older data to warm storage, then to cold or archived storage, and delete it when the retention period ends. That keeps costly hot-tier nodes lean while still meeting compliance needs. [4][7]
Match node roles and replica counts to real resilience needs
When shard growth is under control, you can line up node roles and replica counts with the workload you actually have and the resilience level you actually need. That's the key point. Node roles shape whether you're paying for query speed, ingest throughput, or capacity that mostly sits there doing nothing.
For ingest-heavy workloads, use fast storage and more CPU. For query-heavy workloads, lean towards larger heaps and read-optimised storage. In both cases, dedicated master nodes should have modest, steady resources and should never share roles with busy data nodes.
Replica counts need the same hard look. One replica fits most production workloads. It handles a single node failure and adds parallel read capacity. A second replica pushes up storage and indexing costs by a large margin. Add more replicas only when you need extra throughput or you have a clear requirement to survive two failures.
Performance tuning and scaling in managed search services
With shard counts and retention under control, the next place to cut spend is mapping, query, and allocation efficiency.
Cut waste in mappings, indexing, and queries
After shard and lifecycle tuning, the next step is to strip out waste from mappings and queries. For many teams, this is where a lot of avoidable cost hides.
The biggest gain usually comes from switching fields from text to keyword when you only use them for filtering or aggregations, not full-text search. If a field is filter-only, remap it to keyword. And if you never search a field at all, set index: false. It also helps to keep total field counts well below the 1,000-field limit. [8][9]
Query design matters just as much. For deep pagination, use search_after with PIT instead of large offsets, because large offsets burn CPU for no good reason. Elastic recommends search_after with PIT once result sets go beyond 10,000 hits. [10][11] Teams that make this change often see p95 latency fall by 30–60%, which can remove the need to move to larger nodes.
Prevent hotspots with allocation awareness and monitoring
Even well-tuned queries can slow down if shards end up in the wrong places. Shard allocation awareness uses node attributes such as availability zone or rack so that primary and replica shards sit in separate failure domains. Without that setup, one zone outage can take an index offline, and one overloaded node can push p95 latency to 2–3× the cluster average. [13]
Before and after any tuning change, track a small set of baselines:
- Shard distribution across nodes
- Heap utilisation, with anything sustained above 75% treated as a warning
- GC pause times, where p95 pauses above 200–300 ms point to trouble
- Indexing throughput in docs per second
- p95 search latency
Use a simple rollback rule too: roll back if p95 latency rises by more than 20% or heap stays above 80% for 15 minutes. [13][14][15]
Choose vertical or horizontal scaling with clear cost limits
When tuning stops creating headroom, scale only enough to remove the SLA bottleneck.
Scale up when queries are CPU-heavy and packed with aggregations. Scale out when the main problem is high concurrency and you need to spread search and indexing across more nodes. Vertical scaling can cut per-query latency straight away, but a single-node failure hurts more. Horizontal scaling handles concurrency better, but it brings more shard management and rebalancing work.
| Scaling Type | Impact on Latency | Operational Complexity | Cost Behaviour (£/month) |
|---|---|---|---|
| Vertical (Scale Up) | Often lowers p95 for heavy queries; single-node failure has a larger impact | Medium - fewer nodes, but heap and GC tuning becomes more critical | Larger jumps when moving instance tiers |
| Horizontal (Scale Out) | Better for high concurrency; spreads load across more nodes | Higher - more nodes, more shard routing and rebalancing to manage | More gradual increases as nodes are added |
Whichever path you choose, tie autoscaling limits to SLA metrics, not raw utilisation on its own. For example, a rule that triggers scale-out when p95 latency for a key query stays above 300 ms for five straight minutes - and only when CPU is also above 70% - is much more precise than one that reacts to a CPU spike by itself. Set a hard ceiling on node count or monthly spend, and use cool-down periods so the cluster doesn't bounce up and down. [12]
Keeping clusters right-sized over time
Once shard size, node mix and retention are tuned, you still need to keep an eye on them. Right-sizing isn't a one-off job. Workloads shift, retention rules change, and a cluster that looked fine six months ago can drift out of line without much warning.
Review capacity, retention, and cost on a fixed schedule
For busy, fast-growing clusters, a monthly review makes sense. For steadier workloads, quarterly is often enough. The key is to check the same measures each time and compare them with the last review: ingestion rates, total shard count and average shard size, per-node disk use, heap pressure and GC behaviour, and p95 search latency. Watch whether shard count, shard size, node count and cost are moving towards the ranges you want.
If you spot drift, make changes in small, controlled steps. That's usually the safest way to avoid turning a minor issue into a production problem.
Apply changes safely in production
Shard reallocation, index shrink, and node class changes all bring risk in a live cluster. Handle them as controlled changes, not routine admin work.
Plan the work for agreed low-traffic windows and make sure on-call cover is in place. For index shrink, mark the source index read-only first, then shrink only indices that no longer receive writes. Keep concurrent relocations low so you don't swamp I/O or heap. If you're changing node classes, add one or two new nodes first, move a small set of shards across with allocation filters, and watch performance before you go further. It also helps to have a clear rollback path before you start: know which allocation settings to undo, or which snapshot to restore, if stability slips.
Before rolling out a new shard strategy or an updated lifecycle policy across the board, test it with data volumes that match production and query loads that reflect peak traffic. Set clear pass/fail criteria up front. For example:
- p95 latency must stay below a defined threshold
- CPU and heap use must stay within agreed limits
Only move changes into production when those checks are met.
Key takeaways and when to bring in specialist help
The main actions are pretty simple: keep shard sizes in the 10–50 GB range, automate lifecycle policies so rollover and tiering happen without manual work, match replica counts and node roles to your actual resilience needs instead of sticking with defaults, and review cost and performance together on a fixed schedule rather than as two separate topics. [2][1]
For many teams, that work is manageable in-house once the basics are set up. But if the same issues keep coming back, outside help can save a lot of time and waste. That tends to be the case when clusters are large and business-critical, when data growth is fast or retention rules add extra complexity, or when managed search costs keep climbing and no one can explain why. Hokstad Consulting helps analyse Elasticsearch and OpenSearch estates, automate right-sizing, and build repeatable cost-control processes.
FAQs
How do I know if my cluster is over-sharded?
An over-sharded cluster has too many small shards. That creates extra overhead, eats up memory, and drags down performance.
You’ll usually spot it when the shard count doesn’t match the heap memory available or the total amount of data in the cluster. Other common signs are high CPU or memory use even when query volume is low, and slow recovery after a restart or failure.
Regular checks of shard distribution and memory allocation help keep the cluster efficient.
When should I scale up instead of out?
Choose vertical scaling when your workload is steady and easy to predict. In that case, making an existing instance bigger is often simpler to run and manage.
Use horizontal scaling when demand goes up and down more often. Whatever route you take, base the decision on steady performance metrics collected over time.
How often should I review cluster sizing?
Right-sizing isn’t a one-off task. It’s something you revisit over time.
To get a clear picture, review performance and usage metrics like CPU, RAM and storage over 14 to 30 days. That gives you enough data to spot daily peaks, weekly patterns and seasonal shifts instead of judging demand from a short snapshot.
Before you commit to long-term capacity, use a 90-day review period to set a dependable baseline. From there, regular reviews, continuous monitoring and automated alerts make it easier to adjust as demand shifts.