Real-time monitoring transforms CI/CD pipelines into efficient, reliable systems by catching issues early, speeding up resolutions, and improving deployment success rates. Without monitoring, teams face delays, higher failure rates, and prolonged troubleshooting.
Key benefits include:
- Faster issue detection: Automated alerts and tools like flame graphs pinpoint problems in minutes.
- Improved reliability: Monitoring ensures stable deployments with strategies like canary and blue-green deployments.
- Enhanced productivity: Developers save time with better visibility and automated workflows.
Popular tools like Prometheus, Grafana, and OpenTelemetry provide the foundation for effective monitoring. For tailored solutions, Hokstad Consulting offers services like custom dashboards, automated remediation, and GDPR-compliant setups for UK organisations.
Monitored pipelines outperform unmonitored ones, achieving daily deployments, lower failure rates, and faster recovery times. Real-time monitoring is essential for keeping CI/CD pipelines efficient and dependable.
How Real-Time Monitoring Improves CI/CD Pipelines
Faster Issue Detection and Resolution
Real-time monitoring ensures teams are alerted instantly through tools like Slack, email, or webhooks, cutting down the time spent manually tracking failures. Instead of sifting through logs, teams can rely on distributed tracing and flame graphs to pinpoint the exact job or microservice causing a bottleneck. These tools map out the entire execution path, making it easier to identify and address issues.
Another helpful strategy is the use of dial tone
jobs - simple automated tasks, such as hello world
scripts, that run every few minutes to confirm whether failures are due to code changes or infrastructure problems. This approach saves precious troubleshooting time.
Fail-fast mechanisms, like pre-commit hooks and static code analysis, also play a vital role. They catch syntax errors and vulnerabilities before code even makes it into the repository. By identifying problems early, teams can prevent costly delays and ensure smoother operations.
More Reliable Deployments
Keeping an eye on infrastructure metrics like CPU usage and network latency helps flag potential resource issues before they disrupt deployments. Establishing baselines for build duration and success rates allows teams to quickly spot regressions and address them.
High-performing teams often maintain change failure rates below 15% [1]. Real-time monitoring also enables advanced deployment strategies such as canary and blue-green deployments. These methods allow teams to test changes on a smaller scale before rolling them out widely. If telemetry data signals a drop in application health, automatic rollbacks can be triggered, safeguarding the deployment process. Automated workflows can even scale resources or revert problematic changes without requiring manual input, ensuring releases remain consistent and dependable.
Better Developer Productivity
Beyond faster issue detection and reliable deployments, real-time monitoring has a significant impact on developer efficiency. By providing immediate insights, it removes the guesswork from troubleshooting, helping developers quickly differentiate between code bugs and external issues like CI provider outages. It also correlates pipeline metrics with application performance, offering a clearer picture of what’s happening.
With improved visibility, teams can reduce their reliance on quick fixes and manual workarounds, which often lead to technical debt. This is especially beneficial for teams working towards frequent deployment goals - whether daily or even hourly [1]. Standardised retry mechanisms further streamline development by tracking success rates based on exit codes, helping to distinguish between temporary issues like flaky tests and persistent failures that require intervention. All of this contributes to a smoother and more efficient development process.
Tools for Real-Time Monitoring in CI/CD
Common Monitoring Tools and What They Do
Monitoring tools play a key role in managing CI/CD pipelines effectively. Prometheus is a standout open-source tool for collecting metrics. It uses a pull-based model and a multi-dimensional data structure, which allows teams to query data using PromQL. This pull-based approach enables precise control over the metrics collected, making it a reliable choice for real-time monitoring [6].
To complement Prometheus, Grafana steps in by offering integration that allows teams to build version-controlled dashboards using JSON or YAML. For those seeking a more comprehensive solution, Datadog provides end-to-end visibility. It uses flame graphs to visualise pipeline executions, making it easier to spot high-latency tasks or problematic spans in the pipeline [2][3].
Another essential tool is OpenTelemetry (OTEL), which standardises the collection of logs, metrics, and traces across different environments [5]. For Kubernetes users, the Argo Suite is invaluable. It supports GitOps delivery, orchestrates parallel jobs, and facilitates advanced deployment strategies like canary and blue-green deployments [3].
While these tools cover a wide range of needs, custom solutions can further refine monitoring to meet unique pipeline requirements.
Custom Monitoring Solutions with Hokstad Consulting
Customised monitoring strategies, when paired with proven tools, can elevate observability into a powerful asset. Hokstad Consulting specialises in crafting these tailored solutions by starting with a detailed evaluation of an organisation's CI/CD architecture, deployment patterns, and business goals. This ensures that monitoring tools are aligned with the specific technology stack in use.
One of their standout approaches is Observability as Code (OaC), which involves managing monitoring configurations as version-controlled code. This ensures that observability evolves alongside infrastructure changes and remains consistent across development, staging, and production environments. For example, they create bespoke Grafana dashboards focused on key performance indicators, tailored to meet UK standards. For UK-based organisations, compliance with GDPR is a critical element, ensuring secure data storage, encryption, and data residency within the UK.
Hokstad Consulting also goes beyond monitoring by implementing automated remediation systems. These systems can trigger workflows such as automatic rollbacks for failed deployments or auto-scaling to address resource bottlenecks. Their expertise spans platforms like Datadog, Splunk, Prometheus, and Grafana, and they use frameworks like OpenTelemetry to ensure consistent data collection across multi-cloud or hybrid environments. This proactive approach helps teams move from simply reacting to issues to managing them proactively, all while incorporating cloud cost management to optimise resource usage and budgets efficiently.
How Do You Monitor CI/CD Pipeline Performance Effectively? - Next LVL Programming
Need help optimizing your cloud costs?
Get expert advice on how to reduce your cloud expenses without sacrificing performance.
How to Add Real-Time Monitoring to Your CI/CD Pipeline
::: @figure 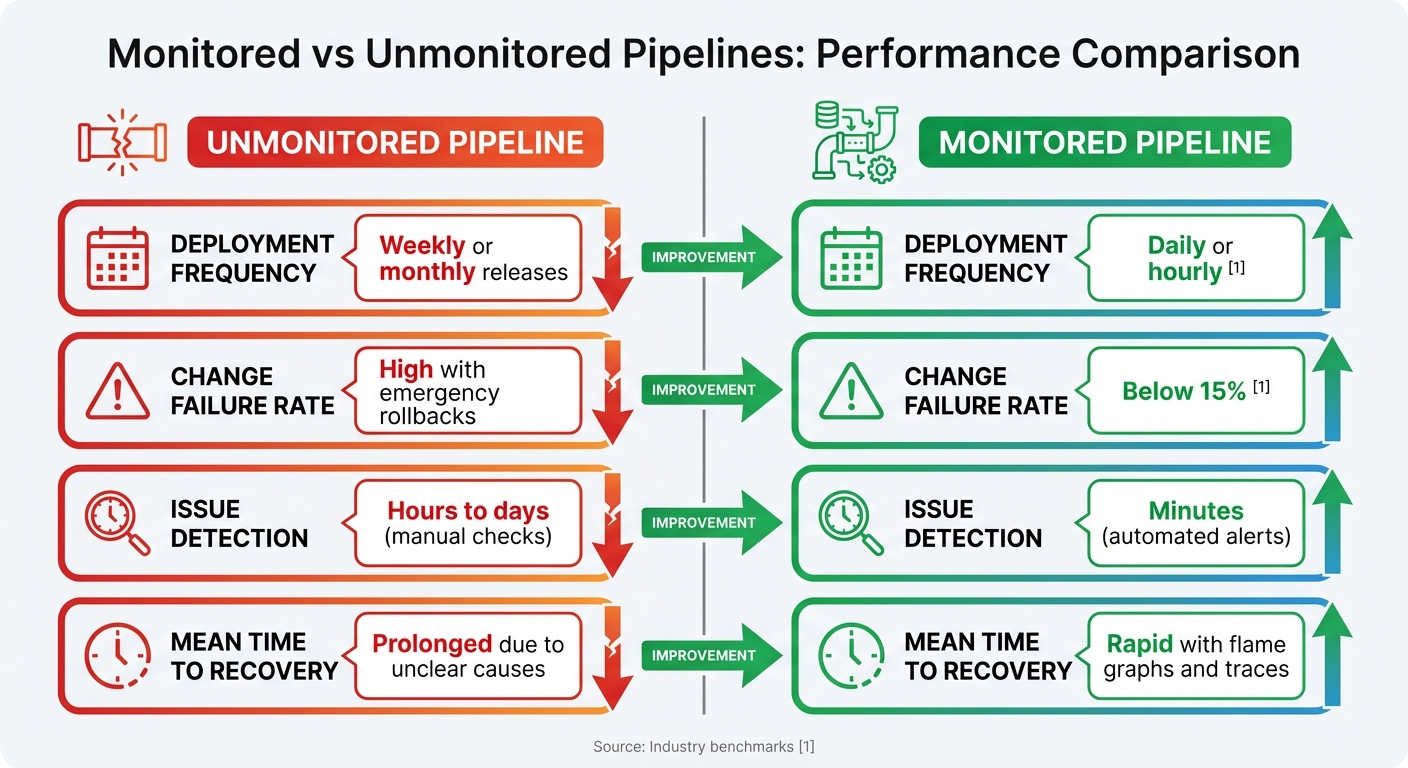 {Monitored vs Unmonitored CI/CD Pipelines Performance Comparison}
:::
{Monitored vs Unmonitored CI/CD Pipelines Performance Comparison}
:::
Real-time monitoring can significantly enhance your CI/CD pipeline by identifying bottlenecks and improving efficiency. Here's a practical guide to integrating these practices into your pipeline.
Step-by-Step Integration Guide
Start by profiling queue wait times and checkout durations - these metrics often pinpoint quick wins for optimising performance [4]. While they may seem minor, they frequently highlight bottlenecks that are easy to address. To get started, establish baseline data and set up detailed alerts for every level of your pipeline, including stages and individual commands. Use tags (like team names or service IDs) to ensure alerts are routed to the correct Slack or Microsoft Teams channels [7][2].
Incorporate periodic hello world
probes to test the health of your CI/CD system and supporting infrastructure [2]. If these probes fail or show high latency, it’s a clear sign of issues with your CI provider or infrastructure, helping you isolate problems faster.
Standardising your logs is another crucial step. Use a format like JSON to enable automated root cause analysis [4]. Include essential details such as pipeline IDs, queue information, repository paths, and commit metadata in your logs. This will make troubleshooting across deployments much easier and more efficient.
By following these steps, you’ll lay the groundwork for a more reliable and efficient CI/CD pipeline. The impact of these practices becomes clear when comparing monitored pipelines to those without monitoring.
Monitored vs Unmonitored Pipelines: A Comparison
The advantages of monitoring are striking when you compare monitored pipelines to unmonitored ones. Teams that implement monitoring often achieve daily or even hourly deployments [1], while those without monitoring are stuck with slower cycles - sometimes weekly or monthly. Additionally, monitored pipelines typically maintain a change failure rate below 15% [1], whereas unmonitored ones often suffer from higher failure rates and emergency rollbacks.
| Metric | Unmonitored Pipeline | Monitored Pipeline |
|---|---|---|
| Deployment Frequency | Weekly or monthly releases | Daily or hourly [1] |
| Change Failure Rate | High with emergency rollbacks | Below 15% [1] |
| Issue Detection | Hours to days (manual checks) | Minutes (automated alerts) |
| Mean Time to Recovery | Prolonged due to unclear causes | Rapid with flame graphs and traces |
Monitored pipelines also offer tools like flame graphs to visualise job durations and track flaky tests [7][2]. These insights help teams address reliability issues before they escalate into production problems. Without monitoring, teams are left reacting to issues only after they’ve caused disruptions or deployment failures, which can be costly and time-consuming.
Conclusion
Real-time monitoring elevates CI/CD pipelines from merely reactive processes to proactive systems that ensure dependable software delivery. With immediate insights into builds and deployments, teams can catch failures during testing rather than in production, significantly reducing both resolution times and costs. This approach not only speeds up issue detection but also streamlines deployment cycles.
Beyond faster detection, monitoring strengthens deployment reliability. The advantages go further than just efficiency - automated remediation features allow systems to instantly roll back or scale up when performance thresholds are exceeded. This shifts the focus from solving problems after they occur to preventing them altogether. By consolidating logs, metrics, and traces into a single, unified dashboard, monitoring eliminates data silos, speeds up root cause analysis, and identifies resource bottlenecks, enabling more effective management of cloud budgets.
Hokstad Consulting specialises in embedding real-time monitoring solutions into CI/CD pipelines. Using frameworks such as OpenTelemetry, they ensure seamless tracking throughout the development lifecycle. Their services are designed with UK-specific needs in mind, adhering to local standards, including British English, regional date and time formats, and full GDPR compliance. This ensures UK organisations can maximise performance and cost efficiency through tailored monitoring solutions.
Whether you're looking for custom Grafana dashboards, Kubernetes monitoring for containerised setups, or end-to-end integration with leading platforms, Hokstad Consulting provides retainer-based services that align their fees with the savings you achieve.
FAQs
How does real-time monitoring help prevent failures in CI/CD pipelines?
Real-time monitoring offers instant visibility into each phase of the CI/CD pipeline - whether it's builds, tests, or deployments. By catching issues as they happen, teams can tackle problems straight away, reducing the likelihood of failures.
This forward-thinking method boosts deployment reliability and significantly lowers error rates, ensuring development processes stay on track and run efficiently.
How do tools like Prometheus and Grafana improve the efficiency of CI/CD pipelines?
Prometheus and Grafana create a powerful duo for real-time monitoring and improving the efficiency of CI/CD pipelines. Prometheus gathers essential metrics from your pipeline - like build times, error rates, and resource usage - while Grafana turns this raw data into clear, visually engaging dashboards and alerts.
Together, they help teams pinpoint bottlenecks, address failures, and fine-tune deployment workflows. This results in quicker issue detection and resolution, paving the way for smoother and more dependable software delivery.
How does real-time monitoring enhance developer productivity in CI/CD pipelines?
Real-time monitoring gives developers instant access to insights about builds, tests, and deployments. This means they can spot and fix problems as they happen, cutting down on errors and speeding up deployment times. The result? A much smoother and more efficient workflow.
By reducing delays and streamlining processes, real-time monitoring boosts reliability. Plus, it allows developers to spend more time on what really matters - creating innovative solutions and delivering top-notch software.