
Real-time Application Performance Monitoring (APM) helps DevOps teams identify and address performance issues instantly, avoiding delays that could lead to outages or user dissatisfaction. Unlike traditional tools, real-time APM delivers insights in under five seconds, making it possible to spot short-lived issues like CPU spikes or slow queries. By focusing on key metrics such as P95 latency, error rates, and Core Web Vitals, teams can improve both technical performance and business outcomes, including reducing customer churn and boosting conversion rates.
Key Takeaways:
- Real-time Monitoring: Tracks app performance with sub-5-second latency, critical for spotting transient issues.
- Metrics to Monitor: P95/P99 latency, error rates, throughput, and database performance.
- Tools & Techniques: Distributed tracing (e.g., OpenTelemetry), Real User Monitoring (RUM), and synthetic monitoring.
- Business Impact: Faster troubleshooting, reduced downtime, and improved user satisfaction.
- Implementation Tips: Use structured logging, align metrics with business goals, and minimise instrumentation overhead.
Real-time APM bridges technical insights with business goals, ensuring smoother operations and better user experiences. Hokstad Consulting supports this by integrating monitoring into DevOps pipelines, optimising cloud costs, and tailoring solutions to specific needs.
Introduction to APM: What is Application Performance Monitoring?
Need help optimizing your cloud costs?
Get expert advice on how to reduce your cloud expenses without sacrificing performance.
Key Metrics and KPIs for Performance Monitoring
When it comes to real-time insights, precise metrics and KPIs are the backbone of effective troubleshooting for DevOps teams.
Critical Metrics to Monitor
Instead of relying on averages, focus on percentiles like P50, P95, and P99 to track response times accurately. Why? Averages can paint a misleading picture. For instance, in a sample of 1,000 requests, an average response time of 115ms might look fine, but if 95% of users experience 100ms and a small group faces 5,000ms (timeouts), the actual user experience tells a different story [7]. Alongside response times, keep an eye on throughput (requests per second) and Time to First Byte (TTFB) for a more comprehensive view [6][7].
Reliability metrics are equally important. These include error rates - such as HTTP 4xx/5xx responses, exceptions, and failed API calls - along with availability and uptime. For perspective, 99.9% availability allows for 8.76 hours of downtime annually, while 99.99% reduces this to just 52.6 minutes [7]. On the infrastructure side, monitor CPU, memory, disk I/O, and network latency. Aim to keep CPU utilisation below 70%; anything above 90% signals a critical need for scaling [7].
APM metrics become your diagnostic tools for rapid problem identification and resolution.- SigNoz [7]
Database metrics also deserve attention. Metrics like query speed, connection pool utilisation, and cache hit ratios can highlight backend bottlenecks early [6][7]. For user experience, prioritise the Apdex Score (a measure of user satisfaction) and Core Web Vitals. These include:
- Largest Contentful Paint (LCP): under 2.5 seconds
- Interaction to Next Paint (INP): under 200ms
- Cumulative Layout Shift (CLS): below 0.1 [7]
Together, these metrics form the foundation for setting precise Service Level Objectives (SLOs).
Setting KPIs for Success
Metrics are just the starting point - KPIs tie them to business outcomes. Begin by defining Service Level Indicators (SLIs), such as P95 latency, and set corresponding SLOs like 95% of requests under 500ms
[1][4]. For instance, a 99.9% SLO translates to a monthly error budget of 43.2 minutes of downtime [7]. This approach helps avoid alert fatigue caused by arbitrary thresholds.
Before setting KPIs, establish performance baselines. These should reflect normal
operation across metrics like response times, throughput, and error rates [6]. High-performing applications typically aim for:
- Request processing times under 200ms
- Error rates below 1%
- Resource utilisation under 80%
- Apdex scores above 0.8 [2]
Monitoring strategies should also align with the type of service. For example, online-serving systems emphasise latency and error rates, while offline-processing systems focus on metrics like items in progress and heartbeat timestamps [9].
A successful APM strategy goes beyond uptime or server health and focuses on application service level objectives (SLOs) before they become a problem for users.- Elastic Observability Team [1]
Keep instrumentation overhead minimal - ideally under 5%. Over-instrumentation can add 15–20% latency to your application [1]. Alerts should be specific to critical transactions, such as logins or checkouts [4][8]. To manage visibility and storage costs, use 1–10% head-based sampling for high-traffic services and 100% tail-based sampling for error tracking [1].
Best Practices for Real-Time APM Implementation
::: @figure 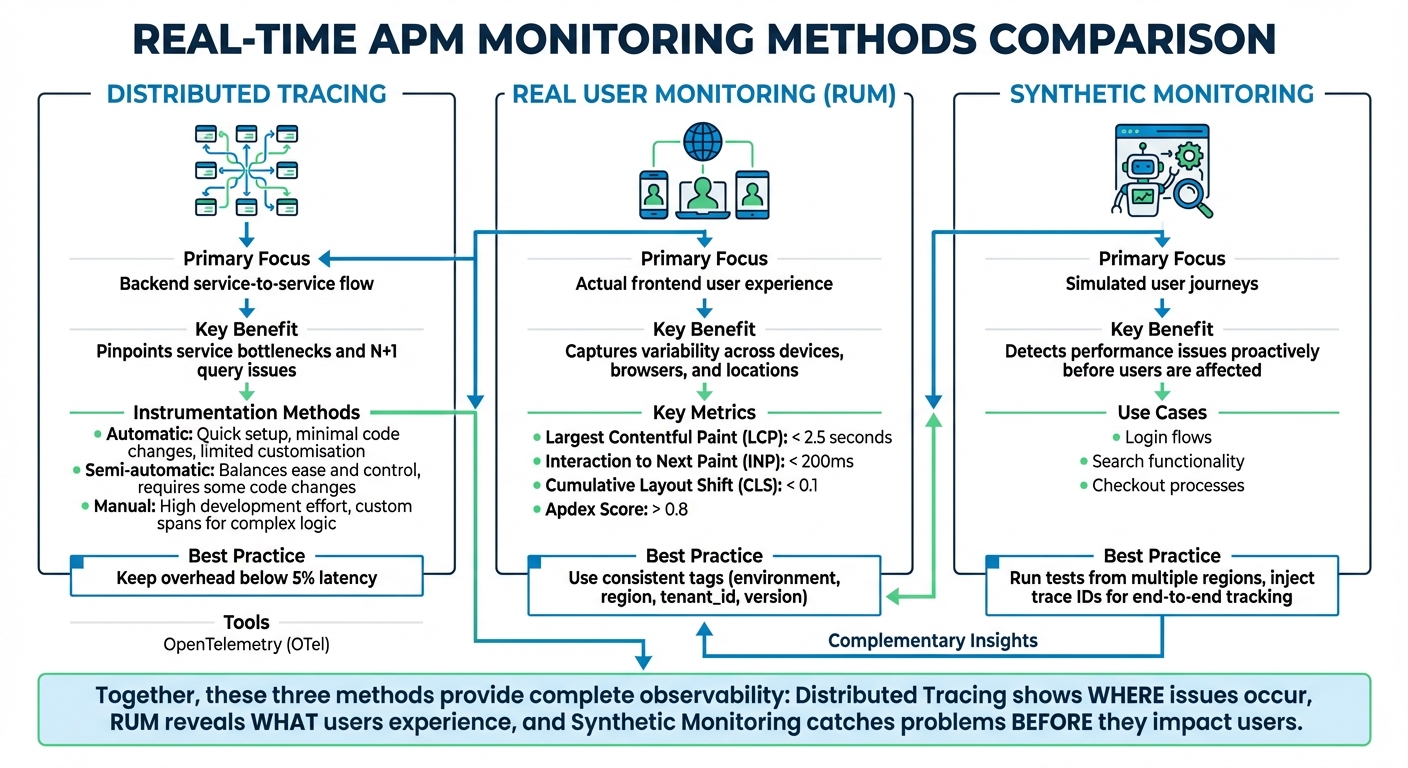 {Real-Time APM Monitoring Methods Comparison: Distributed Tracing vs RUM vs Synthetic Monitoring}
:::
{Real-Time APM Monitoring Methods Comparison: Distributed Tracing vs RUM vs Synthetic Monitoring}
:::
Once you've nailed down the critical performance metrics, the next step is making those insights actionable in real time. Here's how you can achieve that.
Implement Distributed Tracing
Distributed tracing is like a map for your requests, showing their journey through your microservices setup. Instead of playing a guessing game to find bottlenecks, you can pinpoint the exact service or database query causing delays. Tools like OpenTelemetry (OTel) make this process easier by providing a standard for instrumentation, so you can avoid being tied to a specific vendor [1][3].
Start small. Begin by instrumenting the broader areas like RPC layers, web frameworks, and API gateways - these touch many execution paths. Once that's in place, move on to specific business logic [13]. Using OpenTelemetry agents for auto-instrumentation can handle about 80% of your observability needs with little effort. For the remaining 20%, add manual instrumentation to critical workflows, such as checkout or payment processing.
The greatest value is going to come from building just enough coverage to generate end-to-end traces for some number of high-value transactions. It is important to visualise your instrumentation as early as possible.- OpenTracing [13]
Context propagation is non-negotiable. Use W3C Trace Context headers and consistent naming conventions (like http.url or http.status_code) to ensure smooth trace continuity across all request paths, even asynchronous ones like Kafka or RabbitMQ [1][10][12][14]. Without proper context propagation, your traces could end up fragmented, leaving blind spots in your monitoring.
Keep an eye on instrumentation overhead - latency increases should stay below 5% [1]. To avoid cluttering your flame graphs and overwhelming your backend, exclude static asset requests and health checks from tracing [14]. Also, limit span attributes to 128 entries to keep overhead in check [10].
| Instrumentation Method | Description | Best For | Limitations |
|---|---|---|---|
| Automatic | Uses agents/bytecode with minimal code changes | Quick setup, third-party dependencies | Limited customisation |
| Semi-automatic | Relies on SDKs and libraries | Most production apps; balances ease and control | Requires some code changes |
| Manual | Involves direct API calls for custom spans | Complex logic, domain-specific metrics | High development effort |
Once distributed tracing is in place, it's time to focus on the actual user experience with real user monitoring.
Use Real User Monitoring (RUM)
Unlike synthetic tests that simulate user behaviour, Real User Monitoring (RUM) captures what's actually happening for your users. It tracks performance across devices, browsers, networks, and locations - factors that synthetic monitoring can't fully mimic [1][16].
To integrate RUM with distributed tracing, propagate a shared trace ID from the user's interaction through every downstream service [15][16]. This creates a complete picture, helping you identify whether issues stem from client-side problems (like slow JavaScript), network delays, or backend bottlenecks. For instance, if users in a specific region experience slow page loads, you can trace the issue back to its source, whether it's a CDN hiccup, a sluggish API, or a database issue.
The work doesn't stop when it's in your user's hands. By monitoring their experience, you can iterate and improve based on their feedback.- Elastic Observability Team [1]
Focus on user-centric metrics like Core Web Vitals and Apdex scores, as they directly tie to user satisfaction. Add consistent tags like environment, region, tenant_id, and version to all telemetry data. This metadata makes it easier to filter and identify whether an issue affects all users or just specific groups [12][14].
While RUM gives you insight into real-world user experiences, synthetic monitoring helps you stay ahead of issues before they affect users.
Apply Synthetic Monitoring
Synthetic monitoring involves running automated scripts to simulate key user journeys, such as logging in, searching, or completing a checkout. This proactive method helps you catch performance issues and availability problems before they impact real users [1][11].
To make synthetic monitoring even more effective, inject trace IDs into your scripts. This allows you to track simulated user journeys through your backend stack [15]. By doing this, you can establish performance baselines and continuously verify that your Service Level Objectives (SLOs) are being met - even during slow traffic periods.
Run these tests from multiple regions to ensure consistent performance worldwide. If a test fails or response times exceed thresholds, you'll get an alert before your customers notice.
| Monitoring Type | Primary Focus | Key Benefit for Real-Time APM |
|---|---|---|
| Distributed Tracing | Backend service-to-service flow | Pinpoints service bottlenecks and N+1query issues [14][1] |
| Real User Monitoring (RUM) | Actual frontend user experience | Captures variability across devices, browsers, and locations [1][16] |
| Synthetic Monitoring | Simulated user journeys | Detects performance issues proactively [15][1] |
Correlating Data: Logs, Metrics, and Traces
Building on tracing, RUM, and synthetic monitoring, tying these elements together with effective data correlation strengthens your observability strategy.
While distributed tracing, RUM, and synthetic monitoring provide raw data, correlating logs, metrics, and traces transforms that data into actionable insights. Metrics highlight that something is wrong - like a sudden spike in error rates. Traces identify where the issue lies within your service chain. Logs, on the other hand, explain why it happened, often by exposing specific error messages or exceptions [21].
If correlation is absent, engineers are left switching between tools, manually copying trace IDs, and aligning timestamps - activities that stretch resolution times. Studies show that 70% of incidents take over 2 hours to resolve without proper distributed tracing and log correlation [17]. In contrast, organisations using OpenTelemetry-based tracing have seen a 60% reduction in MTTR [17].
To streamline troubleshooting, include a trace_id and span_id in every log entry. This approach complements your tracing strategy, allowing you to query all logs across various services tied to a single user journey [17]. For example, when a metric alert - like CPU usage hitting 90% - is triggered, the attached trace can help you locate the struggling service and review the relevant logs. This integration simplifies and accelerates problem-solving.
Structured Logging Techniques
Structured logging involves formatting logs in machine-readable formats like JSON, rather than plain text. This makes parsing, filtering, and analysis easier, eliminating the need for regex patterns that often fail when log formats change [17][1]. Each log entry should carry contextual metadata, such as the service name, severity level, duration, and the trace_id and span_id linking it to a specific request.
To maintain consistency across services and frameworks, follow OpenTelemetry semantic conventions for attribute naming [10][18]. Standardise timestamps to ISO 8601 and UTC to avoid clock skew, which can make event correlation in distributed systems nearly impossible [17].
An application is properly instrumented when developers don't need to add more instrumentation to troubleshoot an issue, because they have all of the information they need.- OpenTelemetry [20]
Aggregating and Analysing Metrics
Metrics offer a high-level perspective that alerts you to potential issues. However, managing high-cardinality data is crucial - avoid using unbounded values like unique user IDs, as they can inflate storage costs [1][9]. Instead, opt for bounded attributes such as user.tier, which might have just 3–5 possible values, compared to millions of potential user.id values.
Centralising metrics, traces, and logs in a unified data platform enables cross-querying and side-by-side visualisation [19]. For instance, if you notice a database query latency spike from 50ms to 500ms, you can drill down into the traces for that specific time frame and review the correlated logs. This might reveal issues like the N+1 query problem, where an application makes multiple redundant database calls instead of a single optimised query [17][1].
Modern tools also leverage AI to detect metric deviations that exceed two standard deviations from historical baselines [17][19]. This helps reduce noise, allowing teams to focus on genuine problems rather than wasting time on false alarms.
How Hokstad Consulting Supports Real-Time APM
Hokstad Consulting takes real-time Application Performance Monitoring (APM) a step further by embedding it seamlessly into the entire DevOps process. Success in real-time APM isn't just about picking the right tools - it’s about ensuring that monitoring and observability are woven into every stage of your workflow. Hokstad Consulting focuses on building monitoring capabilities from the ground up, ensuring telemetry data moves effortlessly through the development lifecycle. By version-controlling monitoring configurations, they ensure observability becomes a natural part of DevOps operations, enabling automation, cost efficiency, and tailored solutions.
DevOps Transformation and Automation
Hokstad Consulting embeds monitoring directly into CI/CD pipelines, automating processes in Kubernetes and containerised environments. Using frameworks like OpenTelemetry, they ensure consistent tracking of logs, metrics, and traces across public, private, and hybrid cloud infrastructures. Their custom automation scripts take things further by linking real-time alerts to actions such as scaling resources or redistributing workloads. This proactive approach helps minimise manual errors - by as much as 90% - while also speeding up deployment cycles by 75%.
They also create dashboards and alerts designed with UK-specific standards in mind, including currency displayed in pounds (£) and dates formatted as DD/MM/YYYY.
Cloud Cost Optimisation
Operational efficiency is only half the battle; managing cloud expenses is just as crucial. Poor resource allocation or unchecked high-cardinality metrics can quickly drive up costs. Hokstad Consulting addresses this with a cost engineering approach that can cut cloud spending by 30–50%. They achieve this through resource resizing, auto-scaling setups, and eliminating unnecessary data egress charges. Unlike many SaaS tools that send private telemetry data externally - often with unpredictable costs - they deploy solutions directly within your VPC, keeping data local and avoiding any data-out charges [22].
Their No Savings, No Fee
model ensures clients only pay a capped percentage of the savings achieved. This is particularly helpful for organisations using observability platforms that charge based on data volume, where high-cardinality metrics can otherwise lead to spiralling costs.
Custom Solutions for Real-Time APM
No two organisations face the same challenges when it comes to performance. Hokstad Consulting creates tailored APM solutions to address specific bottlenecks, whether you’re operating in public cloud environments, private infrastructure, or hybrid setups. They streamline integration by using standardised naming conventions like service-name[env], which helps reduce confusion in complex microservice ecosystems.
Their expertise also extends to auditing telemetry coverage across your entire stack. This ensures all components - including external APIs and databases - generate consistent logs, metrics, and traces. These bespoke solutions complement their broader monitoring framework, ensuring no critical performance issue goes unnoticed.
Conclusion
Summary of Best Practices
Real-time APM is a game-changer for modern DevOps teams. The difference between staying ahead of potential issues and scrambling to fix problems often comes down to adopting the right practices from the outset. Tools like distributed tracing offer detailed insights into how requests move through microservices, while Real User Monitoring (RUM) captures actual user experiences, moving beyond assumptions. Synthetic monitoring helps identify problems before they impact users, and combining logs, metrics, and traces reduces the complexity of managing multiple tools, speeding up troubleshooting.
Did you know? A 100ms delay in response time can cut conversion rates by 7%, and businesses that monitor latency proactively have seen customer churn drop by as much as 30% [5]. By focusing on tail latency (P95 and P99 percentiles) instead of averages, setting up SLO-based alerts to minimise alert fatigue, and using intelligent sampling to manage costs while retaining critical error data, teams can stay efficient and effective. As highlighted in Observability Engineering:
If you can understand any state of your software system... by arbitrarily slicing and dicing high-cardinality and high-dimensionality telemetry data... without being required to define or predict those debugging needs in advance, then you have observability[23].
How Hokstad Consulting Can Help
Real-time APM is about more than just picking the right tools - it’s about weaving observability into your entire DevOps process. That’s where Hokstad Consulting steps in. They specialise in DevOps transformation, seamlessly integrating monitoring into CI/CD pipelines using OpenTelemetry. Plus, their cloud cost engineering strategies can reduce cloud expenses by 30–50% through smarter resource management.
Hokstad’s tailored APM solutions are designed to fit your infrastructure, whether it’s public cloud, private, or hybrid. Their No Savings, No Fee
model ensures you only pay a capped percentage of the savings they deliver, making it an ideal choice for managing high-cardinality metrics without runaway costs. If you’re looking to implement or fine-tune real-time APM while keeping performance and costs in check, Hokstad Consulting has the expertise to help you succeed from the start.
FAQs
What makes real-time APM different from traditional monitoring tools?
Real-time APM takes monitoring to the next level by providing instant updates on application performance. Data refreshes in under 2 seconds, allowing teams to spot and resolve issues as they occur - no waiting around for scheduled updates.
Traditional monitoring tools, on the other hand, often operate on intervals ranging from 10 to 60 seconds or more. This delay means fleeting issues can easily slip through unnoticed. For DevOps teams, the ability to monitor in real time is a game-changer. It helps minimise downtime, ensures smooth application performance, and keeps the user experience uninterrupted.
What key metrics should DevOps teams monitor to enhance user experience?
To create a better user experience, DevOps teams should keep a close eye on the Golden Signals of monitoring: latency, errors, traffic, and saturation. Here's why each one matters:
- Latency: This measures how fast the system handles requests. A slow response can make users feel like the system is sluggish, directly impacting their experience.
- Errors: These are failed requests or system breakdowns. If errors aren't addressed quickly, they can harm user trust and satisfaction.
- Traffic: This shows how much activity the system is handling. Understanding traffic patterns helps teams prepare for spikes in demand.
- Saturation: This tracks resource usage, such as CPU or memory, and helps teams spot bottlenecks before they disrupt performance.
In addition to these signals, there are other metrics worth tracking. Mean time to detect (MTTD) reveals how quickly issues are spotted, while monitoring false positive rates ensures alerts focus on real problems instead of wasting time on non-issues. By keeping tabs on these metrics, teams can prevent problems, fine-tune system performance, and deliver a seamless and reliable experience for users.
What are the best practices for implementing distributed tracing in a DevOps pipeline?
To make distributed tracing work well in a DevOps pipeline, start by adopting a standardised tracing protocol like OpenTelemetry. This ensures your microservices and tools can communicate seamlessly, making it simpler to gather consistent data and connect with monitoring systems.
Add tracing hooks at critical points in your application - such as service boundaries, database operations, and external API calls. These hooks map out the flow of requests, making it easier to spot performance issues or failures. Using automated tools that offer real-time tracing and alerts can also speed up your response to problems, which is especially helpful in dynamic environments.
It’s also important to regularly review and fine-tune your tracing setup. Keep system overhead low by setting sensible sampling rates and filtering out unneeded data. This way, your system stays efficient while still delivering useful insights. By doing this, you can boost observability, build a more reliable system, and make troubleshooting smoother in your DevOps processes.