Managing CI/CD pipelines across multiple cloud providers like AWS, Azure, and Google Cloud is complex. Observability - analysing logs, metrics, and traces - helps you pinpoint issues, optimise performance, and maintain reliability. Here's what you need to know:
- Challenges: Tool incompatibility, data silos, and security inconsistencies make multi-cloud observability difficult.
- Solutions: Use unified platforms, centralise data collection, and adopt open standards like OpenTelemetry to standardise telemetry data.
- Key Practices: Automate CI/CD pipelines with GitOps tools, enforce consistent tagging, and integrate AI for smarter anomaly detection.
- Security: Monitor metrics across clouds, encrypt telemetry, and ensure compliance with regulations like GDPR.
Lightning Talk: Observability-First DevSecOps: Building Resilient Multi-Cloud P... Ravindra Bhargava
Best Practices for Multi-Cloud CI/CD Observability
Navigating observability across multiple cloud providers demands a well-thought-out strategy. By consolidating telemetry data and minimising blind spots, teams can maintain oversight of increasingly complex CI/CD workflows. These practices form the backbone of a strong and efficient multi-cloud observability approach.
Deploy Unified Observability Platforms
Using centralised platforms that integrate seamlessly with AWS, Azure, and Google Cloud can simplify multi-cloud observability. Instead of juggling multiple dashboards for each provider, these platforms bring together metrics, logs, and traces into one cohesive view. This tackles the issue of tool sprawl, making it easier to connect the dots across different systems [1].
The AWS Observability Best Practices Guide highlights the importance of flexibility:
Tools are meant to enable and empower observability, not to limit your choices
[2].
Adopting OpenTelemetry (OTel) as a standard framework can also help avoid vendor lock-in. OTel offers a vendor-neutral protocol (OTLP) for collecting logs, metrics, and traces, ensuring easy backend switching when needed [1]. By unifying observability in this way, teams can lay the groundwork for further standardisation and automation.
Integrate Centralised Data Collection
Bringing telemetry data from various cloud environments into a single repository is critical for spotting anomalies in intricate data pipelines [6]. Observability pipelines make this possible by gathering data from multiple sources, applying transformations like encryption or anonymisation, and routing it to a centralised location for analysis [7].
Consistent tagging is another key step. Tagging resources with labels such as environment type (e.g., production or staging), service names, and cloud provider details allows teams to quickly pinpoint issues in specific workloads. The benefits of this approach are clear - organisations that focus on high-value telemetry data have managed to cut data volumes and costs by around 84%, while also improving remediation times by over 50% [7]. This strategy effectively connects observability to actionable insights across cloud platforms.
Use AI and Machine Learning for Insights
AI-powered observability tools can transform how teams detect and manage anomalies. These tools replace static thresholds with dynamic baselines, learning the normal behaviour of workloads. For example, instead of flagging every instance where CPU usage exceeds 80%, AI systems only alert teams to genuine deviations. This is crucial in environments where log data has grown by 250% in recent years [7].
AI Site Reliability Engineering (SRE) agents can also streamline incident management. These agents integrate with tools like Kubernetes, PagerDuty, and Slack, enabling initial triage and analysis of pipeline failures within minutes [6]. While manual triage often takes days and involves combing through countless logs, AI provides instant context, allowing engineers to focus on resolving the issue.
Predictive analytics take observability a step further, moving from reactive to proactive monitoring. Machine learning models can identify infrastructure needs and performance trends, enabling teams to optimise resources and prevent bottlenecks before they occur [6].
Standardisation and Automation in Multi-Cloud Environments
In multi-cloud setups, standardisation and automation are essential to keep things manageable. Without these, teams face challenges like juggling various APIs, piecing together fragmented dashboards, and dealing with inconsistent configurations across platforms like AWS, Azure, and Google Cloud. The way forward? Use cloud-agnostic tools and automate repetitive processes. These steps help establish consistent practices across diverse cloud services.
Adopt Standardised Practices Across Cloud Providers
Adopting open standards like OpenTelemetry and Prometheus ensures that telemetry data remains portable and avoids locking you into a single vendor's ecosystem [2].
Tools like Terraform and Pulumi, which fall under the Infrastructure as Code (IaC) category, create a unified layer for defining infrastructure across various clouds. This reduces the risk of configuration drift and makes managing resources more predictable [5].
Another crucial step is implementing consistent tagging and naming conventions. For instance, if all resources follow a standard format - labelling by environment type, service name, or cloud provider - teams can troubleshoot faster. Clear, uniform labels mean less time deciphering unique naming schemes and more time focusing on solutions.
Implement Automation in CI/CD Pipelines
Automation transforms observability from a reactive process into a proactive one. GitOps tools like Argo CD and Flux CD streamline this by automatically synchronising observability deployments across multiple clusters. For example, when a code change is committed, these tools ensure monitoring configurations are updated across all environments.
Policy-as-Code tools such as Kyverno and Open Policy Agent (OPA) add another layer of consistency. They enforce rules for resource limits and security policies, catching issues like missing tags or non-compliant settings before they hit production. This is particularly critical when managing different IAM frameworks and security features across cloud platforms [5][1].
Deployment strategies like blue-green and canary deployments help to roll out updates without downtime. These methods allow changes to be tested with limited traffic, reducing risks. Automated rollback features further minimise the impact of failures in multi-cloud environments. Meanwhile, secret management tools like HashiCorp Vault centralise credential handling, eliminating the need to manage separate API secrets for each provider.
Need help optimizing your cloud costs?
Get expert advice on how to reduce your cloud expenses without sacrificing performance.
Security and Compliance in Multi-Cloud Observability
The rise of multi-cloud environments has brought a sharp increase in security risks - incidents skyrocketed from 24% to 61% in just one year. When CI/CD pipelines stretch across platforms like AWS, Azure, and Google Cloud, the varying security frameworks, IAM configurations, and compliance requirements create a complex environment to manage. Strong observability tools act as the glue, bringing these fragmented systems together and identifying vulnerabilities before they escalate into breaches.
Monitor Security Metrics Across Cloud Providers
To stay ahead of security challenges, a unified approach to data collection is essential. Observability pipelines can protect data during transit by applying techniques like encryption, anonymisation, or data masking before telemetry even leaves the cloud environment [1]. Using OpenTelemetry can further streamline this process, ensuring consistent security monitoring across diverse IAM setups in multi-cloud systems [1][2].
Kubernetes monitoring... strengthens security by identifying anomalies early, ensuring your applications run smoothly and reliably in production.– Wiz [1]
However, transferring telemetry between cloud environments can introduce latency, which may diminish its effectiveness for real-time security alerts. To address this, only transfer telemetry when its aggregation clearly adds value to business operations [2]. These security metrics not only enhance protection but also provide the foundation for compliance monitoring.
Compliance Monitoring and Reporting
With 96% of organisations expressing concerns about risk management in hybrid cloud environments, robust compliance monitoring is no longer optional. Observability tools play a crucial role here, generating detailed audit trails that help organisations demonstrate compliance with regulations like GDPR and ISO 27001. This level of monitoring supports effective risk management across multi-cloud CI/CD workflows, ensuring organisations meet stringent regulatory demands while maintaining operational efficiency.
Tools and Services for Multi-Cloud Observability
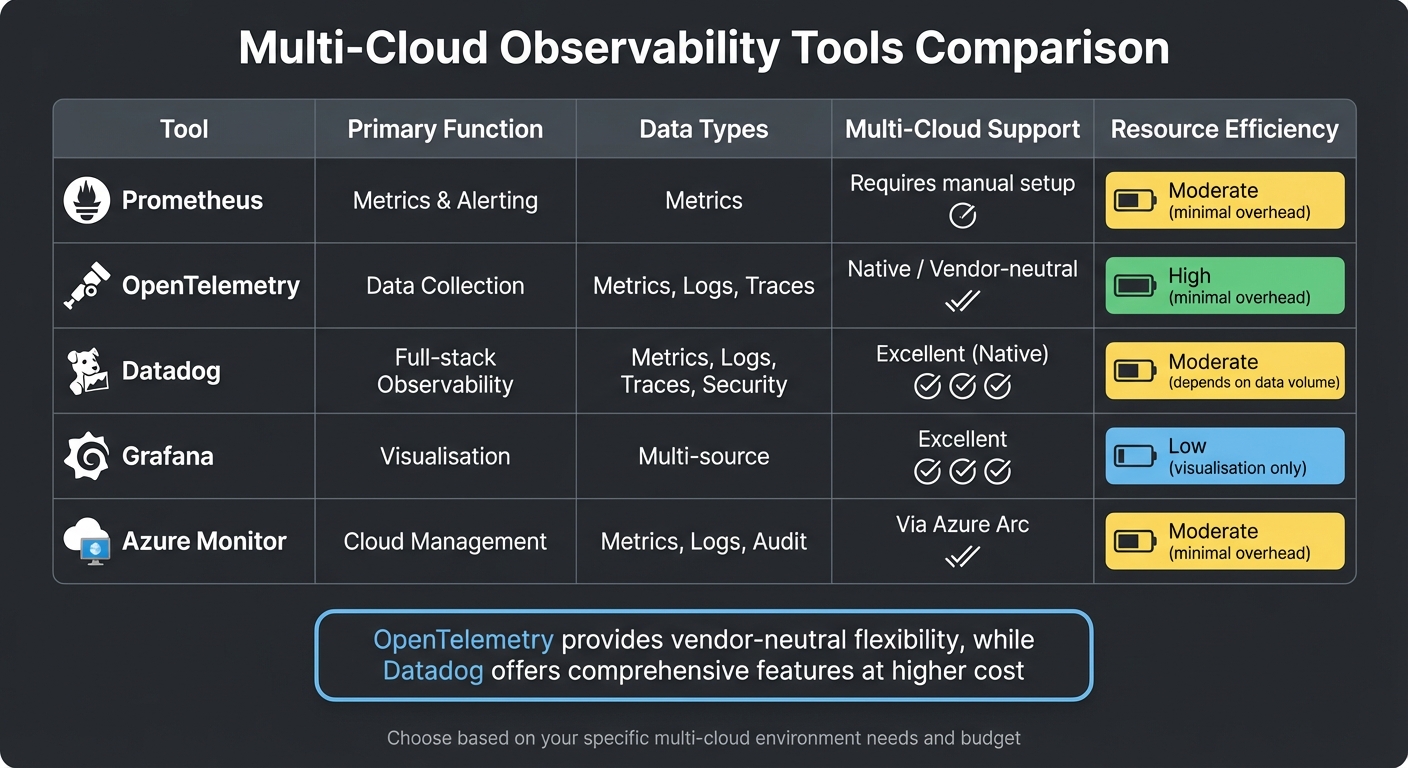
::: @figure  {Multi-Cloud Observability Tools Comparison: Features and Capabilities}
:::
Choosing the right tools for observability in multi-cloud CI/CD environments is all about finding the right balance between functionality, cost, and scalability. Vendor-neutral frameworks are especially useful here, as they provide visibility across platforms like AWS, Azure, and Google Cloud without locking you into a single provider. Below, we've outlined some of the key tools and services that can make multi-cloud observability more effective.
Observability Tools: Prometheus, Datadog, and Others

OpenTelemetry plays a critical role in collecting data across multiple clouds. Its vendor-neutral design ensures flexibility, allowing organisations to switch backends without needing to rewrite code [2].
Datadog offers a powerful SaaS platform with features like monitoring-as-code
, which integrates YAML and Terraform for full-stack observability. However, its advanced capabilities come with a higher price tag, and managing data volumes is essential to keep costs under control [9]. For organisations already using AWS, AWS Managed Prometheus and Grafana provide cost-effective alternatives, though they come with fewer built-in features.
| Tool | Primary Function | Data Types | Multi-Cloud Support | Resource Efficiency |
|---|---|---|---|---|
| Prometheus | Metrics & Alerting | Metrics | Requires manual setup | Moderate (minimal overhead) |
| OpenTelemetry | Data Collection | Metrics, Logs, Traces | Native / Vendor-neutral | High (minimal overhead) |
| Datadog | Full-stack Observability | Metrics, Logs, Traces, Security | Excellent (Native) | Moderate (depends on data volume) |
| Grafana | Visualisation | Multi-source | Excellent | Low (visualisation only) |
| Azure Monitor | Cloud Management | Metrics, Logs, Audit | Via Azure Arc | Moderate (minimal overhead) |
For larger Prometheus setups, hierarchical federation with recording rules can help aggregate data while reducing resource usage [10]. Additionally, Azure Arc extends Azure Monitor's capabilities to AWS EC2 and GCP VM instances, enabling consistent monitoring across platforms [8].
How Hokstad Consulting Can Help

Hokstad Consulting offers tailored solutions that integrate observability with broader business goals. They focus on bridging the gap between infrastructure monitoring and application observability, helping organisations cut through the noise in complex multi-cloud setups. Their approach goes beyond just collecting metrics - it aligns technical performance with goals like customer satisfaction, operational efficiency, and revenue growth.
Their DevOps transformation services streamline the deployment of observability agents across clusters using Kubernetes Operators, GitOps, and Infrastructure-as-Code. This automation reduces manual errors and ensures consistency. They've also helped organisations lower Kubernetes costs by up to 80% through cloud cost engineering, identifying where observability data adds real value and eliminating unnecessary expenses like egress charges.
For businesses struggling with fragmented monitoring across AWS, Azure, and Google Cloud, Hokstad Consulting develops customised observability frameworks that adapt to changing workloads. Their services include custom automation to speed up deployment cycles and security and compliance monitoring to address vulnerability gaps in multi-cloud environments. They even offer a 30-minute consultation to help identify areas where costs can be cut without compromising performance - especially critical given the half-life
of observability data [2].
Conclusion
Achieving effective multi-cloud CI/CD observability hinges on using unified platforms, adopting standardised practices, and leveraging expert insights. By consolidating data from AWS, Azure, and Google Cloud into a single interface, organisations can eliminate silos that complicate troubleshooting and drive up costs. Correlating logs, metrics, and traces across providers becomes key to cutting resolution times and improving overall efficiency, especially as environments grow more complex.
Standardisation, particularly through OpenTelemetry, ensures data portability and avoids vendor lock-in [2]. This approach offers flexibility as workloads shift between clouds, creating what’s often referred to as a two-way door
for scaling operations. Equally, it’s essential to focus on metrics tied to business outcomes - like transaction completions - rather than getting lost in infrastructure data that doesn’t affect customer experience [3]. Observability tools should empower strategies, not dictate them.
Expert guidance plays a crucial role in addressing hidden costs, such as CPU overhead and data egress charges. With organisations seeing a 250% increase in log data [7], managing costs and complexity demands strategic frameworks. Internal teams may lack the expertise to optimise observability pipelines or implement advanced solutions like AI-driven anomaly detection at scale. Tailored consulting can transform observability from a technical challenge into a strategic asset, aligning infrastructure performance with business goals like revenue growth and improved customer satisfaction.
The often-overlooked costs of observability, including CPU usage, data egress fees, and overall system overhead, need constant monitoring [1][4]. By adopting vendor-neutral frameworks early, centralising security policies, and focusing on meaningful metrics rather than every deviation, organisations can build scalable observability systems that deliver value without exceeding their operational costs.
FAQs
How does OpenTelemetry help avoid vendor lock-in for multi-cloud observability?
OpenTelemetry provides a way to sidestep vendor lock-in by offering an open-source, vendor-neutral framework for observability. With its APIs, SDKs, and Collector, you can instrument your applications just once and then export telemetry data - like traces, metrics, and logs - to any backend you prefer. This means you can switch between observability providers or cloud platforms without the hassle of rewriting or reconfiguring your code.
By creating a standardised approach to collecting and exporting telemetry data, OpenTelemetry puts you in charge of your observability setup. This makes it simpler to adjust to evolving business requirements or manage costs more effectively across various cloud environments.
How does AI improve observability in multi-cloud CI/CD pipelines?
AI is reshaping how we approach CI/CD observability, shifting it from simply reacting to problems to actively managing and preventing them. By using machine learning, AI examines logs, metrics, and traces in real time to spot unusual patterns or behaviours. This means teams can identify issues much faster and resolve them more efficiently with automated root-cause analysis.
In multi-cloud setups, AI takes visibility to the next level by pulling together data from various cloud providers and understanding the unique performance benchmarks of each. This allows teams to foresee potential problems, maintain steady performance, and optimise deployment cycles. With AI-powered insights, organisations can build stronger pipelines that not only detect and fix issues but also predict and avoid them altogether, leading to smoother operations and reduced costs.
How does standardisation and automation enhance security in multi-cloud environments?
Standardising tools and security policies across all cloud platforms is key to maintaining consistent access controls, managing secrets effectively, and adhering to compliance rules. This approach helps prevent configuration drift, ensures uniform audit trails, and offers a clear, consolidated view of security across diverse environments like AWS, Azure, or private clouds. A unified observability stack plays a crucial role here, enabling the early detection of anomalies and providing security teams with a comprehensive perspective on potential threats.
Automation takes this a step further by enforcing these standards at scale. Automated pipelines can handle tasks like encrypting backups, enforcing least-privilege access, and scanning code or container images with every update. This significantly reduces the risk of human error. Features such as real-time alerts and AI-driven anomaly detection can trigger swift actions, such as rolling back risky changes or isolating compromised resources, which helps minimise potential damage.
Combining standardisation with automation allows organisations to bolster their security, respond to incidents more quickly, and simplify compliance processes - critical elements for a robust multi-cloud CI/CD strategy in the UK market.
