
Monitoring event-driven systems is complex due to their asynchronous nature, making effective monitoring a necessity to ensure reliability and performance. Key metrics like latency, traffic, errors, and saturation help identify bottlenecks, troubleshoot issues, and maintain system health. For example:
- Latency: Measures event processing time, from ingestion to completion.
- Traffic: Tracks system demand, such as messages per second.
- Errors: Identifies failed processes or misconfigurations.
- Saturation: Highlights resource usage, like queue depths or connection pool utilisation.
Using frameworks like the Four Golden Signals and MELT (Metrics, Events, Logs, Traces), you can gain visibility into these systems. Distributed tracing further helps track event lifecycles across services, while tools like Dead-Letter Queues capture failed events for analysis. By monitoring these metrics, teams can prevent silent failures, reduce downtime, and ensure smooth operations in large-scale, distributed architectures.
::: @figure 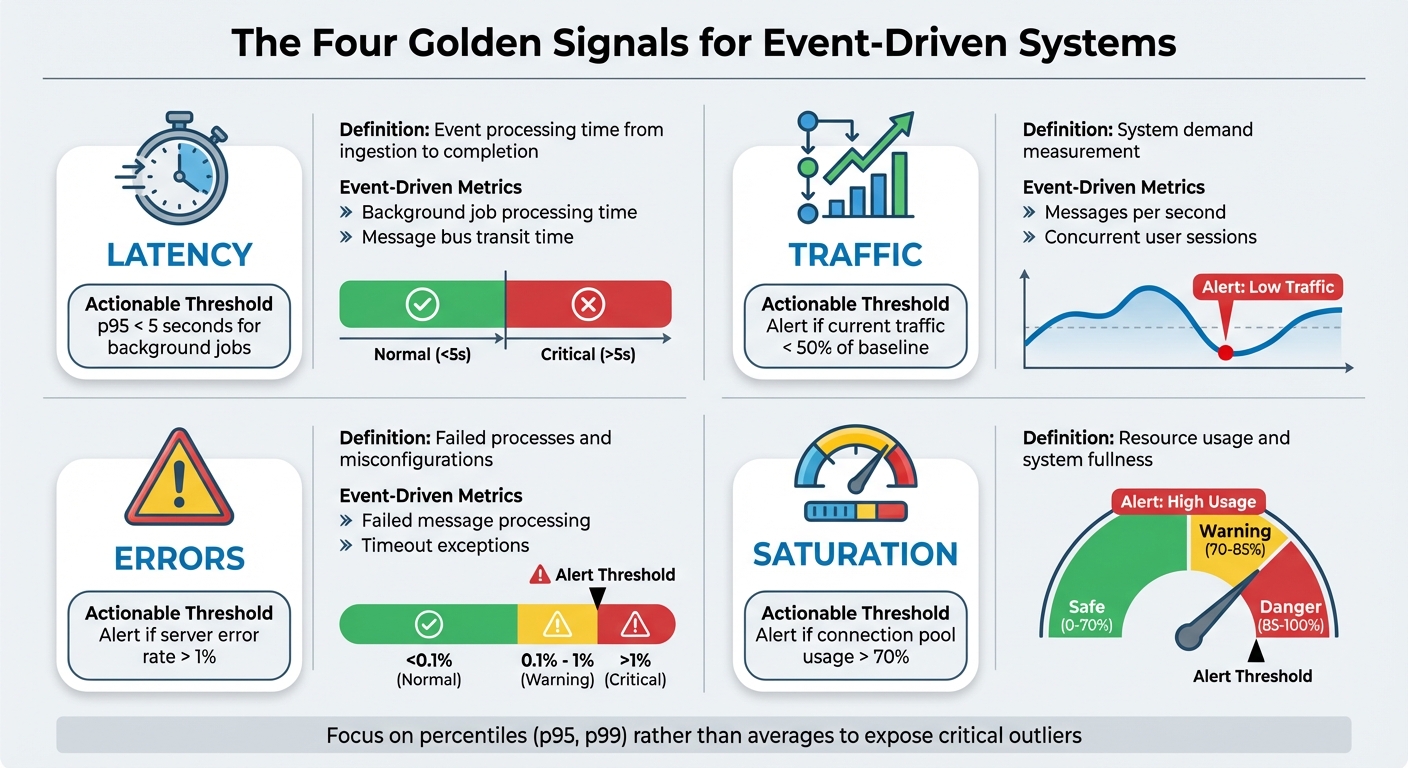 {Four Golden Signals Framework for Event-Driven System Monitoring}
:::
{Four Golden Signals Framework for Event-Driven System Monitoring}
:::
Understand Observability for Event-Driven Systems
1. The Four Golden Signals Method
The Four Golden Signals framework, introduced by Google's Site Reliability Engineering (SRE) team, serves as a universal guide for monitoring systems. As outlined in Google's SRE Book:
The four golden signals of monitoring are latency, traffic, errors, and saturation. If you can only measure four metrics of your user-facing system, focus on these four [12].
This approach is especially crucial for event-driven systems, where asynchronous processes require tailored monitoring strategies.
Relevance to Event-Driven System Monitoring
Each of the four signals highlights a critical aspect of system health, particularly for event-driven workflows:
- Latency tracks the time it takes to process an event, from initial ingestion to successful delivery to its target service [2][8].
- Traffic measures system demand, often expressed as messages per second or API requests per second [8][11].
- Errors capture issues like failed message processing, timeout exceptions, explicit failures (e.g., HTTP 500 errors), and implicit errors (e.g., correct responses with incorrect content) [8][9].
- Saturation reveals how
full
the system is, focusing on metrics like queue depths, thread pool availability, and database connection pool utilisation [8][12].
In event-driven systems, monitoring queue depths and connection pool usage is often more insightful than solely tracking CPU or memory usage. For instance, database connection pools should remain under 70% utilisation to handle sudden traffic spikes effectively. Meanwhile, CPU usage can typically reach up to 80% without issues [8].
Impact on System Performance and Troubleshooting
Understanding these signals can help identify and resolve performance problems. For example, high latency combined with high saturation but low errors might indicate resource overload, while low latency paired with high errors could signal bugs or misconfigurations. This differentiation is crucial when downtime can cost businesses as much as £4,200 per minute [10]. Even a small increase in latency - just 100 milliseconds - can degrade web service performance by up to 140% [11].
Ease of Measurement and Actionable Insights
The Four Golden Signals are most effective when measured at service boundaries, such as API gateways, reverse proxies, or application-level libraries [8]. It’s better to track percentiles (e.g., p95 or p99) rather than averages, as averages can hide critical outliers. For instance, a service might show a 50-millisecond average latency, while the p99 latency could be as high as 10 seconds [8][9].
To avoid unnecessary alerts, focus on user-centric metrics. For example, set alerts for p95 latency exceeding 500 milliseconds. Typical error rate thresholds range from under 0.1% (normal) to over 5%, which often signals a critical issue [8].
| Signal | Event-Driven Metric Examples | Actionable Threshold Example |
|---|---|---|
| Latency | Background job processing time, message bus transit time | p95 < 5 seconds for background jobs [8] |
| Traffic | Messages per second, concurrent user sessions | Alert if current traffic < 50% of baseline [8] |
| Errors | Failed message processing, timeout exceptions | Alert if server error rate > 1% [8] |
| Saturation | Queue depth, database connection pool usage | Alert if connection pool usage > 70% [8] |
Next, we’ll dive deeper into latency and its specific role in event processing.
2. Latency and Event Processing Duration
Relevance to Event-Driven System Monitoring
Latency measures the total time it takes for an event to move from its entry point to successful processing [2][6]. This includes the time the event spends in transit (message in-flight time), the actual processing duration, and the response time [15][13]. In event-driven systems, producers send events without waiting for immediate feedback [6][15]. As a result, monitoring latency becomes crucial to understanding the performance of these decoupled services.
Breaking latency into phases - capture, processing, and availability - can help pinpoint bottlenecks. For example:
- Capture latency tracks the delay between a user action and when the system ingests the event.
- Processing latency measures the time spent transforming and modelling the data.
- Availability latency reflects how long it takes for the processed data to be ready for use in applications or dashboards [17].
For streaming platforms like Kafka or Kinesis, monitoring age
metrics such as IteratorAgeMilliseconds or ApproximateAgeOfOldestMessage can highlight if consumers are lagging behind the rate at which producers are generating events [16].
Impact on System Performance and Troubleshooting
High latency can act as an early warning for issues like underperforming or overloaded components, even if error rates remain at zero [2][6]. For instance, a target might respond successfully but take much longer to process requests, leading to a degraded user experience without triggering failure alerts.
Amazon EventBridge, which processes over 2.6 trillion events monthly as of February 2024, retries failed events up to 185 times over 24 hours if latency exceeds acceptable limits [6][2]. During a load test where the system received double its capacity (100 vs. 50 requests per second), p99 latency spiked to nearly 10 minutes due to retries and backoff mechanisms [6].
A real-world example comes from The Pedowitz Group, where a SaaS team reduced lead routing latency from 18 minutes to 3 minutes (P90) by implementing end-to-end timestamp tracking and moving critical paths to Change Data Capture. This optimisation led to a 99.4% on-time delivery rate and a 17% increase in reply rates for triggered campaigns [17].
Ease of Measurement and Actionable Insights
To gain meaningful insights, focus on percentiles like p50, p90, and p99 instead of averages, as these expose latency spikes [6][16][17]. Export Unix timestamps for events instead of time since
metrics to prevent update logic from stalling [4]. Use distributed tracing with correlation IDs to track an event's journey through the system [15]. Inject heartbeat events during low-traffic periods to identify propagation delays [4][17].
Lastly, set up Dead-Letter Queues to capture events that fail due to excessive latency or after exhausting retries [6][2].
Next, we'll delve into throughput metrics to further evaluate event system performance.
3. Throughput and Event Traffic Rates
Relevance to Event-Driven System Monitoring
Throughput measures the number of events processed over a specific time frame at key points like ingestion, routing, and delivery [6][19]. To put this into perspective, Amazon EventBridge handled over 2.6 trillion events monthly as of February 2024 [6]. Monitoring throughput is crucial because it highlights demand spikes, user behaviour, and scaling requirements [6]. Any imbalance between incoming event rates and outgoing delivery rates often points to bottlenecks. These could stem from under-provisioned resources or throttled consumers [6]. By understanding throughput, teams can identify and address performance issues more effectively.
Impact on System Performance and Troubleshooting
Throughput plays a key role in interpreting other metrics. For instance, a 5% error rate during high throughput is a far bigger concern than the same percentage during low throughput [8]. In systems like EventBridge, comparing metrics such as MatchedEvents (events that meet rule criteria) and Invocations (attempts to call a target) can uncover filtering or routing inefficiencies [6]. If invocation attempts significantly exceed incoming events, it may signal a bottleneck due to throttled targets or insufficiently scaled resources, resulting in retries [6].
A constant mismatch \[between successful and total invocations\] is an indication of a misconfigured target and needs to be addressed as part of the shared responsibility model.
– Maximilian Schellhorn and Michael Gasch, AWS [6]
Ease of Measurement and Actionable Insights
Metrics like SuccessfulInvocationRate - calculated as (Successful Invocations / Total Invocation Attempts) - can help pinpoint misconfigured or under-scaled targets [2]. Similarly, tracking RetryInvocationAttempts offers insight into whether resources are under-provisioned [2]. Lag metrics, such as records_lag_max or CaptureBacklog, are also useful for identifying processing delays [20][21]. Establishing baselines for different time frames, such as weekdays versus weekends, makes it easier to detect unexpected drops that could signal upstream failures [8]. These actionable insights allow teams to respond quickly and maintain system performance.
4. Error Rates and Failure Tracking
Relevance to Event-Driven System Monitoring
After tackling throughput challenges, it’s time to zero in on error tracking - an essential aspect of ensuring system reliability. In event-driven systems, errors can often fly under the radar due to their asynchronous nature. Unlike traditional request–response setups, where failures are immediately apparent, asynchronous workflows allow producers to continue operating even if consumers fail silently [15][6]. For example, a service might successfully publish thousands of events, but if consumers fail to process them, the issue might go unnoticed without proper monitoring. This makes active error tracking absolutely critical.
Errors in these systems generally fall into four main categories:
- Execution errors: These include code exceptions, runtime failures, and timeouts during event processing [18][5].
- Delivery and routing errors: These occur when targets are throttled, unresponsive, or when events fail to reach a Dead-Letter Queue (DLQ) [2][18].
- Configuration errors: Issues like schema mismatches between producers and consumers, or permission problems, fall into this category [15][18].
- Resource errors: These involve challenges like concurrency limits, memory exhaustion, or queue overflows [18][8].
In a healthy system, error rates should stay below 0.1%. If they climb above 5%, it’s a red flag indicating critical failures [8]. Understanding these error types is key to preventing cascading issues across the system.
Impact on System Performance and Troubleshooting
High error rates can spiral into larger system failures. For instance, Amazon EventBridge, which processes over 2.6 trillion events each month (as of February 2024), retries failed deliveries up to 185 times over a 24-hour period by default [6][2]. These retries, often caused by under-provisioned targets, can stretch latency from milliseconds to as long as 10 minutes [6]. While the system may appear functional, its performance can degrade significantly under such conditions.
To separate temporary spikes from deeper issues, monitor metrics like SuccessfulInvocationRate [2][6]. In distributed systems such as Kafka, keeping an eye on UncleanLeaderElections is crucial. Even a single occurrence signals data loss, as it compromises consistency in favour of availability [13].
Ease of Measurement and Actionable Insights
To guard against these risks, precise monitoring strategies are a must. Dead-Letter Queues (DLQs) are an excellent tool for tracking errors effectively. Setting up a DLQ for every rule or target ensures that permanently failed events are captured, enabling later review and reprocessing [2][15]. Monitoring the InvocationsSentToDlq metric can help detect issues early in the failure chain [2][6].
Schema tracking tools are also essential for identifying breaking changes, which often occur when producers alter event structures without notifying consumers - a common cause of silent failures [15]. For platforms like Google Cloud Pub/Sub, tracking expired acknowledgement deadlines is another key strategy. These poison pill
messages can crash clients, and keeping the expiration rate between 0.1% and 1% is generally considered healthy [14].
For organisations looking to improve their error tracking and monitoring capabilities, Hokstad Consulting provides expert guidance to help maintain robust system performance and reliability.
5. Resource Saturation and Usage
Relevance to Event-Driven System Monitoring
Once error tracking is in place, the next step is to assess how close your system is to hitting full capacity. Saturation measures how much of your service's resources are being utilised - essentially, how full
your system is. This applies not just to hardware resources like CPU, memory, and disk I/O, but also to software-defined limits such as message queue depths, thread pools, connection pools, and concurrency limits [5][8][18][22].
Saturation: How 'full' your service is. A measure of your system fraction, emphasizing the resources that are most constrained.
- Rob Ewaschuk, Site Reliability Engineer, Google [5]
Saturation monitoring is crucial because many systems start to degrade well before they hit 100% utilisation [5]. For instance, a database connection pool operating at 95% capacity can quickly lead to failed requests [8]. When targets are saturated, you'll often see higher latency, more retries, and eventual failures - many of which end up in dead-letter queues [2][6]. By keeping saturation under control, you can anticipate and address stress points before they escalate, enabling proactive scaling.
Impact on System Performance and Troubleshooting
Saturation often shows up as increased message queue depths, longer processing times, or noticeable consumer lag [15][22]. Take Amazon EventBridge as an example - it processes over 2.6 trillion events each month (as of February 2024) [6]. When its targets become saturated, processing delays can stretch from milliseconds to minutes, or even hours.
Common thresholds for resource usage include:
- CPU usage above 80%
- Memory usage above 85%
- Connection pools exceeding 70%
- Message queue depths showing unbounded growth [8][22]
These benchmarks provide a starting point for identifying stress points and taking action before they impact performance.
Ease of Measurement and Actionable Insights
Monitoring the 99th percentile (p99) response times is a great way to detect early signs of saturation since latency tends to spike before resources are fully maxed out [5][8]. Combining saturation, latency, and error metrics into unified alerts can also help minimise false positives and ensure you’re focusing on real issues [8].
For AWS Lambda functions, keeping an eye on the ConcurrentExecutions metric can reveal when you're nearing concurrency limits. This might mean it's time to adjust reserved concurrency or scale horizontally to handle the load more effectively [18][22]. Always configure dead-letter queues to capture and analyse failures, providing a safety net for troubleshooting [2][6].
For organisations aiming to fine-tune their resource monitoring and scaling, Hokstad Consulting offers customised cloud infrastructure solutions to keep systems running smoothly, even under fluctuating loads. These strategies provide a solid foundation for maintaining performance and optimising operations.
6. MELT Framework: Metrics, Events, Logs, and Traces
Relevance to Event-Driven System Monitoring
The MELT framework - Metrics, Events, Logs, and Traces - provides a comprehensive approach to observability in event-driven systems. Each element plays a unique role: metrics highlight overarching trends, events mark specific occurrences, logs capture detailed error information, and traces map the flow of requests across services.
At New Relic, we believe that metrics, events, logs, and traces (or MELT for short) are the essential data types of observability.- New Relic [23]
In event-driven architectures, where actions are asynchronous and consistency is eventual, MELT becomes indispensable for piecing together fragmented telemetry data. Traces, in particular, are crucial because they connect spans, showing how one event sets off a chain reaction across multiple services. This interconnected view helps teams understand system behaviour more clearly and speeds up incident resolution.
Impact on System Performance and Troubleshooting
Each MELT component contributes uniquely to diagnosing and resolving issues. Metrics serve as the first line of defence, offering a quick snapshot of trends like increased error rates or sudden drops in throughput. Events add context by linking these changes to specific actions, such as a recent deployment or a surge in user activity. Logs provide granular error details, while traces illuminate the request's journey, identifying delays or bottlenecks in specific services.
For example, if metrics reveal a spike in error rates, you can check events to determine if a recent deployment aligns with the issue. Logs will then help you pinpoint the exact error, and traces can identify which service in the chain is malfunctioning.
Leveraging and correlating all four MELT pillars enables faster anomaly detection, root-cause analysis, and proactive system optimisation, empowering teams to maintain reliability and reduce mean-time-to-resolution.- Austin Chia, Data Analyst, Splunk [24]
Ease of Measurement and Actionable Insights
To effectively implement MELT, structured logging (e.g., JSON) ensures machine-readability, while proper trace context passing allows services to share correlation identifiers. This makes it possible to reconstruct a transaction's path through your system. Metrics are storage-efficient, with data that can be aggregated over time (e.g., from minute-by-minute to hourly summaries). Logs, on the other hand, can quickly consume storage and may require shorter retention periods.
For high-frequency data, rely on metrics, while events are better suited for detailed, discrete actions. Use sampling for traces to capture enough data for meaningful analysis without overloading storage. By integrating MELT data across distributed systems, organisations can streamline troubleshooting and gain actionable insights. For expert advice on implementing these practices, visit Hokstad Consulting (https://hokstadconsulting.com).
7. Distributed Tracing and Event Correlation
Relevance to Event-Driven System Monitoring
Event-driven architectures rely on asynchronous communication, where producers send events and move on without waiting for confirmation. This makes tracking the lifecycle of an event particularly tricky. Distributed tracing steps in to provide a clear, end-to-end view of how events travel through producers, brokers, and consumers [15].
An EDA's asynchronous communication pattern means that Service A publishes an event and then continues to perform subsequent actions, completely unaware of whether or not the event was properly routed or consumed.- Datadog [15]
The backbone of distributed tracing is event correlation. By embedding a standardised correlation ID (trace identifier) into event metadata, you can link scattered logs, metrics, and spans back to a single transaction. This method uncovers the cause-and-effect relationships hidden within a system [15]. Without this correlation, logs often lack the context needed to determine their origin, making troubleshooting a daunting task [27]. This approach ties in seamlessly with monitoring frameworks discussed earlier and is vital for identifying issues quickly.
Impact on System Performance and Troubleshooting
Distributed tracing significantly reduces Mean Time to Resolution (MTTR) by accurately identifying where problems occur. Instead of manually combing through logs across various services, tracing tools generate visual dependency graphs. These graphs illustrate how events flow through loosely connected components, making it easier to spot bottlenecks. For example, you can quickly identify if events are stuck in a queue, experiencing Kafka lag, or being processed too slowly by consumers [15].
Tracing visually pinpoints root causes, reducing investigation time.- AWS Well-Architected Framework [26]
Take Amazon EventBridge as an example. As of February 2024, it processes over 2.6 trillion events monthly [6]. By default, it retries event delivery for up to 24 hours and up to 185 attempts before either dropping the event or sending it to a dead-letter queue [2]. Without distributed tracing, finding the root cause of failures among billions of events would be nearly impossible.
Ease of Measurement and Actionable Insights
Distributed tracing enhances your observability toolkit by connecting metrics, logs, and events, aligning perfectly with the MELT framework. Like the golden signals discussed earlier, tracing provides a direct route to identifying system bottlenecks and inefficiencies.
To implement distributed tracing effectively, standardise event specifications. Use frameworks like CloudEvents to ensure each message includes essential metadata such as a correlation ID, source, and timestamp [15]. This standardisation complements metric-based monitoring strategies and strengthens your overall observability approach. Instrument your application code and middleware components - such as event buses, gateways, and storage systems - to capture a comprehensive performance profile [26].
For offline scenarios, test events can help identify stalling issues [4].
The industry’s shift towards OpenTelemetry is worth noting. This vendor-neutral standard supports exporting traces to backends like Jaeger or Zipkin [25]. It ensures consistency in telemetry collection across your infrastructure while avoiding vendor lock-in. For detailed guidance on implementing distributed tracing in event-driven systems, visit Hokstad Consulting (https://hokstadconsulting.com).
8. Topic and Consumer Metrics
Relevance to Event-Driven System Monitoring
Topic and consumer metrics are essential for monitoring the performance of event-driven systems, especially when it comes to brokers and consumers. Topic metrics help evaluate the health of a message broker by tracking factors like incoming and outgoing byte rates, message counts, and partition performance [13]. On the other hand, consumer metrics focus on downstream event processing, assessing parameters such as consumer lag (the gap between produced and processed messages), fetch rates, and invocation success rates [18].
Event-driven architectures, with their asynchronous nature, present a unique challenge: producers don’t receive immediate feedback about the success of target invocations. This makes metrics indispensable for ensuring reliable execution of business logic. For context, Apache Kafka has emerged as the go-to solution for data streaming, with over 80% of Fortune 500 companies depending on it [28]. These metrics are critical for assessing overall system performance and identifying delays in consumer processing.
Impact on System Performance and Troubleshooting
Consumer metrics play a key role in identifying bottlenecks, complementing error and latency data discussed earlier. Consumer lag is particularly important - it indicates when consumers are falling behind producers. Tools like OffsetLag (for Kafka) or IteratorAge (for Kinesis) can help pinpoint these delays [18]. In large-scale systems, even small inefficiencies can quickly escalate. For example, events may be retried up to 185 times over a 24-hour period before being routed to a dead-letter queue [2][6].
Metrics like SuccessfulInvocationRate (Successful Invocations ÷ Total Invocation Attempts) are useful for identifying misconfigured targets. A rise in RetryInvocationAttempts might signal that a target resource is struggling to keep up, while tracking IngestionToInvocationSuccessLatency can expose performance issues even if no explicit errors are reported [2][6].
Ease of Measurement and Actionable Insights
By analysing these metrics, you can fine-tune broker and consumer configurations to improve system responsiveness. For example, in Kafka clusters, maintaining an ActiveControllerCount of exactly one is crucial - any deviation could indicate control plane issues [13]. If the fetch rate is high but the average fetch size is low, adjusting fetch.min.bytes and fetch.max.wait.ms can help reduce the broker’s CPU load [28]. Additionally, Kafka’s default replica.lag.time.max.ms is set to 30 seconds; exceeding this limit removes a follower from the in-sync replica pool [13].
Dead-letter queues are another important tool. Configuring them for each rule target ensures failed events are captured for further analysis. Metrics like InvocationsSentToDlq can help identify recurring delivery failures that may need manual resolution [2][6].
Comparison Table
The Four Golden Signals and the RED method are two well-known monitoring frameworks, each with a distinct focus. The RED method - Rate, Errors, and Duration - can be seen as a subset of Google's Four Golden Signals, which include Latency, Traffic, Errors, and Saturation. The main difference lies in the omission of Saturation in the RED method - a crucial metric for event-driven systems that helps identify resource limitations and potential backlogs [29][32][30][1].
Tom Wilkie, VP of Product at Grafana Labs, highlights the RED method's emphasis on user experience:
The RED Method is a good proxy to how happy your customers will be. If you've got a high error rate, that's basically going through to your users... If you've got a high duration, your website is slow[30].
On the other hand, Stephen Watts from Splunk points out its limitations:
The RED Method is primarily suited for request‐driven applications and services. It might not provide comprehensive insights for batch processing or streaming applications[29].
This contrast underscores why the Four Golden Signals may provide a broader perspective, particularly for event-driven systems where asynchronous communication and resource management are critical. The table below outlines the differences between these frameworks and their relevance to event-driven architectures.
| Feature | Four Golden Signals | RED Method | Application to Event-Driven Systems |
|---|---|---|---|
| Metrics | Latency, Traffic, Errors, Saturation | Rate, Errors, Duration | RED is a subset; Golden Signals include Saturation for resource tracking |
| Focus | System and user health | Service/request performance | RED centres on event lifecycles; Golden Signals track resource usage |
| Latency/Duration | Time to serve a request | Time taken for a request | For event-driven systems, this is measured as end-to-end latency across asynchronous hops [1] |
| Traffic/Rate | Demand placed on the system | Number of requests per second | In event-driven systems, this reflects the rate of events produced or consumed [1] |
| Saturation | Included (tracks resource fullness) |
Not included | Essential for monitoring message backlogs and consumer lag [1] |
| Best Use Case | General distributed systems | Microservices/request-driven applications | RED is simpler for user-facing services; Golden Signals excel in capacity planning [29][30] |
To maximise monitoring effectiveness, combining these frameworks can be a practical solution. RED focuses on user experience, while the Four Golden Signals (or similar methods) provide insights into system capacity and resource management. For event-driven architectures, Saturation metrics like consumer lag and queue depth are essential to avoid bottlenecks. By integrating RED with methods like the USE method or direct Saturation tracking, organisations can achieve a balanced approach to monitoring both user-facing performance and backend resource constraints [30][31].
Conclusion
Tracking the performance of event-driven systems requires careful attention to a variety of metrics. As Stefano Mazzone from Datadog explains:
Observability in EDAs goes beyond traditional monitoring, offering a multi-dimensional view of a system's state through metrics, logs, and traces[34].
The asynchronous nature of these systems means that event producers often lack direct feedback on whether their events are being processed successfully. This makes comprehensive monitoring absolutely essential [6]. It also requires pulling together data from multiple sources to achieve full visibility into the system.
Each type of data serves a specific purpose: metrics help identify patterns and flag anomalies, traces uncover bottlenecks in distributed workflows, and logs provide the fine-grained context needed for debugging [1][3]. Relying on just one of these can leave you with blind spots. For example, a 0% error rate might seem ideal, but it could actually indicate a complete absence of traffic [7]. Similarly, focusing only on error metrics while ignoring saturation data could leave you unprepared for failures caused by resource limits, such as a queue or CPU nearing capacity [7].
The AWS Well-Architected Framework underscores the importance of this broader view:
Observability is more than just collecting metrics... It's about having a holistic understanding about your workload's behaviour[33].
By combining metrics, latency, saturation, and distributed tracing, teams can distinguish between total failures and performance dips [6][2]. However, putting this into practice often requires both expertise and a cultural shift within the organisation.
Building effective monitoring frameworks is no small task. It demands specialised knowledge and often a move toward a DevOps mindset [34]. Challenges like service discovery, maintaining data consistency, and securing distributed systems can be complex, but professional guidance can make a big difference. For example, Hokstad Consulting provides tailored support to help organisations address these hurdles.
Under the shared responsibility model, cloud providers handle infrastructure availability, but monitoring and responding to workload-specific issues remain the organisation's responsibility [6]. Expert assistance can not only reduce mean time to resolution but also ensure that monitoring practices are robust enough to handle the complexities of asynchronous architectures, protecting system health and operational efficiency.
FAQs
What is the difference between the Four Golden Signals and the RED method in monitoring event-driven systems?
The Four Golden Signals and the RED method each prioritise different metrics and cater to distinct use cases.
The Four Golden Signals, part of Google’s SRE practices, focus on latency, traffic, error rate, and resource saturation. This framework gives a well-rounded view of system health, making it especially helpful for monitoring large, distributed systems with multiple layers and components.
In contrast, the RED method zeroes in on rate (requests per second), errors (failed requests), and duration (latency). Its streamlined approach is tailored to request-driven microservices, where handling user requests efficiently is the top priority.
While both aim to simplify monitoring and boost reliability, the Four Golden Signals provide a wider lens for evaluating overall system performance, whereas the RED method delivers a focused solution for microservice-heavy environments.
Why is distributed tracing important in event-driven systems?
Distributed tracing plays a key role in event-driven systems by offering a detailed look at how requests move through various services. This level of insight allows teams to identify sources of delays, locate bottlenecks, and spot failures in complex, asynchronous setups.
By mapping out how components interact, organisations can fine-tune system performance, enhance reliability, and cut down on the time spent troubleshooting. This becomes particularly important in large-scale architectures, where isolating issues without detailed traces can be a daunting task.
How does the MELT framework improve observability in event-driven systems?
The MELT framework brings clarity to event-driven systems by focusing on four essential types of telemetry data: Metrics, Events, Logs, and Traces. These elements work together to provide a well-rounded view of system performance and behaviour.
- Metrics: These capture numerical trends over time, like latency, throughput, or error rates, helping you monitor overall performance.
- Events: These log specific actions or occurrences at precise moments, offering insight into key system activities.
- Logs: These are detailed records that provide context about what’s happening inside the system, making it easier to understand issues.
- Traces: These map the flow of requests across distributed components, showing how different parts of the system interact.
By leveraging all four data types, organisations can pinpoint performance issues, uncover dependencies, and identify failure points. This integrated approach not only aids in real-time problem detection and root cause analysis but also supports ongoing system improvements. It’s an essential tool for navigating the complexities of event-driven architectures.