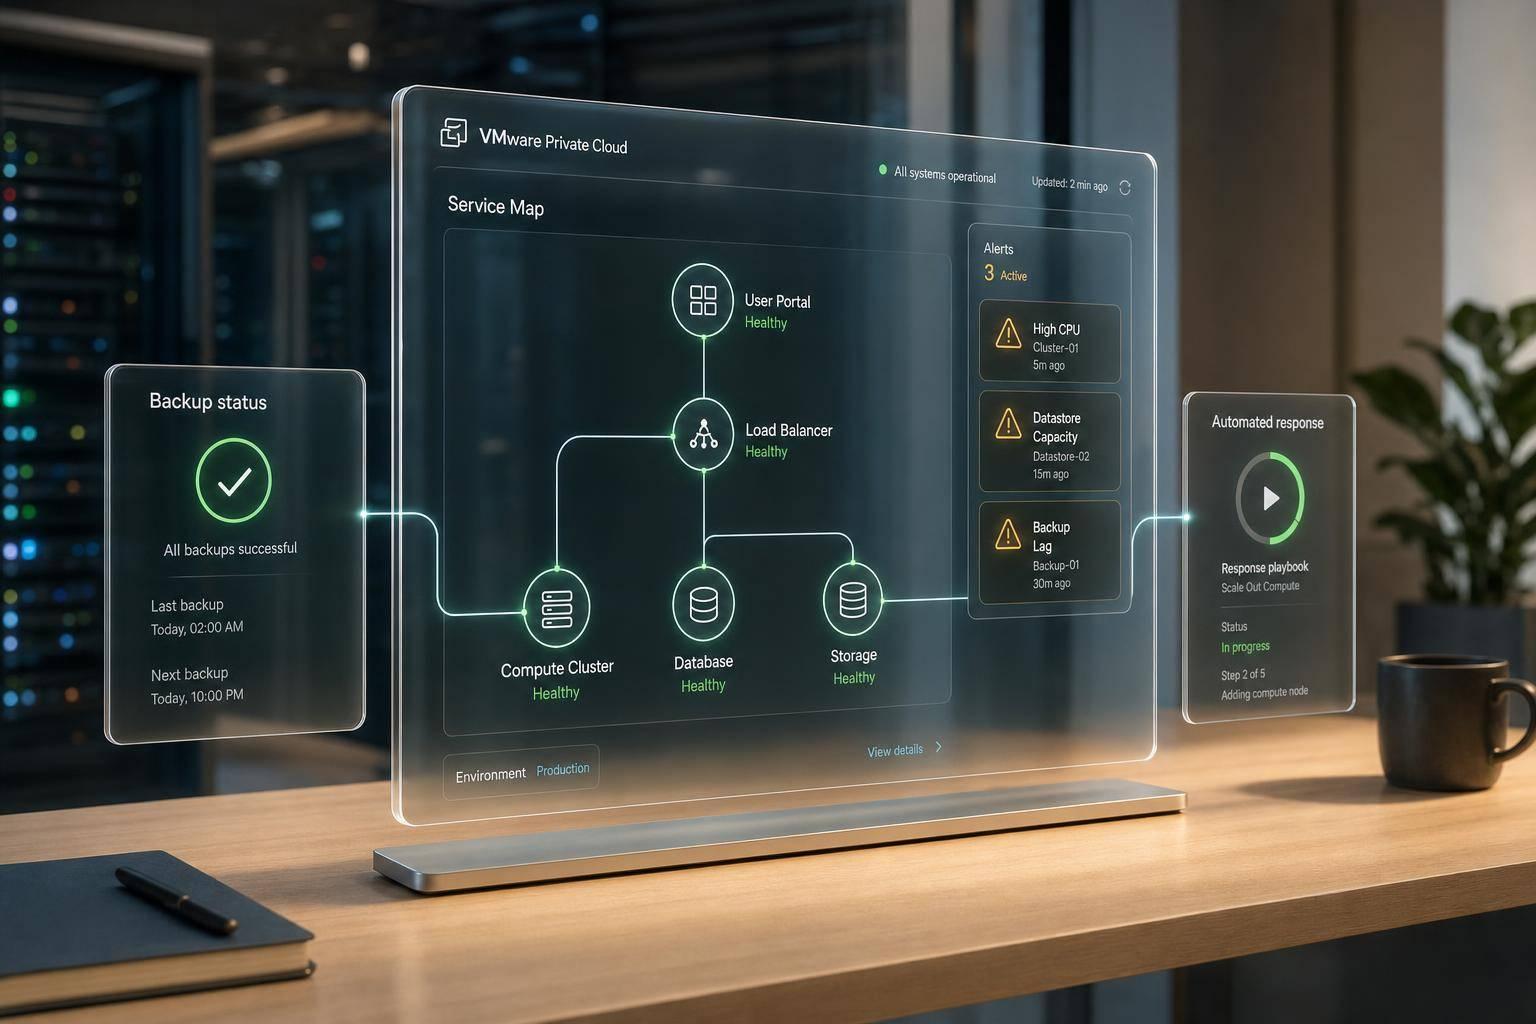
If VMware alerts do not link to jobs, service impact, and response steps, I end up with noise instead of action.
What I take from this is simple: I should watch a small set of VMware signals, sort them into informational, warning, and critical alerts, link them to backup and replication job status, map them to business services, and send them into automated response flows. That cuts delay, trims duplicate tickets, and helps stop faults from sitting until users report them.
At a glance, the model comes down to this:
-
Watch the right signals
-
Set clear alert tiers
- Informational: expected events such as maintenance windows or certificate expiry 60–90 days out
- Warning: early signs such as datastore free space below 20% or CPU ready time climbing
- Critical: faults such as host disconnects, high datastore latency, or vCenter API outage
-
Filter out known noise
- Suppress expected backup-related storage alerts during 01:00–04:00 Europe/London
- Escalate if a critical alert is not acknowledged within 5–10 minutes
-
Track job health, not just platform health
- Monitor Success, Warning, Failed, Running, and No status update
- A missing status can point to API issues, expired credentials, or a broken integration
- One cited analysis found about 15% of 775 million jobs failed
-
Use service maps to show impact
- Link VMs, datastores, and network segments to the services they support
- This helps me see whether a fault hits production, internal, or test workloads
-
Turn alerts into actions
- Validate host failures before acting
- For datastore pressure, check whether snapshots, logs, or raw capacity are the cause
- Retry failed backup jobs when the fault looks temporary
- Group related alerts into a single incident instead of creating several tickets
-
Keep governance tight
- Review thresholds and routing rules at least monthly
- Match out-of-hours routing to the current on-call rota
- Log every automated step for audit needs, especially in UK regulated sectors
This article is, in effect, a plan for moving from monitoring to response: fewer alerts, better routing, clearer ownership, and more action while the issue is still small.
The VMware signals that should drive monitoring and alerting
Trying to monitor everything in a VMware private cloud sounds safe, but in practice it just creates noise. The better approach is to track a small set of signals for each layer of the stack, with each metric tied to a clear operational choice. Those are the signals that should feed alert tiers, job correlation, and automated response.
Host, VM, datastore, and vCenter health signals
At the ESXi host level, focus on connection state, CPU utilisation, memory pressure through ballooning, swapping, and compression, network packet drops, and storage latency. If a host suddenly shifts to not-responding or disconnected, that should trigger an immediate critical alert. CPU utilisation that stays above 80–85% across a host or cluster is a solid early sign of contention.
For VMs, CPU ready time is often the clearest sign of hypervisor-level contention. If it rises above 5–10% during peak hours, it needs attention, especially for latency-sensitive workloads such as trading platforms or NHS clinical systems. Match that with memory ballooning and virtual disk latency if you want a better view of user impact.
Datastore signals should include free space in both percentage terms and absolute GiB, read and write latency in ms, IOPS, and throughput. A sudden latency spike usually points to a storage or network fault. These signals should also kick off checks on backup, replication, or VM placement. It’s also worth watching /storage/db and /storage/log on vCenter, not just the root filesystem. A log partition can fill up quietly and break services while the top-level disk check still looks fine [1].
vCenter health needs direct checks for certificate expiry, API reachability, and service restarts. API reachability and certificate expiry matter because they can stop automated remediation and incident routing in their tracks. If the vCenter API drops during core hours, orchestration is effectively offline. Use Europe/London timestamps for all vCenter events so they line up with UK shifts and change windows.
| Layer | Key signals | Unit / format |
|---|---|---|
| ESXi host | Connection state, CPU utilisation, memory ballooning/swapping, packet drops | %, GiB, ms |
| VM | CPU ready time, co-stop (vCPU scheduling delay), memory ballooning/swap rate, disk latency | %, ms |
| Datastore | Free space, read/write latency, IOPS, throughput | GiB, %, ms, MiB/s |
| vCenter | API reachability, certificate expiry, service restarts, /storage/* partition usage |
Days, HTTP status, GiB |
Use this set to cut out low-value metrics and send through only alerts that support a real decision.
Tiered alerting that cuts noise and flags urgent faults
Split alerts into three tiers, with each one tied to a clear level of business impact.
- Informational alerts cover expected change, such as a host entering a scheduled maintenance window or a vCenter certificate still 60–90 days from expiry. These should be logged and visible, but not paged.
- Warning alerts show that margins are tightening, like datastore free space dropping below 20%, CPU ready time climbing during business hours, or a single vCenter service restart. These can be handled in normal working hours.
- Critical alerts mean user-facing services are likely already affected. Examples include an ESXi host disconnecting without warning, datastore latency moving beyond agreed thresholds, or the vCenter API going dark. These alerts should go straight into escalation and automation, not just paging.
Suppression rules are what make this work day to day. Backup jobs running between 01:00 and 04:00 Europe/London will naturally drive up datastore throughput and latency. Suppress those alerts during that window, and only promote them if they continue beyond the expected period or start affecting primary workloads. Keep suppression rules time-bound, documented, and reviewed after incidents.
Escalation paths finish the job. If a critical alert is not acknowledged within 5–10 minutes, it should route automatically to a secondary engineer or duty manager. That logic belongs in the incident management tool, with timings set to match Europe/London shift patterns.
With the signal set fixed, the next step is correlating job status and service impact.
How job status alerts and service maps close visibility gaps
::: @figure 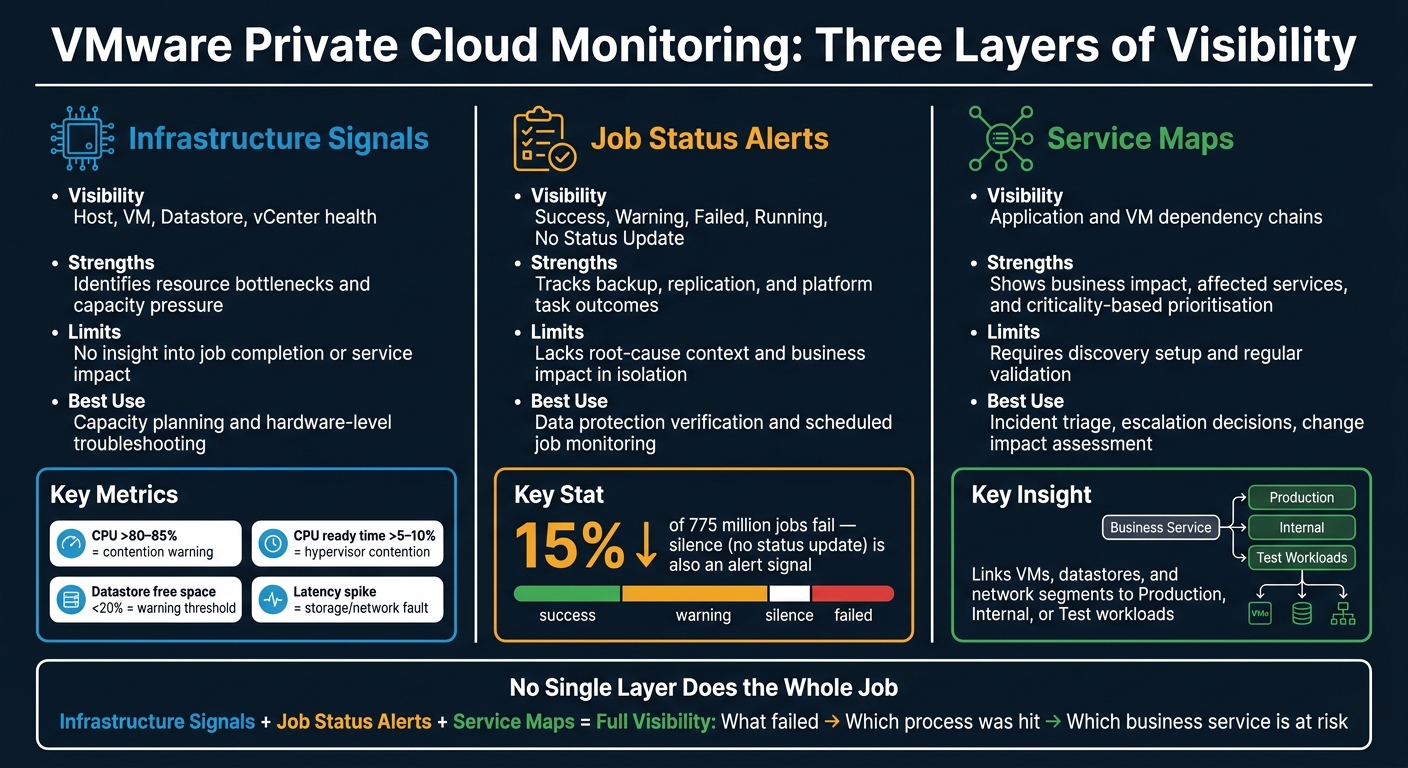 {VMware Private Cloud Monitoring: Infrastructure Signals vs Job Alerts vs Service Maps}
:::
{VMware Private Cloud Monitoring: Infrastructure Signals vs Job Alerts vs Service Maps}
:::
A vSphere cluster can look perfectly healthy on the surface and still hide a mess underneath. Hosts may be up, datastores may look fine, and vCenter may show green across the board. But that still doesn't tell you whether backups finished, replication ran, or scheduled jobs completed as planned. Infrastructure health shows platform condition. It does not show service impact. That gap is exactly where job alerts and service maps matter.
And this isn't a niche problem. One analysis of 775 million jobs found that roughly 15% fail [5]. That’s a lot of missed backups, stalled replications, and platform tasks that quietly go off track. In practice, these three views help teams sort alerts into three buckets: what should wake someone up, what can wait, and what should trigger an automated fix.
Backup and replication job alerts linked to VMware health
Job monitoring should track five states:
- Success
- Warning
- Failed
- Running
- No status update
That last one often gets missed, and it shouldn't. If a job stops reporting, the silence may point to a broken integration, an expired credential, or an API interruption. In other words, the job may not have failed in the usual sense, but something is still wrong. So alert on both failure and silence.
This gets far more useful when job alerts are tied to VMware health signals instead of sitting in a silo. A failed backup job at 03:00, by itself, tells you very little. Add context, and the picture changes fast. If datastore pressure shows up at the same time, storage capacity is a likely cause. If only jobs going through one backup proxy are failing, the fault may sit with network reachability, credential expiry, or a service outage on that proxy.
That’s the point: job alerts show the failing control point, not just the failed task. When alerts are grouped by time, affected cluster, datastore, or management interface, teams can cut diagnosis time and avoid the usual knee-jerk reaction of re-running jobs before the root issue is fixed. That extra context makes routing and remediation far more dependable.
Service maps that show which applications are actually affected
Infrastructure alerts tell you what is degraded. Service maps tell you who feels it.
A service map links VMs, datastores, and network segments to the services that rely on them. So when you see a CPU spike or datastore latency alert, you can tell straight away whether it touches production, internal, or test services.
Tools such as VMware Aria Operations can automatically discover multi-tier application structures - for example, identifying IIS web servers communicating with SQL Server databases - and map those dependencies to underlying VMs [2][4][3]. During an incident, that saves time in a very direct way. If one datastore is under pressure, the map shows every application tier sitting on it. That makes it much easier to judge whether you're looking at a routine issue or something that needs urgent escalation.
It also cuts down duplicate effort. When several alerts come from one shared dependency, teams can treat them as one focused investigation instead of launching separate parallel checks. Just as important, service maps show whether an alert affects live services or only non-production workloads. That difference shapes priority fast.
Comparison table: infrastructure signals, job alerts, and service maps
Each layer answers a different question. The table below shows where each one helps most, and where it falls short on its own.
| Layer | Visibility | Strengths | Limits | Best use |
|---|---|---|---|---|
| Infrastructure Signals | Host, VM, datastore, and vCenter health | Identifies resource bottlenecks and capacity pressure | No insight into whether jobs completed or which services are affected | Capacity planning and hardware-level troubleshooting |
| Job Status Alerts | Success, Warning, Failed, Running, no status update | Tracks backup, replication, and platform task outcomes | Treated in isolation, they lack root-cause context and business impact | Data protection verification and scheduled platform job monitoring |
| Service Maps | Application and VM dependency chains | Shows business impact, affected services, and prioritisation by service criticality | Requires discovery setup and regular validation to stay accurate | Incident triage, escalation decisions, and change impact assessment |
No single layer can do the whole job. Infrastructure signals without job alerts leave protection gaps hidden. Job alerts without service maps turn prioritisation into guesswork. Service maps without low-level telemetry show impact, but not the fault underneath. Put the three together and teams get the full view: what failed, which operational process took the hit, and which business service may now be at risk.
The next step is to turn those linked alerts into response flows.
Turning alerts into automated incident response flows
Once infrastructure, job, and service-impact alerts are linked, the next step is to run the right runbook automatically. An alert only becomes a response when a runbook can validate it, send it to the right place, and do something useful with it.
Runbooks for host failure, datastore pressure, and failed jobs
Start with three or four alert types that happen a lot, then build a clear runbook for each one.
For host disconnects or HA alarms, the first step is validation. Is the host actually down, or is it just unreachable from vCenter? The workflow checks whether the management IP responds, confirms maintenance mode status, and verifies whether HA has already restarted affected VMs on other hosts. If HA has already brought the VMs back and capacity is still safe, the runbook opens an ITSM ticket for hardware investigation and routes it to the infrastructure team. If capacity is tight, the flow can trigger DRS rebalancing or shut down non-critical VMs before it escalates.
For datastore pressure, the response should change with severity. A warning should trigger a trend review. A critical alert should trigger automated cleanup or Storage vMotion, then escalation if the problem stays in place. Before the workflow acts, it checks whether the spike comes from a snapshot, log growth, or a plain capacity shortfall. If those automated steps fail, it raises a high-priority ticket [7].
Failed backup jobs should use the same rhythm: detect, validate, remediate, escalate. If the failure looks transient, retry it automatically. If retries fail, or if the job protects a critical service, open a high-priority incident with logs and error codes attached. The runbook should also check whether the backup failure lines up with an active datastore or host alert, so incidents are linked instead of duplicated.
Cross-system routing, escalation, and remediation
VMware, backup, and storage signals should feed into one central event layer that de-duplicates related alarms into a single incident. If a host goes down, several VM alarms fire, and a batch of backup jobs fail at the same time, that's one incident, not three. Doing this at ingestion stops alert storms from swamping the on-call team.
From there, service-map context should route the incident to the team that owns the affected application, not just the bit that failed underneath it. On-call links can then page the right engineer based on rota and severity. Orchestration tools such as VMware Aria Automation Orchestrator can run approved actions - host maintenance, power operations, and snapshot cleanup - and write the results back to the ITSM ticket [6][7][8]. Every step is logged automatically, which matters a great deal for UK organisations in regulated sectors where audit trails are mandatory.
Comparison table: manual response vs automated workflows
| Aspect | Manual response | Automated workflows |
|---|---|---|
| Response time | 15 minutes to 4 hours (business hours only) | 30 seconds to 5 minutes (24/7) |
| Consistency | Variable; depends on individual engineer and shift | High; same steps executed every time |
| Staffing effort | High; scales linearly with incident volume | Low; engineers focus on complex decisions |
| Auditability | Relies on manual ticket notes; prone to gaps | Structured logs generated at every step |
Automation only works when governance sets out which actions can run without approval. The next design issue is deciding how much authority each workflow should have, and what governance needs to sit around it.
Governance, optimisation, and where consulting support fits
Once alerts are tied to jobs, services, and response flows, governance is what keeps the whole setup in good working order. As workloads, clusters, and integrations shift, alerting has to shift with them. Alert policies should be treated as live documents, not rules you set once and forget. Review critical thresholds and routing rules at least once a month, and check them straight away after any major platform change. In fast-moving environments, weekly tuning may make sense during stabilisation. It’s also smart to clone default vRealize Operations alerts before changing them, so the baseline and audit trail stay intact [9][10][11].
Each alert should have a clear owner, severity, response time, and required action. That sounds simple on paper, but it only holds up when routing and tuning still match current shift patterns and service priorities.
Rota-based routing matters a lot for UK operations. Out-of-hours alerts should go to the on-call engineer only when there’s an actual service impact. Routing rules need to match today’s rota, not the staffing setup from the day the platform was first built.
Threshold tuning also needs a steady hand. Use dynamic baselines, wait cycles, and incident consolidation to cut false positives without masking real faults. The aim is simple: fewer alerts, better alerts.
When teams need help turning that governance into AI-assisted operations, outside support can speed things up. Hokstad Consulting supports AI strategy, AI implementation, and workflow automation. In VMware private cloud operations, that might mean:
- designing enrichment logic that turns raw telemetry into context-aware recommendations
- building AI agents that handle alert triage and classification
- linking incident workflows to remediation steps that still depend on manual judgement
Conclusion: key design points for a workable monitoring model
A workable VMware private cloud monitoring model rests on four layers: vSphere signals, job alerts, service maps, and automated incident flows. The result is faster response, lower overhead, and fewer missed incidents.
FAQs
How do I choose the right VMware alert thresholds?
Choose thresholds that strike the right balance between sensitivity and alert fatigue. Start with the metrics that matter most: system health, response times, and error rates.
Use static thresholds where limits are fixed, such as disk capacity. For workloads that shift over time, dynamic or percentile-based thresholds usually make more sense.
Before rolling out new policies fully, test them in audit mode for several weeks. Then review the results and fine-tune the settings on a regular basis.
It also helps to use graded alerts for different severity levels, so teams can tell at a glance what needs urgent attention and what can wait. Add stabilisation windows as well, which can cut down on notifications caused by short-lived spikes.
What should be automated first in incident response?
Start with basic monitoring and alerting. Think threshold-based reports and notifications that confirm backups completed as expected. It’s a simple place to begin, but it gives teams confidence and sets the stage for more advanced workflows later on.
Then focus your automation work where the stakes are highest: high-risk systems, core business services, strict service-level agreements, and any manual deployments or ad-hoc scripts sitting inside your CI/CD pipeline.
How do service maps improve alert prioritisation?
Service maps help teams sort alerts by showing how services depend on each other through topology analysis. That gives responders the context to spot the root cause of an incident, instead of chasing every downstream symptom as if it were a separate problem.
With that view in place, systems can suppress non-critical or duplicate alerts triggered by a main service failure. The result is less alert noise and a clearer focus on the issues that hit the business hardest.