
Continuous Integration and Continuous Deployment (CI/CD) performance is about delivering software quickly and reliably. There are five key metrics to track:
- Deployment Frequency: Measures how often updates are pushed to production. High-performing teams deploy multiple times daily, while slower teams may release every few months.
- Lead Time for Changes: Tracks the time from code commit to production. Elite teams achieve this in under an hour; others may take weeks or months.
- Change Failure Rate (CFR): Indicates the percentage of deployments causing failures. Top teams keep this under 15%.
- Mean Time to Restore Service (MTTR): Reflects recovery speed after failures. Faster recovery (under an hour) ensures stability and reduces downtime.
- Pipeline Duration: Tracks how long it takes to process a code change through the pipeline. Shorter durations improve feedback loops and efficiency.
Tracking these metrics helps identify bottlenecks, improve reliability, and boost developer productivity. For UK organisations, optimising CI/CD can cut IT costs by 22% and increase productivity by 30%. Tools like automated testing, feature flags, and observability platforms can support these improvements.
::: @figure 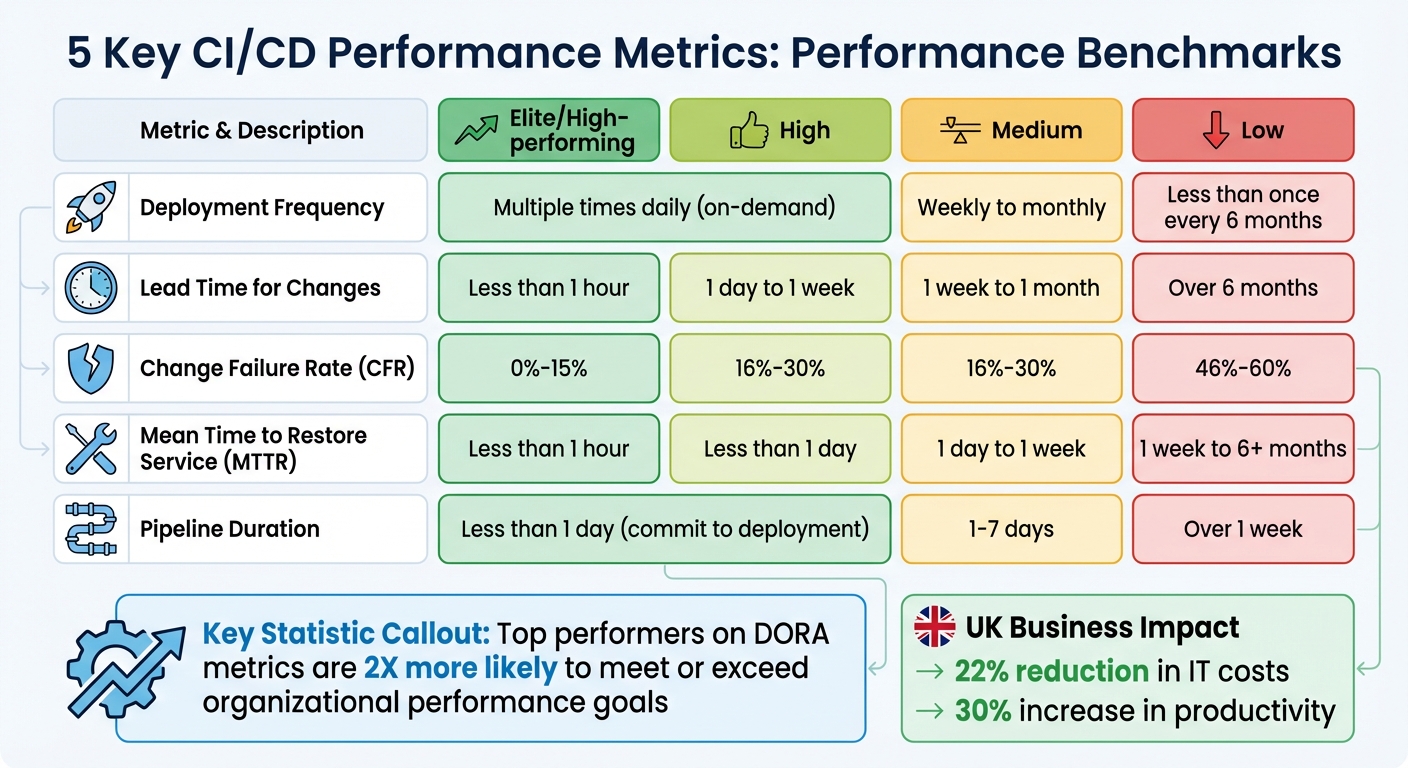 {CI/CD Performance Metrics Benchmarks by Team Performance Level}
:::
{CI/CD Performance Metrics Benchmarks by Team Performance Level}
:::
What CI/CD Metrics Indicate Performance Capacity?
1. Deployment Frequency
Deployment frequency tracks how often your team successfully pushes code into production. High-performing teams deploy on-demand, while lower-performing teams may release updates less than once every six months [5][2]. This metric reflects how efficiently your organisation can translate ideas into live software.
Impact on Speed and Stability of CI/CD Pipelines
Frequent deployments don’t mean sacrificing stability. Smaller, regular updates make testing, debugging, and rollbacks much easier. On the other hand, large, infrequent releases can lead to chaotic fire drills
and unpredictable operations, complicating recovery efforts [3][6].
The real trade-off, over long periods of time, is between better software faster and worse software slower.
- Dave Farley, author of Modern Software Engineering [6]
Frequent deployments create rapid feedback loops, allowing developers to catch and resolve issues early. This approach prevents bugs from piling up and turning into larger problems.
Boosting Developer Productivity
Higher deployment frequency can significantly enhance developer productivity. For example, in June 2025, Onefootball’s engineering team migrated to Kubernetes and adopted New Relic’s observability platform. By tracking deployment impacts and application performance, they cut incidents by 80% and freed up 40% of developer time previously spent troubleshooting [8].
Breaking down features into smaller, manageable updates reduces cognitive load and helps developers stay focused [3]. High-performing teams aim for success rates above 90% on their main branch [7] and ensure at least 90% of defects are identified before production [2]. To achieve this, teams can:
- Implement trunk-based development
- Use feature flags to separate deployment from release
- Automate testing with Infrastructure as Code [2][8]
These practices not only save time but also support broader DevOps transformation efforts.
Relevance to DevOps Transformation Goals
Increasing deployment frequency does more than improve productivity - it drives organisational agility. This metric acts as a key indicator of DevOps maturity, helping pinpoint bottlenecks in the development process, from code repositories to staging and QA [5][9]. It aligns closely with other DevOps maturity goals and organisational objectives.
For businesses looking to refine their CI/CD pipelines and elevate performance, Hokstad Consulting offers tailored DevOps transformation services designed to meet these challenges head-on.
2. Lead Time for Changes
Lead time for changes tracks the time it takes for a code commit to go live in production, covering every step from the developer's initial commit to deployment. Elite teams manage to achieve lead times of less than an hour, high-performing teams fall between 1 day and 1 week, while teams struggling with efficiency can take over six months [5][2].
Impact on Speed and Stability of CI/CD Pipelines
Shorter lead times not only speed up delivery but also improve the reliability of deployments by reducing the scope for defects and making recovery simpler [3][11].
By shortening lead times and making smaller, more frequent deployments, teams reduce the likelihood of introducing defects and simplify error recovery.– CircleCI [3]
Breaking work into smaller increments makes testing easier and allows for quicker production deployments [2][10]. High-performing teams aim to catch at least 90% of defects in pre-production, creating faster feedback loops that enable developers to fix issues while the details are still fresh [2][10].
This combination of speed and stability has a direct, positive impact on the developer workflow.
Ability to Improve Developer Productivity
Long lead times can disrupt a developer's flow, creating bottlenecks and reducing overall pipeline efficiency. These delays force developers to juggle multiple tasks, increasing cognitive load and interrupting focus. On the other hand, efficient lead times allow teams to maintain deep focus by minimising interruptions and streamlining the path from code to production [10][12].
Tracking lead times across build, test, and staging phases can help identify obstacles. Practices like trunk-based development, automated testing, and efficient code reviews can significantly reduce delays [13].
Relevance to DevOps Transformation Goals
As one of the four key DORA metrics, lead time for changes is a critical measure of pipeline efficiency. It highlights areas where work may be delayed, whether from queues or manual approvals [10][12].
Software delivery performance is directly correlated with business performance: top performers on DORA metrics are twice as likely to meet or exceed organisational performance goals.– DORA Team [3]
For UK organisations aiming to shorten lead times and improve DevOps maturity, Hokstad Consulting offers expert services in transformation and automation to drive measurable improvements.
3. Change Failure Rate
Change Failure Rate (CFR) measures the percentage of production deployments that result in failures needing immediate fixes - like rollbacks or hotfixes. The formula is straightforward: (deployment failures / total deployments) × 100 [2]. This metric highlights how often deployments cause problems rather than deliver value, helping teams balance the speed of releases with maintaining quality.
Impact on the Speed and Stability of CI/CD Pipelines
CFR plays an essential role in balancing speed and stability within Continuous Integration/Continuous Deployment (CI/CD) pipelines. While fast deployment cycles can be advantageous, they lose their edge if quality suffers. A high CFR can wipe out the benefits of quick releases. Top-performing teams keep their CFR between 0% and 15%, whereas organisations at the lower end of the spectrum report rates as high as 46% to 60%. That’s a striking difference, with elite teams achieving three times better reliability [14].
A low change failure rate is desirable because the more time a team spends addressing failures, the less time it has to deliver new features and customer value.– Shanika Wickramasinghe, Software Engineer [2]
Frequent failures often lead to emergency fixes, pulling resources away from innovation. On the other hand, teams with lower failure rates usually adopt proactive practices like automated testing and rigorous code reviews, catching most issues before they reach production. High-performing teams aim to catch at least 90% of defects in pre-production environments [2].
| Performance Category | Change Failure Rate | Stability Impact |
|---|---|---|
| Elite | 0%–15% | High stability; frees up time for innovation |
| High | 16%–30% | Strong stability; minimal fixes required |
| Medium | 16%–30% | Moderate stability; frequent fixes needed |
| Low | 46%–60% | Low stability; high risk of disruptions |
Enhancing Developer Productivity
Keeping CFR low doesn’t just improve system stability - it also boosts developer productivity. High failure rates mean more time spent fixing issues, which can lead to frustration and burnout. Tools like automated testing, feature flags (which allow problematic features to be disabled without full rollbacks), and Infrastructure as Code solutions such as Terraform can help teams reduce CFR. Smaller, more frequent deployments also make it easier to test changes and minimise the impact of any single failure [14].
Supporting DevOps Transformation Goals
CFR isn’t just another metric - it’s one of the four DORA metrics that serve as benchmarks for DevOps maturity. By tracking CFR, teams gain valuable insights into areas that need improvement, moving away from guesswork and focusing on data-driven decisions. A low CFR allows organisations to maintain high development velocity while consistently delivering reliable, high-quality software.
For UK-based organisations looking to improve their CFR and advance their DevOps practices, Hokstad Consulting offers tailored expertise in transformation and automation to help teams reach elite performance levels.
4. Mean Time to Restore Service (MTTR)
MTTR, or Mean Time to Restore Service, measures how quickly your organisation recovers from production failures. It’s calculated by dividing the total downtime by the number of incidents [15] [2]. Essentially, this metric reflects how well your team can recover when things go wrong.
While focusing on both speed and stability, MTTR provides insight into your team's ability to restore services efficiently after an incident. It’s a key stability
metric within the DORA framework, complementing speed-related metrics like Deployment Frequency. Elite teams typically recover in less than an hour, high-performing teams take under a day, medium performers range from one day to a week, and low-performing organisations may take anywhere from a week to over six months [2] [8] [15].
Impact on CI/CD Pipelines
MTTR has a direct effect on how much time developers spend resolving issues instead of working on new features. Long recovery times can disrupt team momentum and reduce delivery reliability [13]. Research shows that teams excelling in DORA metrics, including MTTR, are twice as likely to meet or exceed their organisational goals [3].
Looking at DORA metrics like Mean Time to Recovery is a key starting point for teams who want to improve performance, and ensure more fast and stable software delivery.– Nathen Harvey, Developer Advocate at DORA and Google Cloud [15]
Improving MTTR involves practical steps like issuing smaller pull requests, which are easier to review and debug [15] [16]. Teams can also use feature flags to disable problematic features instantly, avoiding the need for a full rollback [8]. Creating incident response playbooks can streamline recovery efforts by reducing the need for on-the-spot decision-making during outages [15] [8]. These strategies tie into earlier discussions on deployment frequency and change failure rates, further enhancing CI/CD pipeline stability.
Impact on Developer Productivity
A long MTTR often signals overloaded teams struggling to resolve issues quickly [15]. When recovery times are inefficient, developers are forced to focus on fixing problems rather than innovating on new features.
| Performance Level | MTTR Benchmark | Impact on Stability |
|---|---|---|
| Elite | Less than 1 hour | Maximum stability; rapid recovery [16] [8] |
| High | Less than 1 day | High stability; minimal disruption [15] [2] |
| Medium | 1 day to 1 week | Moderate stability; potential for downtime [15] [8] |
| Low | 1 week to 6+ months | Poor stability; significant business risks [2] [8] |
Role in DevOps Transformation
MTTR is a critical measure for evaluating DevOps maturity, helping teams transition from reactive problem-solving to proactive, data-driven approaches [17] [11]. By tracking MTTR alongside Mean Time to Detection (MTTD), teams can pinpoint whether delays stem from slow identification or resolution [4]. For organisations in the UK looking to reduce MTTR and enhance their DevOps practices, Hokstad Consulting offers tailored solutions in automation and observability to help teams achieve elite performance levels.
5. Pipeline Duration and Build Efficiency
Pipeline duration refers to the time it takes from a code commit to deployment, serving as a direct indicator of build efficiency. This metric plays a crucial role in delivery speed and system reliability. Shorter durations mean smaller feedback loops, which allow teams to identify and fix bugs more quickly, boosting agility and responsiveness [18]. Efficient pipelines ensure developers get timely feedback, helping them stay focused and avoid the productivity dips caused by frequent context-switching [3].
Impact on Speed and Stability of CI/CD Pipelines
Pipeline efficiency directly affects how quickly teams can deploy changes and how stable their systems remain. Long pipeline durations or bottlenecks, such as high queue times, can slow down Mean Time to Recovery (MTTR) during system outages, delaying critical fixes [13]. Studies reveal that 60% of CI/CD users release code at twice the speed of non-adopters [18], with elite teams aiming for a pipeline duration of less than a day from commit to deployment [13].
However, pipeline instability often comes from flaky tests
- tests that fail unpredictably without actual code issues. These failures can frustrate developers, reduce trust in the pipeline, and lead to manual workarounds that undermine automation [13].
CI/CD pipelines are as critical as production environments and must be monitored to detect delays, failures, and drift before they affect users.– Caitlin Halla, Observability Developer Evangelist, Splunk [13]
Prolonged pipeline durations can also add to technical debt, as teams may resort to quick fixes or ad-hoc scripts that obscure the root causes of issues [13]. A practical solution is to build artefacts once at the start of the pipeline and use the same artefact through staging and production. This approach ensures consistency and saves time. Additionally, adopting reliable deployment practices can further enhance pipeline efficiency [3].
Insights into Cloud Cost Optimisation
Efficient pipelines don’t just improve performance; they can also lead to significant cost savings. Long build times drive up compute costs and influence resource allocation. Optimising pipelines with strategies like parallel execution, caching, and right-sizing instances can help cut these expenses. Automating environment scheduling can eliminate unnecessary idle resource costs, while managing artefact lifecycles and retention policies can keep storage fees under control.
Relevance to DevOps Transformation Goals
Streamlining pipeline duration aligns seamlessly with broader DevOps transformation objectives, such as shifting quality assurance earlier in the process and reducing technical debt [1]. Teams that excel in DORA metrics are twice as likely to achieve or exceed their organisational performance goals [3]. For UK businesses looking to enhance their CI/CD practices, Hokstad Consulting provides tailored optimisation solutions.
Conclusion
These five metrics provide a well-rounded view of your CI/CD performance, addressing both delivery speed and system reliability [2][3]. For example, Pipeline Duration not only reveals efficiency but also uncovers hidden costs that might otherwise go unnoticed.
Software delivery performance is directly correlated with business performance: top performers on DORA metrics are twice as likely to meet or exceed organisational performance goals.- DORA Research [3]
By consistently tracking these metrics, you can establish baselines that make it easier to spot anomalies or gradual performance declines. For instance, increasing build times may indicate growing technical debt. Regular reviews ensure your metrics stay aligned with shifting business priorities and cost-management goals, enabling data-driven decisions that are both practical and strategic.
Throughout this discussion, we've emphasised the importance of balancing speed with stability. Keeping tabs on these metrics not only drives continuous improvement but also highlights areas where focused optimisation can make a real difference.
For UK-based businesses looking to refine their CI/CD processes and cut cloud costs, Hokstad Consulting offers tailored solutions. Their expertise in DevOps transformation and cloud cost engineering combines performance metrics with spending data to uncover potential savings of 30–50%, all without compromising delivery speed. With a No Savings, No Fee
model, a deep understanding of UK compliance, and customised dashboards, they provide targeted strategies to tackle your CI/CD challenges.
Whether you're aiming to set performance benchmarks, enhance observability in your pipelines, or achieve measurable cost savings, a quick 30-minute consultation could help you uncover actionable improvements tailored to your needs.
FAQs
How does improving CI/CD metrics reduce IT costs and enhance productivity?
Optimising CI/CD metrics plays a key role in cutting IT costs by reducing wasted cloud resources like idle CPU and memory. This helps businesses trim operational expenses while ensuring their infrastructure is used more efficiently. Beyond cost savings, well-tuned pipelines lead to faster deployments and higher-quality releases, boosting developer productivity and minimising downtime.
Take this as an example: some organisations have reported deployment speeds improving by up to 75% and a 90% reduction in errors. The result? Smoother workflows and better allocation of team efforts. By zeroing in on these metrics, companies can not only accelerate their delivery of value but also maintain tighter control over their budgets.
How can businesses lower the Change Failure Rate in their CI/CD pipelines?
To lower the Change Failure Rate in CI/CD pipelines, businesses can adopt several effective strategies. Start by using pre-commit hooks to catch potential issues before they make it into the codebase. Pair this with comprehensive automated testing and static code analysis to ensure the quality of the code remains consistently high. Adding real-time monitoring and alerts helps teams quickly detect and address problems as they arise.
Incorporating automated rollback methods, such as blue-green or canary deployments, can make recovering from failures much smoother. It's also crucial to define clear rollback triggers to avoid confusion during critical moments. Lastly, building a collaborative and blame-free team environment encourages learning from mistakes and fosters continuous improvement over time.
Why is measuring Pipeline Duration important for CI/CD performance?
Measuring Pipeline Duration is crucial because it shows how long it takes for a code commit to go from submission to deployment. This metric highlights any delays or bottlenecks in the process, giving teams the chance to optimise workflows and speed up delivery.
Cutting down pipeline duration can lead to shorter lead times, more frequent deployments, and reduced operational expenses. It serves as a vital measure of your CI/CD pipeline's performance, helping pinpoint areas that need attention to boost overall efficiency.