
Serverless memory settings can cut or waste money on every single run. I’d boil the article down to this: set memory from measured usage, not defaults; test 2–3 tiers; and pick the setting that gives the lowest cost per successful invocation while still meeting your p95/p99 latency target.
Here’s the short version in plain English:
- Memory affects more than memory. On AWS Lambda and Google Cloud Functions, more memory often means more CPU too.
- You pay for allocated memory, not actual usage. So a function set to 1,024 MB that only uses 200 MB can leak spend on every invocation.
- More memory can sometimes cost less. If a CPU-heavy function drops from 1.0 s at 512 MiB to 0.35 s at 1,024 MiB, total billed compute can fall.
- This usually does not help I/O-heavy functions. If the function is waiting on APIs or databases, extra memory often just adds cost.
- Check the right metrics first. Look at Max Memory Used, Duration, Billed Duration, Init Duration, and p95/p99 latency.
- Use timeouts to limit waste. For APIs, shorter limits often make sense. For async work, line timeouts up with queue and retry settings.
- Review settings on a schedule. Code changes, traffic shifts, and dependency changes can make old memory values wrong.
A few numbers from the article matter straight away:
- AWS Lambda: 128 MiB to 10,240 MiB
- AWS Lambda timeout: 1 to 900 seconds
- Azure Functions Consumption: about 1.5 GB per instance
- Google Cloud Functions 2nd gen HTTP: up to 60 minutes
- Alert point: about 80% of timeout
- Memory warning level: around 70–80% of configured memory
- API timeout starting point: 1.2–1.5× p99
- Async timeout starting point: 1.5–2× p99
If I were acting on the piece today, I’d do four things first:
- List the top-cost functions in £ per month and £ per 1,000 invocations
- Check memory headroom and p95/p99 duration
- Test a small set of memory tiers under production-like traffic
- Roll out the lowest-cost setting that still keeps latency and errors in line
::: @figure 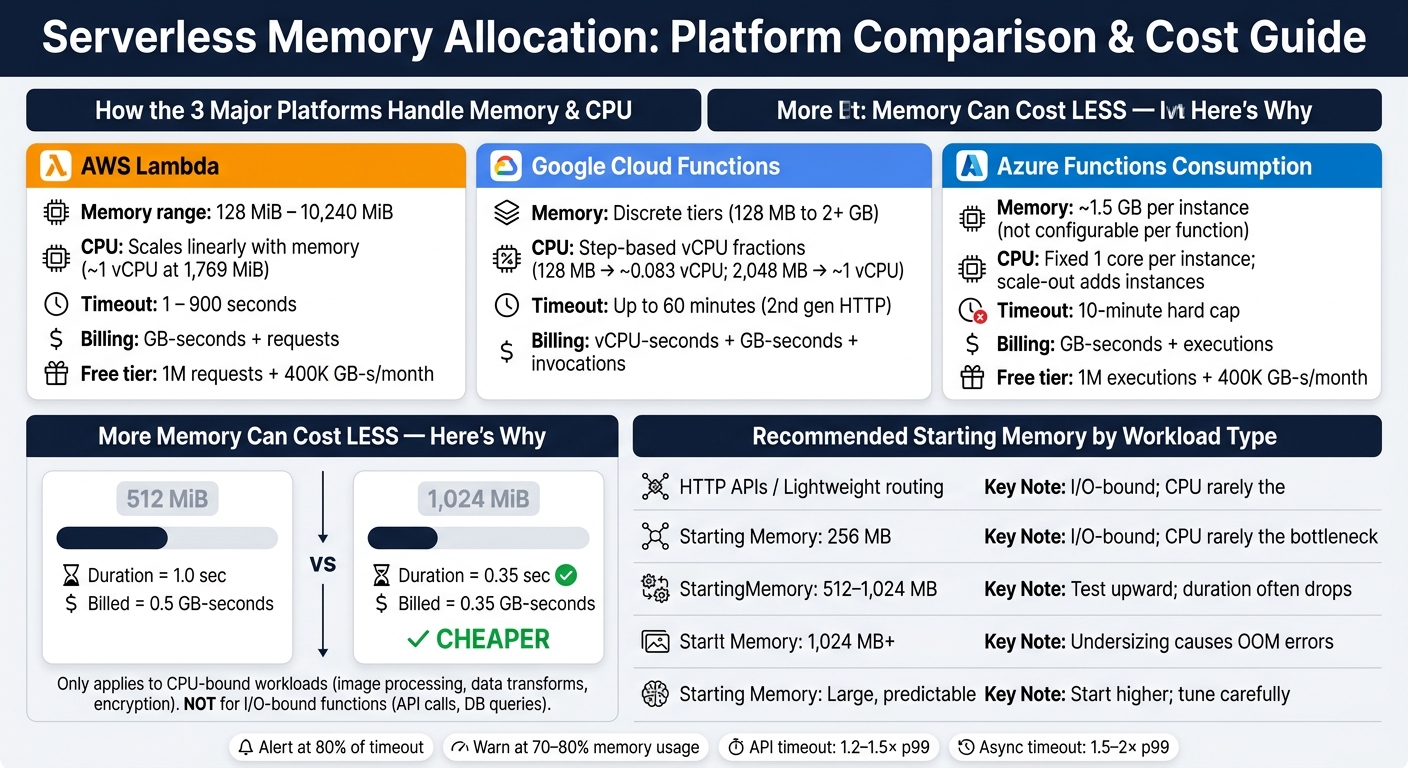 {Serverless Memory Allocation: Platform Comparison & Cost Guide}
:::
{Serverless Memory Allocation: Platform Comparison & Cost Guide}
:::
Optimizing AWS Lambda Performance and Cost for Your Serverless Applications - AWS Online Tech Talks
Need help optimizing your cloud costs?
Get expert advice on how to reduce your cloud expenses without sacrificing performance.
Quick comparison
| Platform | Memory control | CPU link | Billing detail |
|---|---|---|---|
| AWS Lambda | Per function | Yes, scales with memory | GB-seconds + requests |
| Google Cloud Functions | Per function tier | Yes, step-based by tier | GB-seconds, vCPU-seconds + invocations |
| Azure Functions (Consumption) | Not per function | Fixed per instance | GB-seconds + executions |
Bottom line: I wouldn’t treat “lowest memory” as “lowest cost”. I’d treat memory, CPU time, and timeout as one pricing and performance setting, then tune them from data.
How serverless memory, CPU and pricing work
On AWS Lambda and Google Cloud Functions, you can't set CPU on its own. CPU is linked to the memory you choose, so more memory usually means more compute. Azure Functions is different. There, allocation happens at the plan level, not for each function. That's why the same function can sometimes run faster - and even cost less - when you give it more memory.
One of the main billing units in serverless pricing is the GB-second. That means allocated memory in GiB multiplied by execution time in seconds. So if a function has 512 MiB (0.5 GiB) and runs for 2 seconds, you're billed for 1 GB-second. The key point is simple: you pay for the memory you allocated, not the memory the function happened to use. On consumption plans, billing is based on allocated GB-seconds, plus request or execution charges.
These billing rules affect how memory changes your spend. The rounding rules also vary a bit by platform. AWS Lambda rounds to the nearest millisecond, Google Cloud Functions rounds to the nearest 100 ms, and Azure Functions on the Consumption plan bills per second. For very short functions, that small detail can matter a lot.[5][6][3]
| Platform | Memory range (per function/instance) | CPU scaling behaviour | Pricing basis |
|---|---|---|---|
| AWS Lambda | 128 MiB to 10,240 MiB, configurable per function | CPU and bandwidth scale in line with memory; about 1 vCPU at 1,769 MiB | GB-seconds + request charges; free tier: 1M requests + 400k GB-s/month |
| Google Cloud Functions | Discrete tiers (for example 128 MB to 2+ GB), each mapped to a vCPU fraction | vCPU increases in steps; 128 MB → about 0.083 vCPU and 2,048 MB → about 1 vCPU | vCPU-seconds + GB-seconds + invocation charges |
| Azure Functions (Consumption) | About 1.5 GB per instance; not configurable per function | Fixed CPU per instance; scale-out adds instances rather than increasing per-function CPU | GB-seconds + executions; free tier: 1M executions + 400k GB-s/month |
Memory-to-CPU coupling on major platforms
On AWS Lambda, memory and CPU move together in a linear way. At 1,769 MiB, you get roughly one full vCPU.[10] Below that, you get a fraction of a vCPU. Above it, you get more CPU share. Network throughput also rises with memory, which can make a difference when functions handle large payloads.
Google Cloud Functions spells this mapping out clearly. Each memory tier maps to a documented vCPU fraction.[4] Because the model works in steps, moving to the next tier can lead to a clear jump in compute, not just a tiny bump.
Azure Functions on the Consumption plan doesn't give you a per-function memory control at all. Each instance gets about 1.5 GB and one CPU core, and scaling happens by adding more instances instead of giving one function more resources.[12][8] If you want more control, the Premium plan lets you pick instance sizes with up to 4 cores and 14 GB of memory.[13][14]
Why higher memory can reduce total cost
Once the billing model is clear, the next step is to look at runtime. Can more memory cut the bill instead of adding to it? Sometimes, yes.
Higher memory can reduce total cost if it shortens runtime enough. GB-seconds are based on memory × time. So if extra CPU, delivered through a higher memory setting, cuts execution time by a big enough margin, total GB-seconds can drop.
Take a CPU-bound function such as image processing, data transformation, or encryption on AWS Lambda. At 512 MiB, it might run for 1.0 second, which costs 0.5 GB-seconds. At 1,024 MiB, with more CPU available, that same job might finish in 0.35 seconds, costing 0.35 GB-seconds. In that case, the higher memory setting is cheaper, not pricier.[2][4][7]
That pattern usually doesn't hold for I/O-bound work such as API calls or database queries. If the function is mostly waiting for a network response, extra CPU just sits there doing nothing. So when you increase memory, you increase the per-millisecond price without cutting runtime much. That's how the bill starts creeping up.
Timeouts as a cost and reliability guardrail
Timeouts don't go straight into the GB-second formula, but they still matter because they limit waste. If a function stalls because another service is slow, or retries keep spinning, it continues to burn GB-seconds until it finishes or hits its timeout. A sensible timeout puts a lid on that.
AWS Lambda supports timeouts from 1 to 900 seconds.[9][11] Azure Functions on the Consumption plan has a 10-minute cap, and that's a hard architectural limit. If a task honestly needs longer, the answer isn't just to push the timeout up. It usually means redesigning the job with Durable Functions or another service.[15][16] Google Cloud Functions 2nd-gen HTTP functions can run for up to 60 minutes, which gives more room for batch-style workloads.[17][18]
For API functions, shorter timeouts usually make more sense. They cap spend and make failures show up sooner. Use timeouts to limit waste, then check actual runtime data before changing memory.
How to measure real memory requirements before changing settings
Once pricing and timeout behaviour are clear, the next step is simple: look at production metrics before touching memory settings.
The metrics that reveal wasted spend or hidden bottlenecks
AWS Lambda logs already give you most of what you need. You can see Max Memory Used, Memory Size, Duration, Billed Duration and Init Duration, which means you can separate memory pressure from cold starts and plain old latency issues.[25][26][22] In many cases, that's enough to tune memory without extra tooling.[25][1][22]
Max Memory Used is the clearest signal. If a function stays below about 30% of allocated memory most of the time, you're probably paying for more memory than it needs. On the other hand, if usage sits above 80% for long stretches, or you see out-of-memory errors, the function is too small for the job.
Averages can hide the problem. p95 and p99 are more useful, because they show what happens near the edge, when traffic is messy and the function gets close to its timeout.
Cold starts need their own lane. AWS says cold starts usually happen in under 1% of invocations, and they can last from under 100 ms to more than 1 second depending on the runtime, package size and how much work happens during initialisation.[26] If your p99 spikes come from Init Duration instead of execution time, adding memory may not fix much. In that case, the better move is often to shrink the package, use a lighter runtime, or add provisioned concurrency.[25][26]
Use the patterns below to decide what to change next:
| Metric | Observed Pattern | Recommended Action |
|---|---|---|
| Max Memory Used | Consistently < 30% of allocation | Reduce memory - downsize to cut costs without much performance risk |
| Max Memory Used | Sustained use above 80% or OOM errors | Increase memory - prevent crashes and in some cases cut duration through more CPU |
| p95/p99 Duration | Rising or approaching timeout | Increase memory when extra CPU is likely to cut runtime |
| Cold Start Latency | High p99 on cold starts | Refactor code - reduce package size, switch runtime, or use provisioned concurrency |
| Execution Duration | Rising despite stable load | Refactor code - check for inefficient loops, bloated dependencies, or blocking I/O |
| Timeout Count | Frequent timeouts | Increase memory or timeout - check for CPU starvation or slow external dependencies |
| Error Rate | High, especially OOM errors | Increase memory - immediate fix for memory-exhaustion failures |
Using native monitoring and APM tools effectively
Start with the built-in tools. On AWS, CloudWatch Logs Insights lets you query @maxMemoryUsed, @memorySize, @billedDuration and @initDuration directly.[19][21][22] One simple approach is to filter on @type="REPORT" and compare avg(@billedDuration) with percentile(@billedDuration, 95). That gives you a clean view of normal runtime versus tail latency across short time windows.[19][21][22][23]
On Google Cloud Functions, Cloud Monitoring exposes execution_count, execution_times and active_instances as core runtime signals, while error rates can be pulled from Cloud Logging.[27] Azure Functions shows per-instance memory usage, execution metrics and logs through Application Insights, so you can build the same kind of view for memory, duration and timeouts.[24]
Practical memory allocation strategies for cost-effective serverless apps
Once you know what your functions actually use, the next step is to pick the right memory setting on purpose - based on workload type, backed by testing, and checked from time to time so things don’t drift.
Choose memory by workload type, not by default
Use the metrics above to size each function by what it does, not by team habit.
One of the biggest slip-ups teams make is using one memory setting for every function. A lightweight HTTP handler that checks a request and calls an external API is nothing like a function that decodes and re-encodes an image. Give them the same memory and you’ll likely waste money on one while starving the other.
Choose memory based on workload shape, not a global default. Here’s a practical starting point for common workload types:
| Workload Type | Starting Memory | Typical Behaviour | Notes |
|---|---|---|---|
| HTTP APIs / lightweight routing | 256 MB | Mostly I/O-bound; CPU is rarely the bottleneck | 128 MB only for trivial event routing with no dependencies |
| Batch processing / data transforms | 512–1,024 MB | Can be CPU-heavy; larger payloads benefit from more CPU | Test upward; duration often drops enough to offset the higher rate |
| Image / PDF transformation | 1,024 MB+ | Binary buffers and encode/decode work create short CPU spikes | Undersizing can lead to out-of-memory errors and retries |
| Inference-style / model loading | Larger, predictable allocation | Model loading and tensor operations are memory-sensitive | Start higher than general-purpose functions and tune carefully |
Use workload type as your starting point. In some cases, a slightly higher allocation cuts runtime enough that total spend drops. That means the case for adding memory should be simple: show a measured gain in duration or reliability. Don’t do it on gut feel.
Run tuning tests and compare cost per outcome
Once you have a likely starting point, test it against live-like traffic. Use p95 duration, error rate, and memory headroom from production as the baseline. Start from a cautious baseline and increase in fixed steps - for example, begin at 256 MB and test upward while tracking p95 duration, error rate, and estimated monthly spend at each level. The goal is the lowest cost per successful invocation at traffic levels that match production.
On AWS Lambda, Power Tuning can do much of this work for you with a Step Functions state machine. It runs the same payload across multiple memory sizes and gives you a cost-versus-duration chart. An AWS Compute Blog example shows why this matters: a function running at 128 MB averaged about 11.7 seconds per execution at roughly $0.024628 per 1,000 invocations, while that same function at 1,024 MB dropped to about 1.46 seconds at almost the same cost - around $0.024638 per 1,000 invocations. The speed-up was huge. The cost difference was tiny.
Google Cloud Functions and Azure Functions follow the same idea. Run a simple benchmark with the same workload at several memory levels, record p95 duration and failures, and work out estimated spend for a realistic monthly request volume. Change one thing at a time. Use payloads that look like production. Include both warm and cold executions in each batch, so you’re not judging the function on warm runs alone.
Leave a bit of headroom above observed peak usage. Sizing to the exact peak looks neat on paper, but it falls apart when payloads shift, dependencies change, or new code lands.
Avoid common waste patterns in production
Right-sizing isn’t a one-and-done task. It drifts as code changes and traffic moves.
Over-provisioned functions are common, and the cause is often pretty mundane: nobody went back to review the settings after the first deployment. Recheck allocations after major releases, traffic changes, and architecture updates so savings don’t slowly disappear. Where it makes sense, split multi-purpose functions so each handler can be sized on its own.
It’s also worth checking for oversized settings on trivial handlers. A simple routing function or lightweight webhook receiver running at 1,024 MB because it was overprovisioned is usually an easy fix - and one that costs nothing to put right.
Balancing memory, timeout and automation over time
After you’ve right-sized memory, the job isn’t done. You need to keep it in step with actual traffic by reviewing timeout and alert thresholds on a regular basis. Memory and timeout settings only stay cost-efficient when you revisit them as code, traffic patterns and external dependencies shift.
Set timeout values from observed p95/p99 execution time
The safest way to set a timeout is to use real execution data, especially p95 and p99 execution time from the last 30 to 90 days, then add a small buffer. Don’t leave timeouts at the platform maximum “just in case”. When a function hangs at a high limit, costs can climb fast.
That buffer should match the workload.
For API endpoints, a good starting point is 1.2–1.5× p99, as long as it still fits within the user experience budget. Short timeouts here are a deliberate choice. If a downstream service slows down, a tight timeout makes the issue show up fast instead of letting the function sit there, tying up execution slots.
For event-driven and asynchronous jobs, a buffer of 1.5–2× p99 often makes sense, as long as it lines up with queue visibility timeouts and retry rules.
For batch and data-processing functions, it’s better to split the work into smaller chunks than to depend on one long timeout.
| Function Type | Typical Timeout Approach | Operational Risks |
|---|---|---|
| API endpoints | Short (3–10 s); fail quickly for UX | Slow dependencies cause user-visible hangs if timeout is too long |
| Event-driven / async | Moderate (1–5 min); align with queue visibility timeout | Messages re-delivered if timeout exceeds queue visibility window |
| Batch / data processing | Longer (5–15 min); chunk work and use retries | Runaway jobs inflate costs sharply if timeout is set too high |
A handy operational rule is to set latency alerts at about 80% of the configured timeout.[20] So if the timeout is 5 seconds, the alert should fire at about 4,000 ms. That gives you a window to investigate before functions start hitting the limit under live traffic.
Use automation and reviews to keep costs down
Once timeouts are based on observed latency, automation helps stop those settings from drifting. In practice, two things tend to drift most: memory use inches up as code changes, and timeouts sit untouched long after the workload has changed.
That’s why alerts matter. You want signals when p95 or p99 execution time stays above baseline by around 20–30%, and when peak memory use keeps going past 70–80% of the configured limit.[28] Those warnings give you time to act before the issue turns into a cost or reliability headache.
Review the functions that drive the most cost, and the ones most sensitive to latency, every quarter. Anything that trips an alert should be checked monthly. Test any proposed change in a lower environment first, then roll it out in stages while watching latency, error rates and cost closely.
It also helps to put a basic memory and timeout check into your CI/CD pipeline. For example, a deployment gate can confirm that new functions have explicit settings and meet performance checks in a test environment. That stops one-off defaults from slipping into production in the first place.[29]
Conclusion: A practical process for lower serverless spend
Memory allocation has a direct effect on both runtime and cost. And the big point is simple: the lowest memory tier usually isn't the cheapest option overall. You keep spend under control by sizing memory, CPU and timeout together.
The process is straightforward: measure, test, then use the cheapest setting that still hits your latency targets. Look at each function by monthly cost and cost per 1,000 invocations, then test a few memory tiers under traffic that looks like production. From there, pick the lowest-cost setup that still meets your p95 and p99 targets.
Key actions to take next
Start with the functions that cost you the most.
- Identify and check top spenders - list functions by monthly cost in £ and cost per 1,000 invocations using your cloud provider's billing tools, then review configured memory, p95/p99 duration, timeout value and error rate for each.
- Test 2–3 memory tiers - run other memory settings with canary deployments or AWS Lambda Power Tuning; record p95 latency and total cost in £ for each tier.
- Deploy through CI/CD - apply the chosen settings through your pipeline and document before-and-after metrics in your team's runbooks or architecture decision records.
- Review quarterly - revisit top spenders every quarter and run tuning again after any major release or major traffic shift.
The aim is a repeatable process that keeps memory, timeouts and cost aligned with how your application behaves in production.
FAQs
How do I tell if a function is CPU-bound or I/O-bound?
Profile the workload by exporting and reviewing p95 CPU metrics, traffic patterns, and execution times. This gives you a clearer picture of what the function is doing under pressure, not just during average runs.
CPU-bound functions spend most of their time on heavy processing. Think image resizing, video manipulation, or other compute-heavy work. In these cases, adding more memory often gives you more CPU as well, which can cut execution time in a noticeable way.
I/O-bound tasks work differently. Jobs like database queries or reading small files usually wait on external systems more than they burn CPU. That means they often perform well with lower memory and less compute.
Tools like AWS Lambda Power Tuning can help you test different memory settings and spot the point where extra spend stops giving much back.
How often should I review serverless memory settings?
Review serverless memory settings on a regular basis. This shouldn’t be a set-it-and-forget-it job. Keep an eye on CPU, memory, and execution time so you can spot when a function needs a tweak.
As your architecture changes and usage shifts over time, these check-ins help you avoid paying for more memory than you need while keeping costs under control. It’s also smart to pull high-cost functions into routine architecture reviews, especially any function costing more than £500 per month.
What is the best way to test memory tiers safely in production?
Start with monitoring and guardrails. Use AWS CloudWatch to track memory use during executions, and set alarms as usage gets close to your set limit, such as around 80%. That gives you an early warning if your function is running with too little memory or more than it needs.
Then make memory changes bit by bit. Begin at 128 MB, increase step by step, and watch both execution time and cost as you go. AWS Lambda Power Tuning can help you find the best cost-performance balance without making sudden changes.