
Rolling out new software can be risky, but Kubernetes traffic splitting makes it safer. Here's how it works: Canary deployments let you release a new version to a small percentage of users first. Traffic splitting tools like Kubernetes Services, Ingress controllers, and service meshes control what portion of traffic goes to the new version versus the stable one.
Key benefits:
- Minimised risk: Only a small percentage of users are impacted if issues arise.
- Smooth rollbacks: Quickly revert traffic to the stable version without downtime.
- Cost efficiency: Canary deployments require only 10–20% extra resources, far less than blue-green methods.
To implement this:
- Use replica counts for basic traffic control.
- Employ advanced tools like Istio or NGINX Ingress for precise routing.
- Automate rollouts with Flagger or Argo Rollouts for metrics-based decision-making.
Monitoring is critical: Focus on error rates, latency, and success rates to ensure stability. If issues occur, rollbacks can be handled in under a minute. This approach balances safety and cost, making it ideal for industries like fintech and e-commerce.
Read on for step-by-step guidance and practical examples.
Prerequisites and Planning for Canary Traffic Splitting
Technical Prerequisites
Before diving into canary traffic splitting, make sure your setup checks all the right boxes. At a bare minimum, you'll need a Kubernetes cluster running v1.16 or newer - this is non-negotiable if you're using automation tools like Flagger [6]. Familiarity with Deployments, Services, Labels, and Selectors is also crucial, as these form the core of any canary deployment.
For more advanced traffic routing, you'll need a traffic management layer like a service mesh (e.g., Istio or Linkerd), an Ingress controller (such as NGINX Ingress or Traefik), or an API gateway. Without one of these, your routing capabilities will be limited to basic replica adjustments.
An observability stack is another must-have. Tools like Prometheus and Grafana provide real-time insights into your canary's behaviour under live traffic [5][6]. Pair these with automation tools like Flagger or Argo Rollouts to handle promotions and rollbacks seamlessly. Together, these components form a strong foundation for managing controlled traffic distribution.
| Prerequisite Category | Recommended Tools |
|---|---|
| Orchestration | Kubernetes v1.16+ |
| Traffic Control | Istio, NGINX Ingress, Traefik, Linkerd |
| Automation | Flagger, Argo Rollouts |
| Monitoring | Prometheus, Grafana |
| Autoscaling | Horizontal Pod Autoscaler (HPA) |
Once your environment is ready, the next step is to define clear metrics to measure your canary's success.
Defining Success Metrics and SLOs
Canary rollouts without clear metrics are like flying blind. Before shifting any traffic, you need to establish what healthy
means for your application.
A canary without metrics is a blind rollout.- SFEIR Institute [5]
Key metrics to monitor include performance (e.g., P99 latency, throughput), reliability (e.g., error rates, 5xx responses), and infrastructure health (e.g., CPU usage, memory consumption, pod restarts) [5]. For example, a breach of a 1% error rate or a 1.5× increase in baseline latency could trigger an automatic rollback [5][7].
It's also essential to let your canary run for at least 30 minutes before making any decisions [5]. A short observation period might miss critical behaviours, such as traffic spikes during business hours or retail events, which are common in the UK. Aligning your canary windows with realistic traffic patterns ensures your metrics have more context and accuracy.
Capacity and Cost Planning
When planning a canary deployment, it’s important to think about capacity and costs. Canary rollouts typically add 10–20% resource overhead compared to your existing cluster capacity, which is far leaner than the 100% overhead required by Blue-Green deployments [5][8]. For instance, deploying one canary pod alongside nine stable pods creates a 10% traffic split, keeping resource usage tightly controlled.
For teams in the UK running workloads on AWS London (eu-west-2) or Azure UK South, this overhead is manageable. A single extra pod on a t3.medium instance (around £0.025 per hour at current on-demand rates) only adds a minimal cost during a typical canary window of one to two hours. To keep costs low, ensure canary replicas are scaled down promptly after analysis. Tools like Karpenter or the Cluster Autoscaler can automate this alongside Flagger or Argo Rollouts.
To avoid disruptions during rollouts, set up a PodDisruptionBudget (PDB) to guarantee a minimum number of stable pods remain available. Additionally, use preStop hooks with a proper terminationGracePeriodSeconds value to allow in-flight requests to finish cleanly during traffic shifts [10]. These small adjustments can significantly reduce the risk of failed transactions during transitions.
The investment in deployment infrastructure pays for itself not on the good days, but on the bad ones.- Aareez Asif, Senior Kubernetes Architect [10]Need help optimizing your cloud costs?
Get expert advice on how to reduce your cloud expenses without sacrificing performance.
Canary Deployment in Kubernetes | Step-by-Step Demo (90/10 Traffic Split Explained)
Basic Traffic Splitting with Kubernetes Services and Deployments
Traffic splitting in Kubernetes is straightforward when using two Deployments - one for the stable version and one for the canary - alongside a single Service.
Configuring Stable and Canary Deployments
To set this up, run both Deployments simultaneously and configure a single Service to route traffic to both. Proper labelling is key here. Both Deployments should share a common label (e.g., app: my-app) for the Service selector, while each Deployment gets a unique label (e.g., track: stable and track: canary) to allow for independent scaling and monitoring.
Here’s an example configuration:
# stable-deployment.yaml
apiVersion: apps/v1
kind: Deployment
metadata:
  name: my-app-stable
spec:
  replicas: 9
  selector:
    matchLabels:
      app: my-app
      track: stable
  template:
    metadata:
      labels:
        app: my-app
        track: stable
    spec:
      containers:
      - name: my-app
        image: my-app:v1
        readinessProbe:
          httpGet:
            path: /healthz
            port: 8080
          initialDelaySeconds: 5
          periodSeconds: 10
---
# canary-deployment.yaml
apiVersion: apps/v1
kind: Deployment
metadata:
  name: my-app-canary
spec:
  replicas: 1
  selector:
    matchLabels:
      app: my-app
      track: canary
  template:
    metadata:
      labels:
        app: my-app
        track: canary
    spec:
      containers:
      - name: my-app
        image: my-app:v2
        readinessProbe:
          httpGet:
            path: /healthz
            port: 8080
          initialDelaySeconds: 5
          periodSeconds: 10
---
# service.yaml
apiVersion: v1
kind: Service
metadata:
  name: my-app-svc
spec:
  selector:
    app: my-app   # Matches both stable and canary pods
  ports:
  - port: 80
    targetPort: 8080
Adding readinessProbes to your canary pods is crucial. Without them, the Service might send traffic to pods that aren’t ready, leading to errors before the canary has been properly evaluated.
Using Replica Counts to Control Traffic Split
In this setup, traffic distribution depends on the ratio of stable to canary pods. For example, if you have nine stable pods and one canary pod, roughly 10% of the traffic will go to the canary. The table below shows how different replica configurations affect traffic distribution:
| Canary Traffic % | Stable Replicas | Canary Replicas | Total Pods |
|---|---|---|---|
| 10% | 9 | 1 | 10 |
| 25% | 3 | 1 | 4 |
| 50% | 5 | 5 | 10 |
| 75% | 1 | 3 | 4 |
| 100% | 0 | 10 | 10 |
To adjust the traffic split, scale the Deployments using kubectl scale. For instance, to route 25% of traffic to the canary:
kubectl scale deployment my-app-canary --replicas=1
kubectl scale deployment my-app-stable --replicas=3
This method works well for coarse-grained adjustments. However, achieving precise splits (e.g., 1%) would require a very high number of pods, which can become impractical. For finer control, you might want to explore service meshes or Ingress controllers.
A canary deployment routes a small percentage of traffic to the new version while the majority continues on the stable version.- kindatechnical.com [11]
Once the traffic split is set, continuous monitoring is essential to ensure the rollout proceeds smoothly.
Monitoring and Rollback During Traffic Shifts
While readinessProbes confirm that a pod is running, they don’t catch issues like logic errors or performance problems. As Aareez Asif, a Senior Kubernetes Architect at DevOpsil, points out:
Health checks tell you if the process is alive. They don't tell you if the service is correct. Canary analysis against real traffic metrics... catches the failures that health probes miss.[10]
To monitor the canary, use the track label to filter logs:
kubectl logs -l track=canary --tail=100
Focus on metrics like 5xx error rates, P99 latency, and throughput, comparing these against your stable baseline. If the canary shows issues, rollback is simple. Scale the canary Deployment to 0 and restore the stable Deployment to its original capacity:
# Emergency rollback
kubectl scale deployment my-app-canary --replicas=0
kubectl scale deployment my-app-stable --replicas=9
This setup allows for immediate rollback without requiring a full redeployment. As Riku Tanaka, an SRE & Observability Engineer, aptly puts it:
A canary without real-time error rate comparison is just a slow rolling update.[10]
These steps provide a foundation for basic traffic splitting. For more advanced strategies, consider using tools like Ingress controllers or service meshes to gain finer control over traffic distribution.
Advanced Traffic Splitting with Ingress Controllers and Service Meshes
Once you've got the basics of traffic splitting down with Kubernetes Services and Deployments, it's time to explore more advanced approaches. Tools like Ingress controllers and service meshes help you achieve precise traffic splitting without relying on pod numbers.
Weighted Routing with Ingress Controllers
Ingress controllers allow for more flexible traffic splitting through annotations, bypassing the limitations of replica-based methods.
For example, the community NGINX Ingress controller (starting from v0.25+) supports canary routing using simple annotations. To use this, you create an additional Ingress resource for the canary Service, marking it with nginx.ingress.kubernetes.io/canary: "true". Then, set the traffic percentage with nginx.ingress.kubernetes.io/canary-weight. The controller combines the stable and canary Ingress resources into a single NGINX server block, ensuring the specified percentage of traffic flows to the canary version.
It’s critical that the host and path fields in both Ingress resources match exactly. Even minor differences will cause the controller to treat them as separate routes, breaking the canary setup.
apiVersion: networking.k8s.io/v1
kind: Ingress
metadata:
  name: my-app-canary
  annotations:
    nginx.ingress.kubernetes.io/canary: "true"
    nginx.ingress.kubernetes.io/canary-weight: "20"
spec:
  rules:
  - host: my-app.example.com
    http:
      paths:
      - path: /
        pathType: Prefix
        backend:
          service:
            name: my-app-canary-svc
            port:
              number: 80
Before rolling out the canary to all users, you can limit its exposure to internal testers by using the nginx.ingress.kubernetes.io/canary-by-header annotation. This step allows you to validate functionality in a live environment without impacting end users.
Traffic Splitting with Istio
Istio takes traffic splitting a step further by offering detailed control over internal traffic flows. It uses a DestinationRule to group pods into subsets (e.g., stable and canary) based on labels, and a VirtualService to define how traffic is distributed between these subsets.
# destination-rule.yaml
apiVersion: networking.istio.io/v1beta1
kind: DestinationRule
metadata:
  name: my-app
spec:
  host: my-app-svc
  subsets:
  - name: stable
    labels:
      track: stable
  - name: canary
    labels:
      track: canary
---
# virtual-service.yaml
apiVersion: networking.istio.io/v1beta1
kind: VirtualService
metadata:
  name: my-app
spec:
  hosts:
  - my-app-svc
  http:
  - route:
    - destination:
        host: my-app-svc
        subset: stable
      weight: 90
    - destination:
        host: my-app-svc
        subset: canary
      weight: 10
This method consolidates all traffic under a single Service name, eliminating the need for microservices to distinguish between DNS names for stable and canary versions.
For east-west or intra-cluster traffic, \[host-level splitting\] forces microservice-to-microservice communication to choose whether to hit the stable or the canary DNS name... In this situation, the DestinationRule subset traffic splitting would be a better option.- Argo Rollouts Documentation [13]
Istio also supports traffic mirroring, where live requests are duplicated and sent to the canary version in real time. While the canary's responses are ignored, this approach provides real-world data for performance analysis before shifting actual traffic [12].
Automating Canary Steps with Argo Rollouts and Flagger
Adjusting traffic weights manually can be tedious and prone to errors. Tools like Argo Rollouts and Flagger automate this process, making progressive rollouts smoother and safer.
Argo Rollouts introduces a Rollout resource that replaces standard Deployments. This resource defines explicit steps (e.g., 5%, 25%, 50%, then 100%) and can include analysis windows or pauses for manual approval. A complete rollout typically takes about 25 minutes in production environments [14]. For critical updates, you can even set an indefinite pause to require human intervention before final promotion.
Flagger, on the other hand, works with existing Deployments, requiring no major changes to your manifests. By creating a Canary resource, you can define parameters like stepWeight and maxWeight, allowing Flagger to manage traffic distribution automatically. This makes it an easier choice for environments with multiple existing Deployments.
| Feature | Argo Rollouts | Flagger |
|---|---|---|
| Manifest changes required | Yes - replaces Deployment with Rollout
|
No - wraps existing Deployment
|
| Progression style | Explicit steps (setWeight, pause) |
Declarative (stepWeight, maxWeight) |
| Manual approval gates | Supported (indefinite pause) | Primarily fully automated |
| GitOps ecosystem | Argo CD | Flux / FluxCD |
Both tools monitor metrics providers like Prometheus or Datadog during rollout steps. If error rates or latency spike beyond acceptable thresholds, traffic is automatically reverted to the stable version [14]. To avoid unnecessary rollbacks due to transient issues, consider setting a failureLimit of 2 or 3 instead of 1.
Pro Tip: In GitOps setups, configure Argo CD to ignoreDifferences for weight fields in your VirtualService or Ingress resources. Without this, automated weight adjustments might get overwritten by the GitOps controller, disrupting the rollout process.
For expert guidance on fine-tuning Kubernetes deployments and progressive delivery, check out Hokstad Consulting.
Monitoring, Rollbacks, and Cost Management
::: @figure 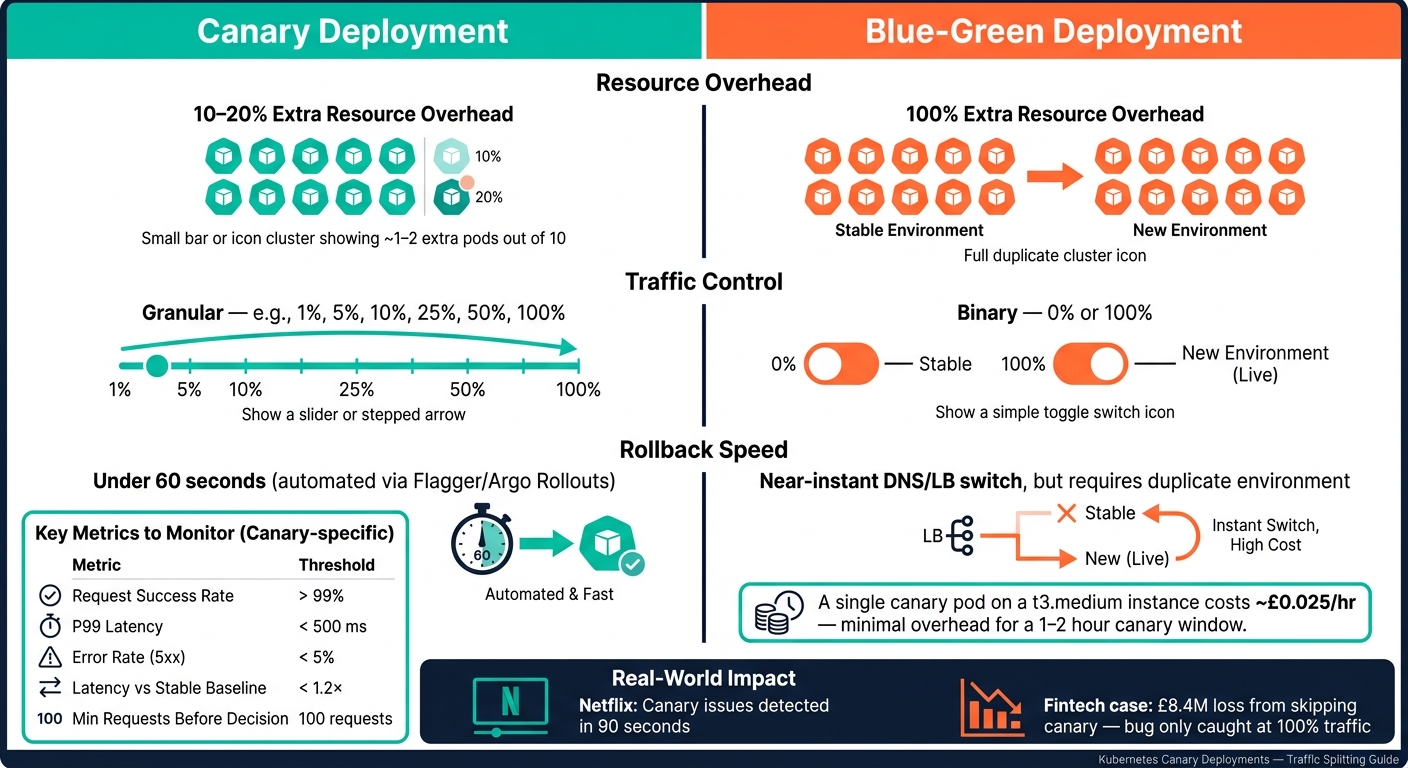 {Canary vs Blue-Green Deployments: Cost, Risk & Speed Compared}
:::
{Canary vs Blue-Green Deployments: Cost, Risk & Speed Compared}
:::
Key Metrics to Track
Once you’ve implemented your deployment strategies, monitoring becomes critical to ensure smooth traffic transitions. After redirecting traffic, focus on two key metrics: request success rate (aim for over 99%) and P99 latency (keep it below 500 ms). Additionally, the canary's latency should not exceed 1.2 times the stable baseline [2].
Always compare these metrics against the stable baseline to rule out cluster-wide problems. Also, make sure to wait until the canary has handled at least 100 requests before making any decisions - small sample sizes can give misleading results [2].
| Metric | Recommended Threshold | Purpose |
|---|---|---|
| Request Success Rate | > 99% | Confirms functional stability [9][16] |
| P99 Latency | < 500 ms | Flags performance issues [2][1] |
| Error Rate (5xx) | < 5% | Identifies server-side problems early [2] |
| Request Count | > 100 requests | Ensures reliable data [2] |
| Latency Ratio vs. Stable | < 1.2× | Compares canary to baseline [2] |
These metrics guide how you adjust traffic incrementally, aligning with progressive delivery methods. Tools like Flagger automatically check these metrics every 60 seconds during rollouts [15][16]. To visualise this data, pair Prometheus (using metrics like istio_requests_total and istio_request_duration_milliseconds_bucket) with a Grafana dashboard. This setup lets you monitor traffic weights and health signals in real time [9].
How to Roll Back a Canary Deployment
Rolling back a canary deployment is straightforward. Shift traffic back to the stable version by setting the canary weight to 0% and restoring 100% traffic to the stable deployment. If you're using Istio, this involves patching the VirtualService. For NGINX Ingress, update or remove the canary-weight annotation [4][17]. These changes take effect immediately, without restarting pods.
Automated tools like Flagger or Argo Rollouts can handle rollbacks for you. They monitor metrics and trigger rollbacks automatically if thresholds are breached, typically completing the process in under 60 seconds [18]. If manual intervention is needed with Argo Rollouts, you can run kubectl argo rollouts abort <name> to stop the rollout and initiate a rollback [8][18]. After traffic is redirected, scale the canary ReplicaSet to zero to free up resources.
For manual recovery, the kubectl rollout undo command restores a previous stable version. Keep at least three to five prior stable ReplicaSets available as backups [18][10]. It’s also a good idea to set up alerts via Slack or PagerDuty to notify your team immediately when an automated rollback occurs, so you can investigate the root cause [18].
While quick rollbacks are vital, managing resources during rollouts is equally important.
Keeping Costs Down During Canary Rollouts
Canary deployments are more cost-efficient than blue-green deployments, with only 10–20% extra resource overhead compared to the 100% overhead of blue-green [5]. However, costs can still add up if canary pods are left running longer than necessary.
To minimise expenses, scale the canary down to zero as soon as the analysis fails or the promotion succeeds [15][2][1]. Set an auto scale-down after 30 minutes post-promotion. This timeframe is long enough to catch immediate issues but short enough to reclaim resources promptly [18].
Conclusion and Key Takeaways
This guide has explored how progressive traffic splitting helps minimise risk and manage the impact of rollouts. By using traffic splitting for canary deployments, you gain precise control over risk. Instead of releasing changes to all users simultaneously - where a single bug could lead to expensive recovery efforts - you introduce new code to a small portion of traffic, verify its performance, and then gradually expand its reach:
Standard Kubernetes rolling updates are binary - they either succeed completely or fail catastrophically.- ctoi, Hands On Kubernetes [3]
Real-world examples highlight the effectiveness of this approach. Progressive delivery has proven to be far more reliable than traditional methods. For instance, Netflix's automated canary systems can detect issues in just 90 seconds. On the other hand, a major fintech company suffered a £8.4M loss due to a latency bug that wasn’t spotted until the new version was exposed to 100% of traffic [3].
By carefully managing replica counts and using tools like service meshes, progressive rollouts ensure a balance between risk mitigation and cost efficiency. Key strategies include starting with a small canary weight (1–5%), setting clear success criteria, automating rollbacks based on error metrics and latency, and scaling down canary pods as soon as the rollout ends. These methods not only lower risk but also help cut infrastructure costs.
For UK businesses ready to adopt these practices, Hokstad Consulting offers expert assistance. They specialise in hands-on implementation and CI/CD pipeline optimisation, helping organisations improve deployment cycles and achieve cloud cost savings of 30–50% across public, private, and hybrid Kubernetes environments.
FAQs
When should I use replica-based splitting vs weighted routing?
Replica-based splitting works well for broad traffic adjustments by modifying the number of pod replicas for each version. For instance, you can decrease the replicas of the primary deployment while increasing those of the canary, resulting in a gradual traffic shift. While straightforward, this approach doesn’t offer much accuracy.
On the other hand, weighted routing provides more precise traffic management. It allows you to direct exact percentages of traffic to different versions, making it ideal for strategies like canary releases or A/B testing. Tools such as Istio or Linkerd are commonly used to implement this method.
Which metrics should trigger an automatic canary rollback?
When deploying updates, certain metrics act as red flags, signalling the need for an automatic rollback. These include:
- Error Rates: If error rates exceed 1%, it's a clear sign something's wrong.
- P99 Latency: A P99 latency that doubles the baseline indicates performance issues that can't be ignored.
- Critical Alerts: Alerts flagged as critical by monitoring systems should always prompt immediate attention.
Monitoring tools like Prometheus play a crucial role here, identifying elevated error rates or sudden latency spikes. These tools ensure issues are caught early, helping to maintain system stability.
How do I stop GitOps from overwriting canary weight changes?
To stop GitOps from overwriting canary weight changes, you can enable the skipAnalysis: true option in Flagger's configuration. This setting prevents automatic analysis and ensures that weight adjustments aren't altered during deployment.
Another approach is to manage traffic weights directly within your Git repository. By doing so, you can disable automatic synchronisation of weight changes during canary analysis, giving you full manual control over traffic distribution while avoiding interference from GitOps.