A running pod does not prove RDMA is ready. Before approving distributed LLM inference, verify all seven checks and save the test results:
- Device discovery: Confirm the RDMA plugin registers the expected resources.
- Interfaces and device access: Check that pods can use the assigned RDMA devices and network attachments.
- Pod resources: Match GPU and RDMA requests to the planned allocation.
- Hardware placement: Verify GPU-to-NIC and NUMA locality.
- Runtime access: Test drivers, permissions and memory registration under the production security settings.
- Pod connectivity: Confirm communication over every required RDMA path.
- Transfer performance: Measure bandwidth, latency and GPU collectives against agreed targets.
Basic RDMA success does not prove GPUDirect RDMA works. GPU-memory transfers need separate testing to rule out host-memory staging.
Record commands, logs, versions, owners and results. Approve rollout only when all seven checks pass or have a formally accepted Not applicable decision. This approval covers infrastructure readiness - not model performance.
::: @figure 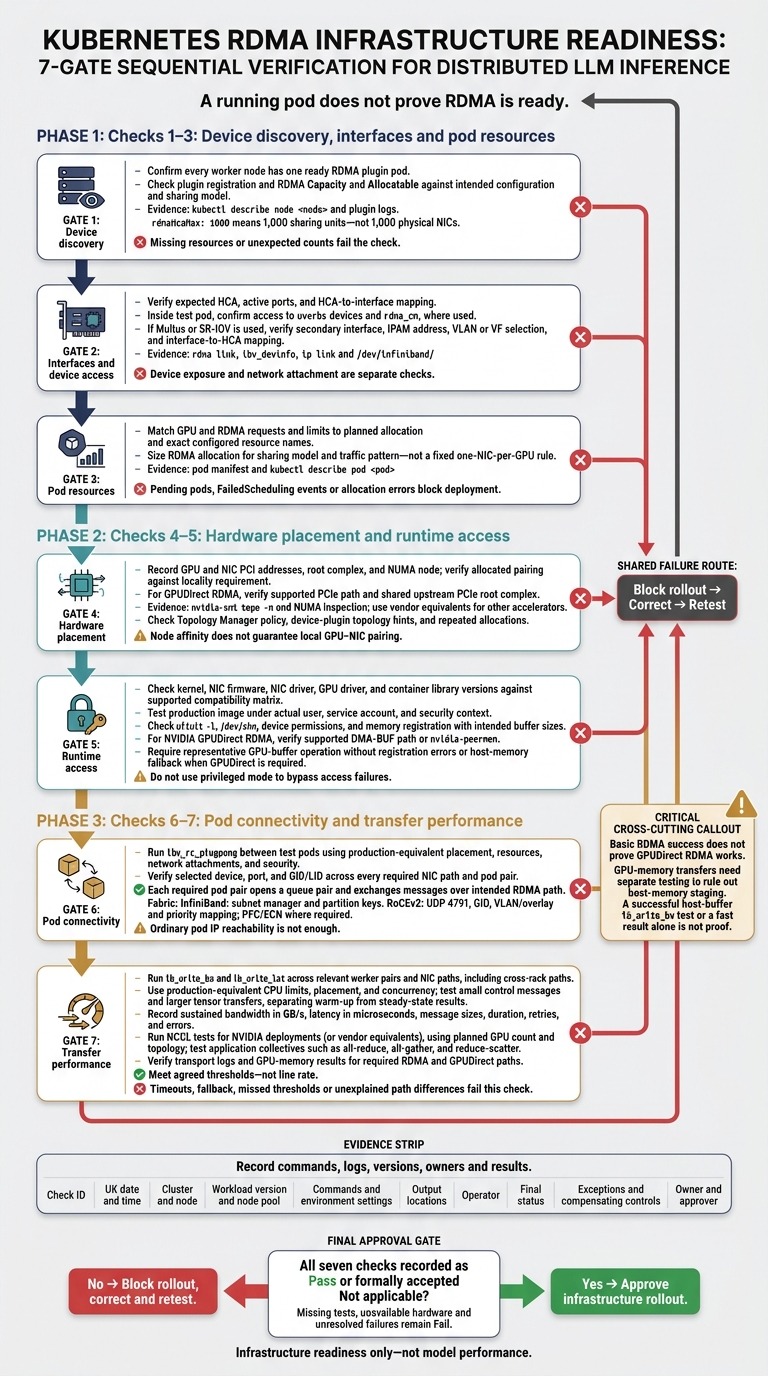 {Kubernetes LLM Networking: 7 RDMA Deployment Checks}
:::
Checks 1–3: Device discovery, interfaces and pod resources
1. Check RDMA device-plugin registration
Run kubectl get daemonsets -A and kubectl get pods -A -o wide. Confirm that every worker node has one ready plugin pod. Check the plugin logs and access to the kubelet registration directory for registration errors. Then use kubectl describe node <node> to inspect RDMA Capacity and Allocatable values. Missing resources or unexpected counts fail the check.[1]
Compare these counts with the plugin configuration. For rdma/hca_shared_devices_a, rdmaHcaMax: 1000 means 1,000 sharing units - not 1,000 physical NICs. Across all worker pools, the resource name, selected interfaces and advertised capacity must match the intended sharing model.[8]
2. Check RDMA interfaces and pod device access
Once registration is confirmed, check that the pod can see and use its assigned devices. On workers in each pool, run rdma link, ibv_devinfo and ip link. Check the expected HCA, active ports, driver and consistent HCA-to-interface mapping. Inside a test pod that requests RDMA, run ls -la /dev/infiniband/ and ibv_devinfo. Confirm that the required uverbs devices - and rdma_cm, where used - are present. A running pod without usable RDMA devices fails the check.[4][10]
If the design uses Multus or SR-IOV, run ip link and ip addr inside the pod. Check the intended secondary interface, IPAM address, VLAN or VF selection, and interface-to-HCA mapping. Inspect network annotations, kubectl describe pod <pod> and CNI logs for attachment details. Device exposure and network attachment are separate checks: both must match the design. Fix missing devices, inactive ports or incorrect attachments before proceeding.[9][10]
3. Set GPU and RDMA pod resources
After confirming device visibility, bind the pod to the exact GPU and RDMA resources. Check the manifest and scheduling events to verify that allocation matches the intended sharing model. In the inference container, declare matching requests and limits for nvidia.com/gpu and the exact RDMA resource name from the plugin configuration.[7][8][9]
Size RDMA resources according to the sharing model and traffic pattern, not a fixed one-NIC-per-GPU rule. Use kubectl describe pod <pod> to check the intended GPU and RDMA allocation. Pending pods, FailedScheduling events or allocation errors block deployment.[7][8][9]
Checks 4–5: Hardware placement and runtime access
4. Check GPU-to-NIC and NUMA placement
After allocation, check physical placement and locality.
Record the GPU and NIC PCI addresses, root complex and NUMA node. On NVIDIA nodes, use nvidia-smi topo -m and /sys/class/net/<interface>/device/numa_node. For other accelerators, use the vendor’s topology tool. Compare the allocated pairing with your agreed locality requirement.
For GPUDirect RDMA, verify the supported PCIe path and shared upstream PCIe root complex.[3][5]
Node affinity does not guarantee local GPU–NIC pairing. Check the kubelet’s Topology Manager policy and confirm that both device plugins supply topology hints. Repeat the test pod and inspect each allocation. Pass only when every allocation meets the topology rule and any GPUDirect compatibility check. Route placement failures to GPU and platform engineering.[1]
5. Check drivers, permissions and memory locking
Once placement is correct, check driver compatibility and memory registration under the production security context.
Record the kernel, NIC firmware, NIC driver, GPU driver and container library versions, then check them against the supported compatibility matrix. Test the production image with its actual user, service account and security context.
Inside the container, check ulimit -l and /dev/shm capacity. Confirm that memory registration works with the required buffer sizes, and add IPC_LOCK only where needed. Inspect device cgroup rules, Pod Security admission, SELinux or AppArmor denials, pod events and kernel logs. Do not use privileged mode to bypass access failures.
For NVIDIA GPUDirect RDMA, verify either the supported DMA-BUF path or nvidia-peermem. NVIDIA’s DMA-BUF baseline requires open GPU kernel modules, Linux 5.12 or later, CUDA 11.7 or later and a communication library that supports DMA-BUF. The release matrix still governs compatibility.[2][6]
Pass only when the workload registers the intended memory and completes a representative GPU-buffer operation without registration errors or host-memory fallback. A successful host-buffer ib_write_bw test alone does not prove GPUDirect RDMA readiness.[2][3]
Collect communication library debug output and kernel logs. Platform engineering owns runtime and security failures; GPU engineering owns accelerator and peer-memory failures.
Only after runtime access passes should you test pod-to-pod RDMA.
Checks 6–7: Pod connectivity and transfer performance
6. Test RDMA connectivity between pods
Once runtime access is confirmed, deploy test pods on the target workers using the workload’s node selectors, tolerations, network attachments, RDMA resources and security context. Run ibv_rc_pingpong between a server pod and a client pod. Check the selected device, port and GID/LID, then test every required NIC path. Pass only when each required pod pair opens a queue pair and exchanges messages over the intended RDMA path. Ordinary pod IP reachability is not enough.[12]
Use rdma link and, for InfiniBand, ibstat to check link state. Check addressing, routes, MTU, firewall rules and NetworkPolicy enforcement. Then check the fabric-specific settings:
- InfiniBand: Verify subnet-manager reachability and matching partition keys.
- RoCEv2: Check UDP port 4791, GID selection, VLAN or overlay membership and traffic-priority mapping. Inspect PFC and ECN settings where the fabric design requires them.
Repeat the tests under representative load and compare endpoint and switch counters. Unreachable peers, incorrect paths, drops or congestion-related failures block deployment and must go to networking engineering.[11][12][13][17]
7. Measure transfers and GPU collectives
After pod-to-pod RDMA passes, run ib_write_bw and ib_write_lat across each relevant worker pair and NIC path, including cross-rack paths. Use production-equivalent CPU limits, pod placement and concurrency. Test both small control messages and larger tensor transfers, keeping warm-up results separate from steady-state results. Record sustained bandwidth in GB/s, latency in microseconds, message sizes, duration, retries and errors. Assess results against agreed thresholds, not line rate.[14]
For NVIDIA deployments, run NCCL tests with the planned GPU count, pod placement and process topology. Test the collectives the application uses, such as all-reduce, all-gather and reduce-scatter. For other accelerators, use vendor-supported equivalents. Inspect transport logs and GPU-memory benchmark results to confirm the required RDMA transport and any required GPUDirect path. A fast result alone does not prove that transfers avoided host staging.[15][16][18]
Save the commands, environment settings, pod and node names, selected interfaces, timestamps, logs and before-and-after counters. Include interface utilisation, throughput variation and tail-latency measurements. Timeouts, fallback, missed thresholds or unexplained differences between equivalent paths fail this check. Send fabric faults to networking engineering, and collective or GPU-path faults to GPU and application engineering. Record the corrective action and retest result.
Demystifying NVIDIA RDMA on OpenShift | Ask an OpenShift Expert 165
Conclusion: Record results and approve deployment
Approve rollout only when all seven checks are recorded as Pass or formally accepted Not applicable. Missing tests, unavailable hardware and unresolved failures remain Fail.
For each check, attach the check ID, UK date and time, cluster and node, versions, commands, output locations, operator and final status. Use the table below to record the final deployment gate for Checks 1–7.
| Check | Verification command | Expected result | Failure impact | Deployment decision |
|---|---|---|---|---|
| 1. Device visibility |
kubectl get nodes -o json and kubectl describe node <node>
|
Expected GPU and RDMA allocatable counts | Unusable hardware or pending pods | Pass only when advertised counts match the host |
| 2. Interface and pod access |
ip link; rdma link; ls /dev/infiniband inside the test pod |
Required interfaces and verbs devices accessible | TCP fallback or startup failure | Pass only when the pod can access the intended devices |
| 3. Pod resources |
kubectl describe pod <pod>; kubectl get pod <pod> -o wide
|
Correct requests; approved node placement | Pending or incorrectly placed pods | Require successful scheduling |
| 4. GPU-to-NIC and NUMA placement |
nvidia-smi topo -m; lspci -tv; NUMA inspection |
Required GPU–NIC locality | Higher latency or reduced bandwidth | Pass only when topology matches the requirement; otherwise record a formally accepted Not applicable decision |
| 5. Permissions and memory locking |
ulimit -l; device-file permissions; container security-context checks |
Required access and locked-memory limits | Registration or GPUDirect RDMA failure | Do not approve until corrected or justified |
| 6. Pod-to-pod RDMA connectivity |
ib_send_bw between pods |
Consistent connections; no completion errors | Unreliable data exchange | Require repeatable success across representative nodes |
| 7. GPU-aware transfer and collectives |
all_reduce_perf configured for the deployment topology |
Successful transfers; stable bandwidth | Unacceptable performance | Approve only against a documented baseline |
Validate the evidence against the Kubernetes device-plugin, NVIDIA Network Operator, GPUDirect RDMA and NCCL tests documentation.[1][19][6][20]
For approval based on these seven checks, record the cluster, workload version, node pool, test date, owner and approver, along with any exceptions and compensating controls. This sign-off covers infrastructure readiness only. Keep model performance testing separate.
FAQs
When should I repeat the seven RDMA checks?
Repeat the seven RDMA checks as part of regular optimisation, and after any major system changes or infrastructure updates. As AI models evolve, data volumes grow and cloud environments change, monitoring and fine-tuning help maintain efficiency.
These checks confirm that your configuration remains valid, help prevent configuration drift and spot misconfigurations or performance bottlenecks early - keeping distributed inference running efficiently and securely.
How do I set realistic RDMA performance thresholds?
Set traffic baselines by recording typical request volumes, response times and error rates for each service pair. Track these metrics with Prometheus and Grafana to spot bottlenecks.
Review historical data, seasonal trends and inference request patterns to forecast resource needs and scale ahead of demand. During testing, monitor latency percentiles, such as P95 and P99, alongside connection churn to catch issues before they affect production.
How can I detect host-memory staging?
Use real-time monitoring tools such as Prometheus and Grafana to spot latency spikes, unexpected memory usage or bottlenecks during data transfers [1][2]. These signs may suggest that workloads are staging data in host memory rather than using direct device access.
Use distributed tracing to map request flows and spot unusual patterns or delays between compute resources and network interfaces. These may point to inefficient data handling [3].