
Managing resources in Kubernetes can be challenging, but dynamic resource allocation (DRA) offers a smarter way to optimise performance and reduce costs. Instead of relying on static estimates, DRA adjusts resource usage in real time based on actual demand, making it a game-changer for cloud-native applications.
Key takeaways:
- Static allocation wastes resources: Up to 70% of requested CPU and memory often sit idle, driving unnecessary cloud costs.
- Dynamic allocation saves money: By allocating resources as needed, organisations can reduce cloud overspend by 20–40%.
- Improved efficiency: Tools like ResourceClaims and ResourceSlices ensure specialised hardware (GPUs, FPGAs) is used effectively.
- Real-time monitoring is critical: Metrics pipelines, Kubernetes' Horizontal Pod Autoscaler (HPA), and tools like Prometheus enable precise scaling.
DRA not only trims costs but also ensures applications run smoothly during traffic spikes or heavy workloads. While setup requires effort, the long-term benefits - better resource usage and lower bills - are well worth it.
::: @figure 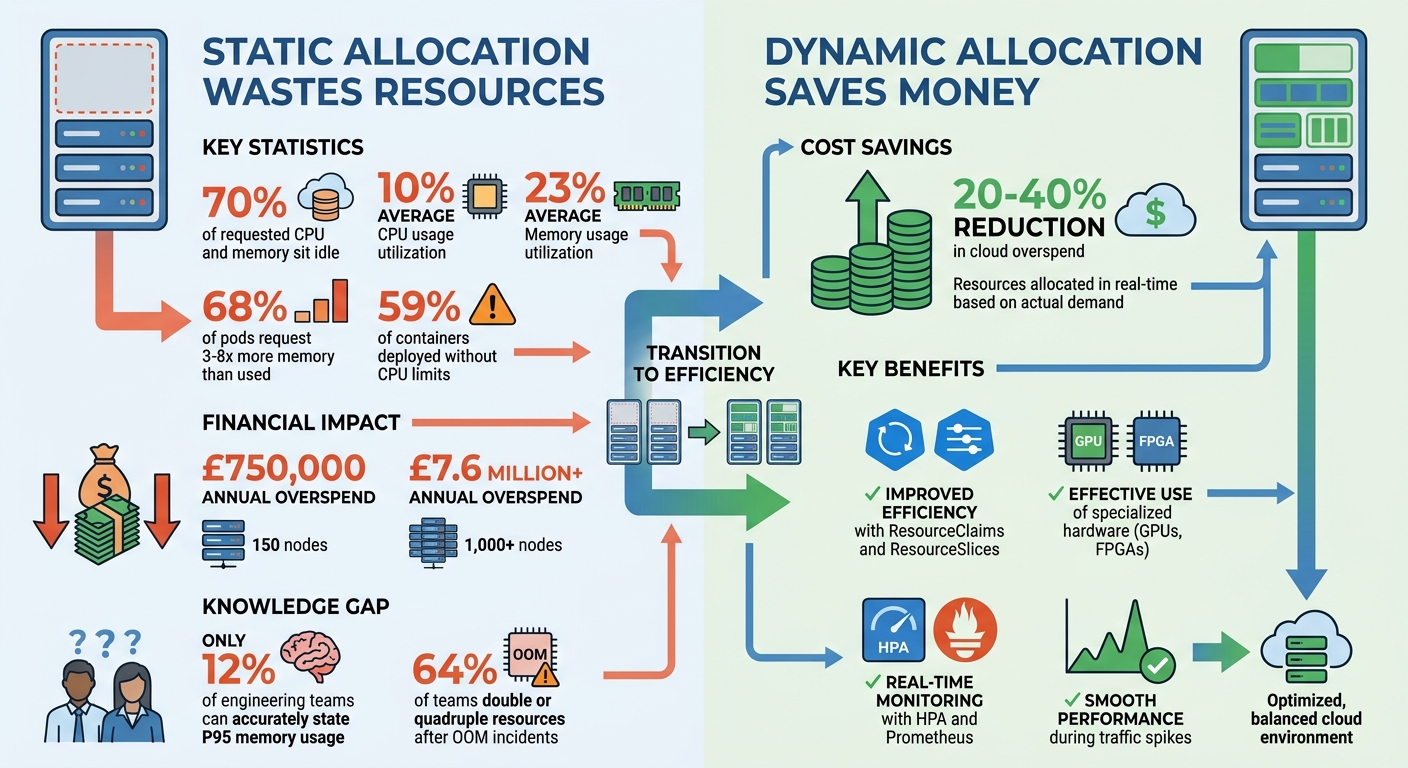 {Kubernetes Resource Waste Statistics and Cost Savings with Dynamic Resource Allocation}
:::
{Kubernetes Resource Waste Statistics and Cost Savings with Dynamic Resource Allocation}
:::
What Can I Get You? An Introduction to Dynamic Resource Allocation - Freddy Rolland & Adrian Chiris
Need help optimizing your cloud costs?
Get expert advice on how to reduce your cloud expenses without sacrificing performance.
Challenges in Kubernetes Resource Allocation
Balancing the resources Kubernetes clusters request with what they actually use is a tricky task - and one that often leads to inefficiencies. Around 70% of requested CPU and memory resources sit idle, with CPU usage averaging just 10% and memory usage at 23% [1]. These gaps don’t just inflate cloud costs; they also undermine the efficiency promised by automated resource management. The result? Misused hardware, wasted money, and scheduling that struggles to keep up with real-world needs.
Poor Hardware Resource Usage
A big part of the problem is that pods typically ask for far more memory than they actually need. In fact, 68% of pods request three to eight times the memory they use [1]. Why? It’s often down to caution. Engineers, wary of triggering alerts or dealing with an Out of Memory Kill (OOMKill) at an inconvenient hour, tend to over-allocate resources. This over-provisioning steadily drives up cloud costs.
The situation with CPU and memory is slightly different. CPU overruns lead to throttling and performance issues, while memory overruns result in pods being terminated immediately [1]. Because CPU is compressible (it can handle temporary spikes), teams often focus on memory, adding significant buffers to avoid crashes. For instance, 59% of containers are deployed without defined CPU limits, leaving a lot of unused capacity [1]. This cautious approach might feel safer, but it contributes directly to financial waste.
Overprovisioning and Wasted Cloud Spending
The financial impact of overprovisioning is hard to ignore. For organisations running about 150 nodes, the annual overspend can reach £750,000. For those with 1,000 nodes or more, it can soar past £7.6 million [1]. One reason for this is the lack of precise resource usage data. Only 12% of engineering teams can accurately state their P95 memory usage without digging into historical data [1]. Instead, many rely on guesswork or default settings that are copied and pasted across deployments.
When an OOM incident does occur, the response often makes things worse. A full 64% of teams immediately double or quadruple their resource requests, locking in inefficient allocations for the long term [1]. This reactive approach, combined with a lack of reliable data, creates a cycle of waste.
Static Scheduling and Node Preparation Problems
Kubernetes’ scheduling system has its own limitations. It works fine for simple workloads, but when pods need specific hardware - like certain GPU models or specialised storage - it struggles. Static device plugins only count resources without considering their specific attributes, which means nodes with spare capacity might still fail to meet the requirements of certain pods.
This rigidity forces teams to overcompensate. They maintain oversized node pools as a safety net, even though those worst-case scenarios rarely happen. The scheduler’s inability to dynamically adapt to changing needs means engineers are left pre-configuring nodes for events that might never occur. This static approach highlights the need for real-time monitoring tools to help adjust resources more flexibly and efficiently.
How Kubernetes Dynamic Resource Allocation Works
Dynamic Resource Allocation (DRA) removes the need for static configurations and guesswork. Instead of relying on fixed device plugins that only count resources, DRA enables real-time requests, matching, and reservations for hardware. Here's how it works: drivers use ResourceSlices to publish available hardware, while workloads request specific resources through ResourceClaims. The scheduler then evaluates the available ResourceSlices, matches them to the request, and updates the ResourceClaim with the allocation details. This ensures that Pods are scheduled only after all required resources are reserved, addressing inefficiencies in resource management.
ResourceClaims and ResourceSlices in Kubernetes
ResourceClaims are essentially requests for hardware, such as GPUs or FPGAs. These can either be created manually when multiple Pods share a device or automatically generated using ResourceClaimTemplates for exclusive, per-Pod access. The latter is particularly useful for parallel Jobs where each instance needs similar but independent hardware.
On the supply side, ResourceSlices are published by device drivers to inform the scheduler about available hardware on each node. These include details like capacity and health status. DeviceClasses are used to categorise hardware (e.g., high-performance
or cost-efficient
) and employ the Common Expression Language (CEL) to filter devices based on specific attributes.
| API Kind | Scope | Primary Responsibility |
|---|---|---|
| DeviceClass | Cluster | Defines device categories and filtering parameters |
| ResourceClaim | Namespace | Requests specific resources for a Pod |
| ResourceClaimTemplate | Namespace | Automates creation of per-Pod ResourceClaims |
| ResourceSlice | Cluster | Shows available hardware on nodes, published by drivers |
With these definitions in place, Kubernetes continuously monitors resource status to optimise allocation.
Real-Time Resource Monitoring and Allocation
To tackle overprovisioning and unused capacity, real-time monitoring ensures resources are used efficiently. The PodResourcesLister kubelet gRPC service tracks resource usage, while the status.devices field in ResourceClaims allows drivers to report details like assigned IP addresses and hardware conditions. This feedback loop ensures resources are allocated precisely where needed, avoiding the excess margins that can inflate costs.
The scheduler's wait-for-first-consumer
mode is key. It delays resource allocation until a Pod is ready to run, preventing resources like CPU and memory from being locked up unnecessarily. As Ohly and Klues explain:
One key feature is that Pods do not get scheduled to a node unless all of their resources are allocated and reserved. This avoids the scenario where a Pod gets scheduled onto one node and then cannot run there[2].
Enabling the DynamicResourceAllocation Feature Gate
As of Kubernetes v1.35, DRA is stable and enabled by default. For earlier versions, you'll need to manually enable the DynamicResourceAllocation feature gate across the kube-apiserver, kube-scheduler, kube-controller-manager, and kubelet. Your cluster must also use a container runtime compatible with the Container Device Interface (CDI), such as CRI-O v1.23.2 or later or containerd v1.7.0 or later. This setup is essential for achieving the cost efficiencies discussed earlier.
In larger environments, monitoring controller metrics is crucial. For instance, tracking workqueue_depth for the resource_claim controller can help detect bottlenecks early. During scale tests on a 100-node cluster running at 90% capacity, adjusting the kube-controller-manager QPS to 75 and Burst to 150 ensured Pod startup times met service level objectives without impacting API server performance [3]. Avoid setting spec.nodeName directly in Pods when using DRA, as this can cause resource reservation failures, leaving Pods stuck in a pending state.
Implementing Dynamic Resource Allocation for Your Business
To make dynamic resource allocation (DRA) work effectively in your setup, you need to incorporate real-time metrics, autoscaling, and proper hardware configurations. Here's how you can put these elements into action.
Integration with Monitoring Tools and Metrics
Relying solely on CPU and memory metrics won't give you a full picture of your system's performance. Instead, include application-specific metrics like request latency, queue depth, and active connections. A typical setup involves your application exposing metrics at a /metrics endpoint for Prometheus to collect. These metrics are then converted into a format compatible with Kubernetes' Custom Metrics API (custom.metrics.k8s.io) [5][7].
The Prometheus Adapter plays a key role here, translating custom metrics into something the Horizontal Pod Autoscaler (HPA) can use. For external cloud metrics - such as AWS SQS queue depths or ALB request rates - the Datadog Cluster Agent provides integration via the external.metrics.k8s.io API [6]. If you need to scale workloads to zero during idle times (ideal for queue processors), KEDA can extend HPA to support event-driven scaling [6].
Because the metrics pipeline is critical for autoscaling, it's essential to monitor Prometheus and its adapters to ensure they remain highly available [6]. To prevent frequent scaling changes (known as thrashing), configure HPA's stabilizationWindowSeconds to 300 seconds for scale-down, while allowing immediate scale-up for traffic spikes. Once the metrics pipeline is set up, HPA can turn these metrics into actionable scaling operations.
Using Horizontal Pod Autoscaler (HPA) for Scaling
With accurate metrics in place, HPA becomes the tool that drives real-time scaling. Start by deploying the Metrics Server to collect CPU and memory metrics [9][12]. For custom metrics, make sure the Prometheus Adapter is integrated with your existing Prometheus setup [11][7].
Define resources.requests in each container's Pod specification. This is crucial because HPA calculates the required number of replicas using the formula: ceil(currentReplicas × (currentMetricValue / desiredMetricValue)) [8][12]. Without these requests, HPA can't determine utilisation and won't be able to scale effectively [8][12].
Using the autoscaling/v2 API unlocks advanced features like scaling on multiple metrics and fine-tuning scaling behaviours [8][9]. By default, HPA adjusts scaling every 15 seconds and includes a 10% tolerance to avoid unnecessary changes [8]. For production environments, set minReplicas to at least 2 to maintain availability during low-traffic periods [12]. Also, remove the replicas field from Deployment manifests when HPA is active, as this prevents kubectl apply from overriding HPA's scaling decisions [8].
Driver Configuration for Hardware Resources
To complement your monitoring and autoscaling setup, configuring hardware drivers ensures specialised resources are allocated precisely when needed. Standard device plugins often limit resources to counts (e.g., 2 GPUs
), but DRA enables more detailed configurations, such as specifying 16GB memory
with NVLink
connectivity [13]. For GPU workloads, install drivers like the NVIDIA DRA driver using Helm, and configure node pools with appropriate taints (e.g., nvidia.com/gpu: NoSchedule) to restrict usage to specific workloads [10].
Ensure the DynamicResourceAllocation feature gate is enabled, and verify that your container runtime supports Container Device Interface (CDI).
When setting HPA targets, strike a balance between cost and performance. Low target utilisation (below 60%) can lead to higher costs due to over-provisioning but offers better reliability and responsiveness. On the other hand, high utilisation (above 80%) reduces costs but may result in latency during traffic surges. While custom metrics add some monitoring overhead, they provide the precision needed for unique workloads [13].
Benefits and Best Practices for Cost Reduction
Better Resource Usage and Performance
Dynamic Resource Allocation (DRA) offers clear benefits when it comes to resource performance and cost management. By matching hardware to real-time demands instead of relying on fixed estimates, DRA ensures applications receive precisely what they need - whether that's additional GPUs or CPU power during peak times - while avoiding idle or wasted hardware.
One of the key performance advantages is the elimination of resource contention. With static resource allocation, workloads often compete for limited resources, leading to inefficiencies. DRA resolves this by allowing flexible sharing of specialised hardware. For instance, technologies like Multi-Instance GPU (MIG) enable multiple workloads to share the same physical GPU efficiently. This approach helps maintain optimal node utilisation - usually between 60% and 80% - striking the right balance between cost-effectiveness and having enough capacity to handle unexpected surges.
Reducing Cloud Costs Through Precise Allocation
Static resource allocation often leads to overprovisioning, where organisations pay for reserved capacity they don’t fully utilise. DRA addresses this issue by dynamically adjusting resources based on actual usage patterns, significantly reducing waste. Monitoring the resource requests versus usage ratio offers valuable insights into overprovisioning, highlighting discrepancies between reserved and consumed resources.
Granular cost tracking - down to the level of namespaces or pods - further enhances visibility. This detailed view allows organisations to pinpoint which teams, projects, or applications are driving costs, enabling better resource allocation decisions. Additionally, network egress costs, which can vary depending on region or zone, are another area where strategic resource placement can lead to savings.
However, to fully realise these cost benefits, disciplined operational practices are essential.
Best Practices for Deployment and Scaling
Effective DRA implementation requires a focus on security, maintenance, and monitoring. Role-Based Access Control (RBAC) should be used to restrict access to DeviceClasses and ResourceSlices to administrators and DRA drivers, while developers should only interact with ResourceClaim and ResourceClaimTemplate APIs [3]. This separation reduces the risk of unauthorised changes to critical configurations.
During node maintenance, ensure the DRA driver is the last component to be drained, allowing it to complete hardware unpreparation tasks [4]. For clusters running Kubernetes v1.33 or newer, confirm that your DRA drivers support seamless upgrades to avoid scheduling delays during maintenance [3]. Regularly monitor the depth of the workqueue in the ResourceClaim controller using kube-controller-manager metrics to catch potential backlogs that could impact allocation performance [4]. Additionally, conducting quarterly reviews of resource quotas and usage ensures allocations stay aligned with changing workload demands.
Conclusion
Kubernetes Dynamic Resource Allocation is transforming how organisations manage cloud infrastructure by tackling issues like overprovisioning, underused hardware, and the limits of static scheduling. Instead of locking in fixed capacities that often go unused, DRA adjusts resources in real time to align with actual workload demands. This not only trims wasted cloud spending but also enhances application performance. According to the Cloud Native Computing Foundation's 2024 State of Kubernetes Report, businesses using dynamic allocation alongside monitoring can recover 20–40% of cloud budgets previously lost to overprovisioning.
The success of DRA hinges on real-time monitoring paired with automation. Tools such as the Horizontal Pod Autoscaler (HPA), when combined with metrics servers and monitoring platforms like Prometheus, offer the visibility and responsiveness needed for intelligent scaling. This approach ensures that CPU, memory, and even specialised hardware like GPUs are allocated exactly when needed, minimising resource contention and improving overall efficiency. With this setup, organisations can lay a strong foundation for long-term infrastructure optimisation.
The advantages are clear: infrastructure that grows with business demands, lower operational costs, and the ability to adapt to fluctuating workloads - whether it's AI/ML training or web applications handling sudden traffic surges. While setting up DRA requires initial effort, the returns in performance and cost savings are well worth it.
For businesses aiming to streamline their Kubernetes infrastructure, Hokstad Consulting offers bespoke services in cloud cost engineering and DevOps transformation. Their expertise includes DRA implementation and monitoring integration, helping organisations cut cloud expenses while speeding up deployment cycles. With their focus on automation and custom solutions, they guide businesses through the shift from static to dynamic resource management.
As cloud costs continue to climb and workloads grow more unpredictable, dynamic resource allocation has become a necessity for maintaining efficient and scalable infrastructure. By treating DRA as an ongoing improvement process, organisations can achieve both cost savings and sustainable growth.
FAQs
Does Kubernetes DRA support CPU and memory, or just GPUs and other devices?
Kubernetes Dynamic Resource Allocation (DRA) enables the allocation of resources like CPU, memory, and attached devices such as GPUs and other accelerators. This feature helps streamline and optimise the management of different resource types within Kubernetes environments, ensuring adaptability for diverse workloads.
What monitoring setup is needed before using HPA with DRA?
To enable the Horizontal Pod Autoscaler (HPA) alongside Dynamic Resource Allocation (DRA) in Kubernetes, you'll need to establish real-time monitoring for key metrics such as CPU, memory usage, and custom application data. Tools like Prometheus and Grafana are excellent choices for this purpose. They allow you to track Kubernetes-specific metrics and offer dashboards and alerting capabilities.
By integrating logs, metrics, and traces into a single view, you can monitor resource usage more precisely. This level of insight is crucial for ensuring that autoscaling functions as intended and resources are utilised efficiently.
What are the biggest pitfalls when enabling DRA in an existing cluster?
When enabling DRA in an existing cluster, several challenges can arise. One major issue is poor permission management for DRA-related APIs, which can open up security risks. Another common problem involves driver deployment and maintenance, as these can become cumbersome without proper processes in place. Additionally, the lack of smooth upgrade paths may result in scheduling delays or compatibility problems. To minimise these risks, careful planning and consistent monitoring are crucial.