
Continuous Delivery (CD) relies on automated pipelines to deliver code changes efficiently and reliably. Monitoring CD is essential to identify delays, improve processes, and ensure compliance, especially for UK organisations in regulated sectors. The DORA metrics - Deployment Frequency, Lead Time for Changes, Change Failure Rate, and Mean Time to Recovery (MTTR) - are key benchmarks for assessing CD performance.
- Deployment Frequency: Measures how often updates are delivered to production. Elite teams deploy multiple times daily.
- Lead Time for Changes: Tracks the time from code commit to deployment. Top teams achieve under a day.
- Change Failure Rate: Percentage of deployments causing issues. High performers keep this below 15%.
- MTTR: Time taken to recover from failures. Elite teams resolve incidents in under an hour.
Additional metrics like build reliability, approval wait times, and real-time monitoring of deployments and infrastructure help refine pipeline efficiency. Automation, clear KPI ownership, and regular reviews can help teams achieve faster, more stable releases while managing costs. For UK businesses, balancing regulatory requirements with these metrics is key to improving delivery performance.
::: @figure 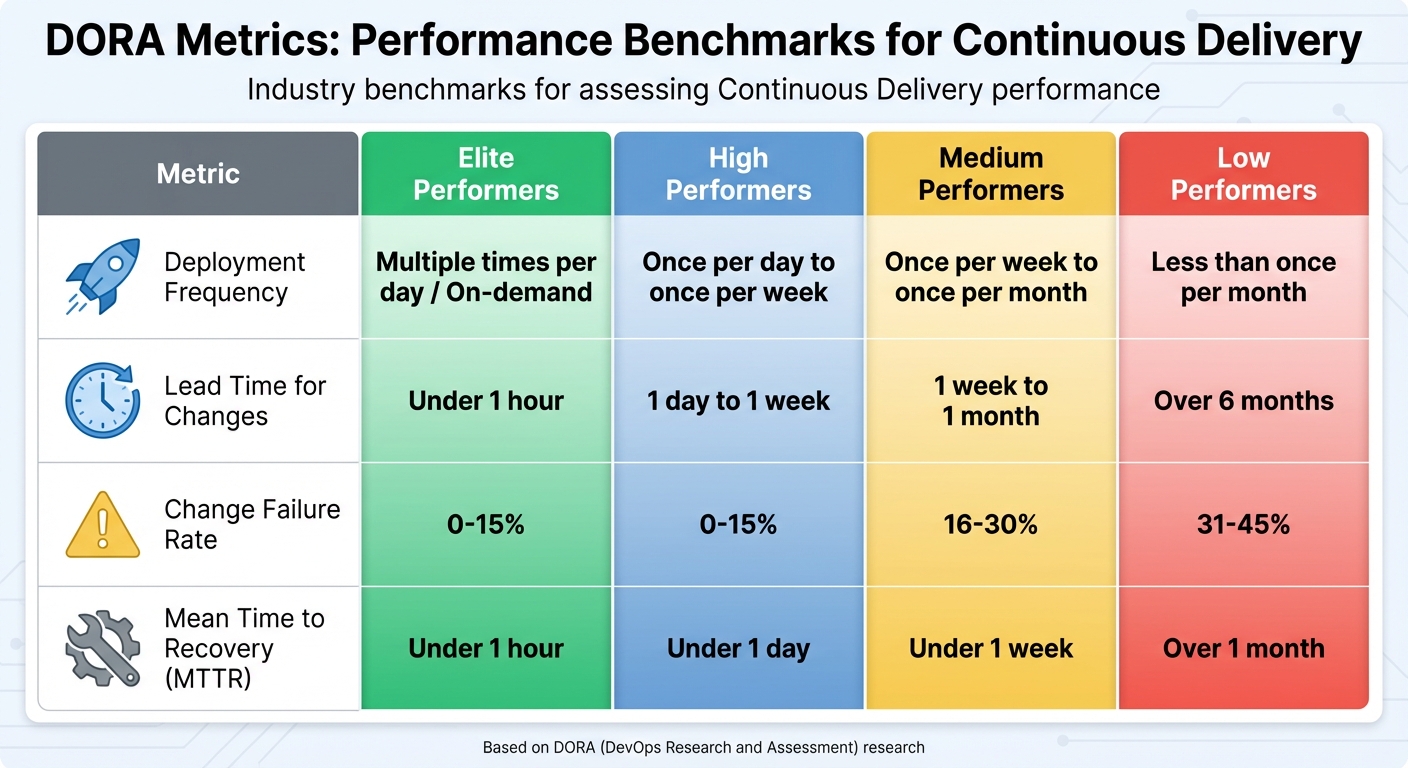 {DORA Metrics Performance Benchmarks: Elite vs Low Performing Teams}
:::
{DORA Metrics Performance Benchmarks: Elite vs Low Performing Teams}
:::
Measuring Software Delivery With DORA Metrics
Core Outcome KPIs for Continuous Delivery
The four core KPIs - deployment frequency, lead time for changes, change failure rate, and MTTR - are essential for monitoring Continuous Delivery effectively. Known as the DORA metrics, they provide a balanced perspective on speed (how quickly you deliver) and stability (how reliable your deployments are). By tracking these metrics, you can pinpoint where your pipeline performs well and where bottlenecks or quality issues might be slowing you down. Let’s dive into what each KPI measures, how to calculate it, and why it matters.
Deployment Frequency
Deployment frequency tracks how often successful deployments are made to production over a specific period - daily, weekly, or monthly [2][4]. To calculate, count all production deployments in your chosen timeframe and divide by the number of days or weeks. For example, 40 deployments over four weeks equals 10 deployments per week. This metric reflects how efficiently your CI/CD pipeline delivers value to your users.
In regulated UK industries, it’s important to segment deployments by type, such as standard changes versus emergency fixes, and consider CAB cycles to meet compliance needs.
Automating data collection is key. Use CI/CD tools and deployment platforms to log every production deployment, and visualise these counts on dashboards. Tools like Kubernetes or serverless platforms can aggregate deployment events, tagging them with service name, environment, and version. Ensure filters exclude non-production or dry-run deployments to focus on customer-facing releases [2][8]. Breaking down deployment frequency by service or product provides a clearer picture, helping product owners understand how often updates are delivered in their areas.
Lead Time for Changes
Lead time for changes measures the time from when code is committed (or a pull request is created) to when it’s running in production [2][4]. This KPI highlights how smoothly your development-to-deployment process flows and where delays might occur. It includes the time spent on code reviews, approvals, builds, tests, and deployment.
To measure this end-to-end, capture timestamps at key stages: commits and pull requests in your version control system, build and test events in your CI pipeline, and deployment logs from your CD tools [2][8]. By linking these timestamps using change IDs or commit hashes, you can calculate median and percentile lead times for each service. Many teams use built-in analytics from DevOps platforms or custom queries on audit logs to generate these insights.
For organisations in the UK, regulatory requirements like CAB approvals, risk assessments, and mandatory reviews can extend lead times, especially in sectors like finance, healthcare, and government. Track governance-related timestamps separately to distinguish engineering lead time
(commit to ready-for-release) from governance lead time
(approval to production). This separation helps identify bottlenecks and explore solutions like pre-approved standard changes or smaller, lower-risk releases that still meet compliance standards.
Change Failure Rate
Change failure rate is the percentage of production deployments that lead to degraded service and require remediation, such as rollbacks, hotfixes, or incident responses [4][7]. Calculate it by dividing the number of deployments causing incidents by the total number of deployments, then multiplying by 100. Elite teams aim for a rate below 15%, while less mature teams might see rates above 45% [4].
To measure this metric accurately, link deployment records from CI/CD tools with production incidents logged in ITSM or incident management systems [4][7]. Use deployment IDs or commit hashes to tag incidents, or correlate incident start times with recent deployments to affected services. Ensure your taxonomy clearly identifies deployment-caused incidents
to avoid counting unrelated issues like infrastructure failures [7].
Reducing change failure rates while maintaining or increasing deployment frequency is a hallmark of a well-functioning CD process [3]. Strategies include expanding automated test coverage, using blue–green or canary deployments to minimise risk, implementing feature flags for risky functionality, enforcing peer reviews, and incorporating static analysis into pipelines. Post-deployment monitoring and error tracking are also critical for catching issues early [2][3][8]. Specialist consultancies like Hokstad Consulting can assist in designing pipelines that balance speed and risk in complex environments.
Mean Time to Recovery (MTTR)
MTTR measures the average time it takes to restore normal service after a production incident that impacts users [2][4]. This typically starts when an incident is detected, either through monitoring alerts or user reports, and ends when service is restored to an agreed normal state (e.g., incident resolved and key SLOs back within thresholds) [2][9]. To calculate MTTR, sum the recovery times for all incidents in a given period and divide by the number of incidents. Exclude planned maintenance and non-user-impacting issues to focus on genuine service disruptions [4].
MTTR relies on effective alerting and on-call processes. Ensure alerts are well-calibrated and that on-call schedules comply with UK Working Time Regulations to guarantee a swift response.
Expert guidance, such as that from Hokstad Consulting, can help align on-call strategies and automation with both technical and regulatory requirements, enabling you to reduce MTTR effectively.
| KPI | Definition | Calculation |
|---|---|---|
| Deployment Frequency | How often code deploys to production | Number of deployments per time period (e.g., day/week) [4][3] |
| Lead Time for Changes | Time from commit to production | Average duration (commit timestamp to deploy timestamp) [2][4] |
| Change Failure Rate | % of deployments needing fixes | (Failed changes / Total changes) × 100 [4] |
| MTTR | Time to recover from failure | Average time from failure to restoration [2][4] |
Pipeline and Workflow Health Metrics
Once you've secured your core outcomes, it's time to dive deeper into the details. Monitoring pipeline and workflow health metrics can help identify bottlenecks like slow builds, unreliable tests, or long approval queues. These insights allow teams to fine-tune their processes for better speed and reliability [8]. By tracking these metrics on shared dashboards, teams can stay on top of their pipeline's performance, ensuring they're always ready to deploy. This builds on the foundation of core outcomes, pushing your pipeline's efficiency even further.
Commit-to-Deploy Time and Flow Efficiency
Beyond overall performance, it's crucial to focus on the timings of specific processes. Commit-to-deploy time measures how long it takes from a code commit to a successful production deployment. This metric captures every step, from initiating builds and running tests to passing approvals and completing deployment [2]. Tools like Jenkins and GitLab CI can record timestamps for each stage, making it easier to identify delays.
Taking this a step further, flow efficiency evaluates how much of that time is actively spent on tasks (like building or testing) versus waiting. You can calculate it as:
(active time ÷ total lead time) × 100%.
For example, if the total commit-to-deploy time is four hours but only one hour involves active work, your flow efficiency is 25%. High-performing teams often achieve 20–30% or more in flow efficiency [3]. A low percentage could indicate issues like build queue delays, slow approvals, or resource conflicts. Solutions might include running tests in parallel, limiting work-in-progress, or automating low-risk approvals.
Build and Test Reliability
Metrics such as build success rate and automated test pass rate are key indicators of pipeline stability [2]. Build success rate, calculated as (successful builds ÷ total builds) × 100%, should ideally exceed 90%. If your failure rate goes above 10%, it could point to problems like flaky tests or environmental inconsistencies.
Another important metric is test coverage, which measures the percentage of code exercised by automated tests. Aiming for over 80% coverage is particularly important for critical code paths. Poor build and test reliability can significantly slow down your pipeline. For instance, a 20% build failure rate could double commit-to-deploy time due to retries, while unstable tests might delay the pipeline by up to 30%.
Teams that address test flakiness often see dramatic improvements - some have even increased deployment frequency by 50%. Tools like Grafana, integrated with CI systems, can track these metrics and highlight areas for improvement. For example, Zeet dashboards have shown how optimisations reduced build times from 20 minutes to just five [8].
Release Approval and Change Management Latency
Approval wait time - the period between submitting a change for approval and receiving it - can be a major factor in extended lead times, especially for larger or regulated organisations in the UK [3]. While average approval times of one to two days are common, DORA elite teams achieve approval times of under an hour by leveraging automation. In industries like finance or healthcare, manual reviews can add approximately 40% to lead times due to regulatory requirements.
To tackle this, tools like GitLab and Harness can log approval timestamps, helping teams calculate average wait times. Delays can be cut down by automating low-risk approvals (e.g., peer reviews), using policy-as-code for compliance, and setting service-level agreements for turnaround times. One case study reported reducing approval latency from four hours to just 15 minutes, which boosted flow efficiency by 25% [2].
Integrating change records with your delivery pipeline - complete with test results, code reviews, and security scans - can reduce manual review effort while maintaining audit trails. For UK organisations with complex systems and strict regulations, working with experts like Hokstad Consulting can streamline DevOps workflows, align metrics with compliance needs, and introduce AI-assisted automation to cut costs and maintain auditability.
Need help optimizing your cloud costs?
Get expert advice on how to reduce your cloud expenses without sacrificing performance.
Real-Time Monitoring and Alerting Metrics
While pipeline health metrics help with long-term improvements, real-time monitoring steps in to provide immediate visibility when issues arise. These metrics act as an instant alert system, flagging anomalies within seconds so teams can quickly roll back or fix problems before users are affected [2][9]. For organisations with frequent releases, this real-time layer ensures continuous delivery remains both quick and reliable, complementing the pipeline health KPIs discussed earlier.
Deployment Event and Status Metrics
Building on core pipeline metrics, real-time deployment events offer instant operational feedback. Key metrics to track include deployment success rates, failure rates, rollback occurrences, queue times, and deployment durations [2][8]. For instance, a UK-based team might set up alerts through PagerDuty to notify the on-call engineer if two or more production deployments fail within 30 minutes or if deployment durations increase by over 50% compared to the previous week during business hours (09:00–17:30) [3][8]. These thresholds help maintain a balance between being responsive and avoiding alert fatigue. If you're unsure about setting the right limits, consultancies like Hokstad Consulting can help tailor these rules to suit your team’s specific needs and capacity.
Application and Service Health During Deployments
Keep an eye on service performance metrics like HTTP 5xx error rates, request latency percentiles (p95 or p99), and uptime [9][5]. Overlaying release markers on dashboards allows you to see if error spikes or latency increases align with new deployments [9][5]. For example, a UK e-commerce platform implemented real-time deployment and application performance monitoring (APM) alerts, which led to a reduction in MTTR from about 90 minutes to under 20 minutes within three months [2][9].
Pairing application performance with resource usage metrics completes the real-time monitoring framework.
Infrastructure and Resource Usage Metrics
Track metrics such as CPU usage, memory consumption, disk I/O, and network throughput during deployments to detect misconfigurations or performance issues [8][10]. A spike in CPU or memory usage after deployment might signal a memory leak or inefficient code, while unexpected autoscaling could lead to inflated monthly cloud costs in GBP [8][10]. One SaaS provider discovered unplanned autoscaling after a release, traced it back to a misconfigured cache, and improved both performance and cost efficiency [8][7]. By comparing these metrics to pre-deployment baselines, you can quickly revert changes or fine-tune resource settings, such as container limits, JVM heap sizes, or database connection pools. For UK businesses aiming to combine deployment safety with cost control, firms like Hokstad Consulting offer expertise in both DevOps practices and cloud cost management.
These real-time metrics integrate seamlessly into broader monitoring strategies, paving the way for more reliable and efficient continuous delivery processes.
Governance, Benchmarking, and Continuous Improvement
Once real-time monitoring is in place, the next step is to transform those metrics into a structured framework for improvement. Governance here isn’t about adding layers of bureaucracy - it’s about using a shared set of business-aligned KPIs to guide decisions and promote ongoing progress [3][4][6]. This naturally involves setting clear targets and comparing performance against industry standards.
Setting Targets and Benchmarking Against Industry Standards
Begin by using the DORA benchmark categories as a foundation. For instance, elite teams deploy on demand or several times per day, with lead times of under an hour. On the other hand, low-performing teams deploy less than once monthly, with lead times stretching beyond six months [4][6]. When it comes to Change Failure Rate, elite and high-performing teams keep their rates between 0–15%, medium performers fall in the 16–30% range, while low performers see rates between 31–45% [4][6]. MTTR (Mean Time to Recovery) follows a similar trend: elite teams resolve issues in under an hour, high performers within a day, medium teams within a week, and low performers take over a month [4][6].
For UK organisations, sector-specific factors often require adjustments to these targets. For example, financial services teams navigating FCA or GDPR compliance may face longer regulatory review times. In such cases, aiming for a 20% Change Failure Rate rather than the elite benchmark of 15% might be more realistic [4][7]. Use metric units and en-GB number formats (e.g., £1,000.00 for cloud costs) to ensure consistency. Tools like GitLab or Harness dashboards can help track progress, with a focus on reducing costs in GBP for hybrid cloud setups with AWS or Azure [4][7][6].
Once targets are in place, assigning clear ownership of KPIs becomes critical for maintaining momentum.
KPI Review Processes and Ownership
Define ownership for each KPI by role. For example, DevOps engineers can manage pipeline metrics like Deployment Frequency and Build Reliability, product owners can oversee outcome metrics such as Lead Time and MTTR, and executives can focus on governance metrics like Change Failure Rate [3][9]. Using RACI matrices is a practical way to assign responsibilities, ensuring collaboration across cross-functional teams. For instance, UK-based SREs and compliance officers can work together effectively through tools like Jira [3][9].
Set a cadence for reviews: engineers might conduct weekly reviews, team leads every two weeks, and executives quarterly. Tools like Grafana and Jira can simplify tracking, while automated alerts can flag threshold breaches - such as a Change Failure Rate exceeding 15%. Regular retrospectives help analyse trends like flow efficiency. Elite DORA teams often review daily to catch anomalies and benchmark monthly, implementing improvements such as parallel testing to cut build times by as much as 40% [2][3][4].
Integrating these reviews with your real-time monitoring ensures that operational data translates into actionable adjustments.
When internal efforts reach their limits, external expertise can provide a fresh perspective to refine your KPIs further.
Expert Consulting for KPI Optimisation
If you’re unsure how to translate benchmarks into actionable goals, consulting experts can provide valuable guidance. Specialist firms can help define relevant KPIs, redesign pipelines, and align your processes with DORA standards - all while keeping costs in check [7]. For instance, Hokstad Consulting offers DevOps transformation services, incorporating tools like Prometheus to track Deployment Frequency and MTTR. They also focus on cloud cost engineering, benchmarking resource usage in GBP. Their tailored automation solutions have enabled clients to achieve deployment cycles up to 10× faster, with measurable results.
For UK businesses juggling compliance requirements, hybrid cloud environments, and cost efficiency, expert advice ensures your KPIs not only improve safety in deployments but also deliver measurable value in pounds saved.
Conclusion
Key Takeaways
Keeping track of Continuous Delivery KPIs is a game-changer when it comes to achieving quicker deployments, minimising errors, and driving measurable business results. The DORA metrics - Deployment Frequency, Lead Time for Changes, Change Failure Rate, and MTTR - offer a solid snapshot of your pipeline's performance. Elite teams set the bar high, deploying several times daily, keeping Change Failure Rates between 0–15%, and resolving incidents in under an hour [4][6]. Beyond these core metrics, monitoring Pipeline Health - including Commit-to-Deploy Time and Build Reliability - alongside Real-Time Monitoring of deployments and infrastructure usage, helps identify bottlenecks and ensures smoother releases [2][8][10].
Getting started with effective monitoring doesn’t have to be overwhelming. Automating testing can cut lead times, dashboards can provide real-time insights into failures and recovery times, and regular trend analysis can pinpoint inefficiencies [2][9]. Assigning clear responsibilities is key: DevOps engineers should oversee pipeline metrics, while product owners manage outcome measures. Establish regular review schedules - weekly for engineers and quarterly for executives - to keep everything on track [3][9]. Industry benchmarks provide useful guidance, but remember to tailor targets to your sector’s challenges, such as regulatory demands in financial services.
The potential business impact is hard to ignore. Embracing DevOps practices can lead to deployments that are up to 75% faster, a 90% reduction in errors, and deployment cycles that are up to 10 times quicker thanks to custom automation [1]. One SaaS company even saved £120,000 annually through cloud optimisation, highlighting the financial benefits of efficient CD monitoring [1]. These examples show how refining your Continuous Delivery process can lead to tangible improvements.
Final Thoughts on Continuous Delivery Excellence
These insights highlight how strong monitoring practices can elevate your Continuous Delivery efforts. A data-driven approach to monitoring transforms engineering into measurable business outcomes, including faster time-to-market, less downtime, and happier customers [3][9]. Teams that consistently track and act on these metrics often outperform those that rely on guesswork, striking the right balance between speed and reliability throughout the software development lifecycle [7].
If you’re finding it challenging to turn benchmarks into actionable goals or optimise your existing pipelines, seeking expert help can make a difference. Hokstad Consulting offers tailored DevOps transformation services for UK businesses, focusing on building custom CI/CD pipelines, cutting cloud costs, and helping teams achieve elite DORA metrics through automation and AI-driven monitoring [7]. Whether you’re managing hybrid cloud environments or tackling compliance challenges, investing in the right KPIs and expert support ensures your Continuous Delivery practices remain a source of competitive strength.
FAQs
What are DORA metrics, and how do they help improve Continuous Delivery?
DORA metrics are a set of key performance indicators (KPIs) designed to evaluate the efficiency and reliability of DevOps and Continuous Delivery workflows. These metrics focus on four main areas: deployment frequency, lead time for changes, change failure rate, and mean time to recovery.
Tracking these metrics is crucial as they offer valuable insights into your team's software delivery performance. By monitoring DORA metrics, organisations can pinpoint inefficiencies, boost deployment speed, and improve the stability of their delivery processes. This not only enhances software quality but also supports better outcomes for the business overall.
How can organisations in the UK meet regulatory requirements while improving DORA metrics?
UK organisations can integrate regulatory compliance into their CI/CD pipelines to enhance their DORA metrics. By embedding compliance checks directly into the development process, they can automate security controls and maintain continuous monitoring. This approach ensures they meet regulatory requirements without slowing down deployment speed or affecting reliability.
Conducting regular audits is crucial for confirming compliance and spotting areas that need improvement. When these practices are seamlessly woven into deployment workflows, organisations can effectively meet regulatory demands while maintaining strong performance metrics.
How can we lower the Change Failure Rate while keeping deployment frequency high?
To lower the Change Failure Rate while keeping deployment frequency steady, focus on strategies that streamline processes and reduce risks. Automating CI/CD pipelines is a great way to cut down on manual errors, and implementing Infrastructure as Code ensures consistency in your environments. By adopting continuous testing, potential problems can be spotted early in the process, saving time and avoiding larger issues later on.
Using incremental deployments is another smart move. Rolling out smaller, more manageable updates makes it easier to isolate and address any problems that arise, helping to minimise disruption. On top of that, leveraging monitoring tools gives you real-time data on deployment performance, allowing for quicker fixes and ongoing refinement. These approaches not only improve system reliability but also support a smooth and efficient delivery process.