CI/CD pipelines are critical for delivering software efficiently, but without proper monitoring, they can lead to delays, failures, and inefficiencies. Tracking the right metrics and setting up alerts ensures pipelines run smoothly, avoiding production issues and improving team productivity. Here's what you need to know:
-
Core Metrics to Monitor:
- Deployment Frequency: How often code is deployed to production. High-performing teams aim for daily or multiple daily deployments.
- Lead Time for Changes: Time from code commit to production. Elite teams keep this under 24 hours.
- Change Failure Rate: Percentage of deployments requiring rollbacks or fixes. Healthy pipelines stay below 15%.
- Mean Time to Recovery (MTTR): Time to recover from failures. Top teams target under one hour.
-
Supplementary Metrics:
- Build and Test Metrics: Monitor build success rates, test pass rates (aim for ≥95%), and code coverage (≥80%).
- Deployment and Queue Times: Deployment times should stay under 30 minutes; queue times under a few hours.
- Infrastructure Health: Track CPU/memory usage, latency, and processing times to avoid resource bottlenecks.
-
Benefits of Early Detection:
- Faster issue resolution (MTTR under an hour).
- Reduced developer time spent on troubleshooting.
- Improved system stability and reliability.
-
Best Practices for Alerts:
Proper monitoring and alerting transform pipeline performance, enabling faster delivery and fewer disruptions. By focusing on these metrics and practices, teams can maintain dependable and efficient CI/CD operations.
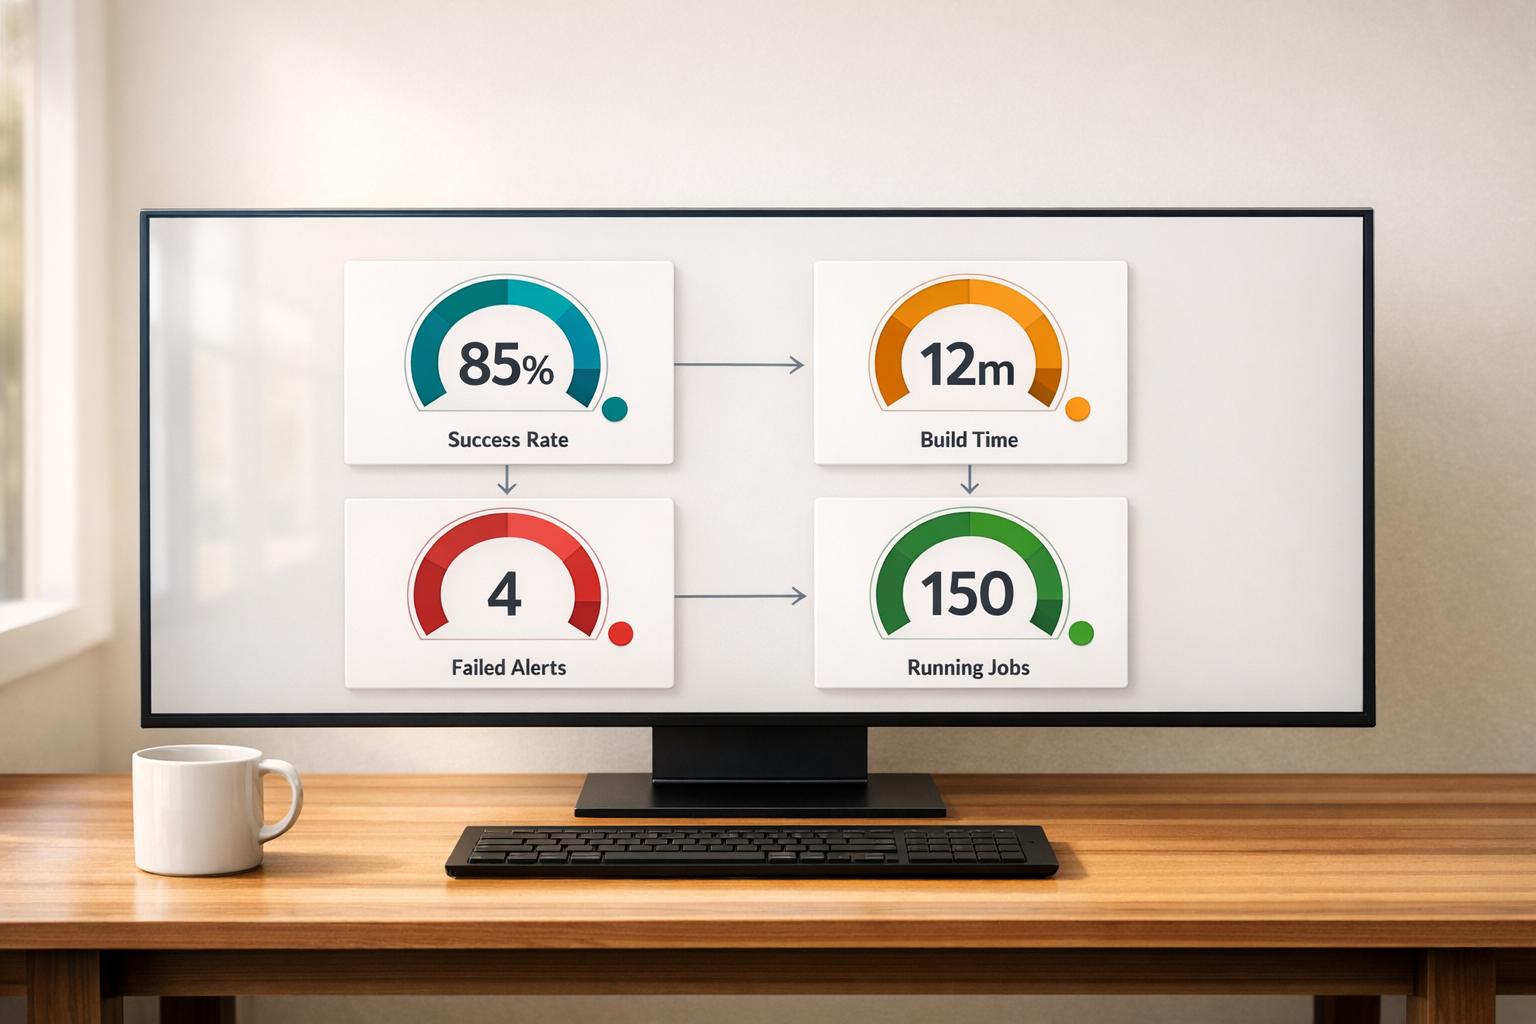
Core Metrics for Pipeline Alerting
::: @figure 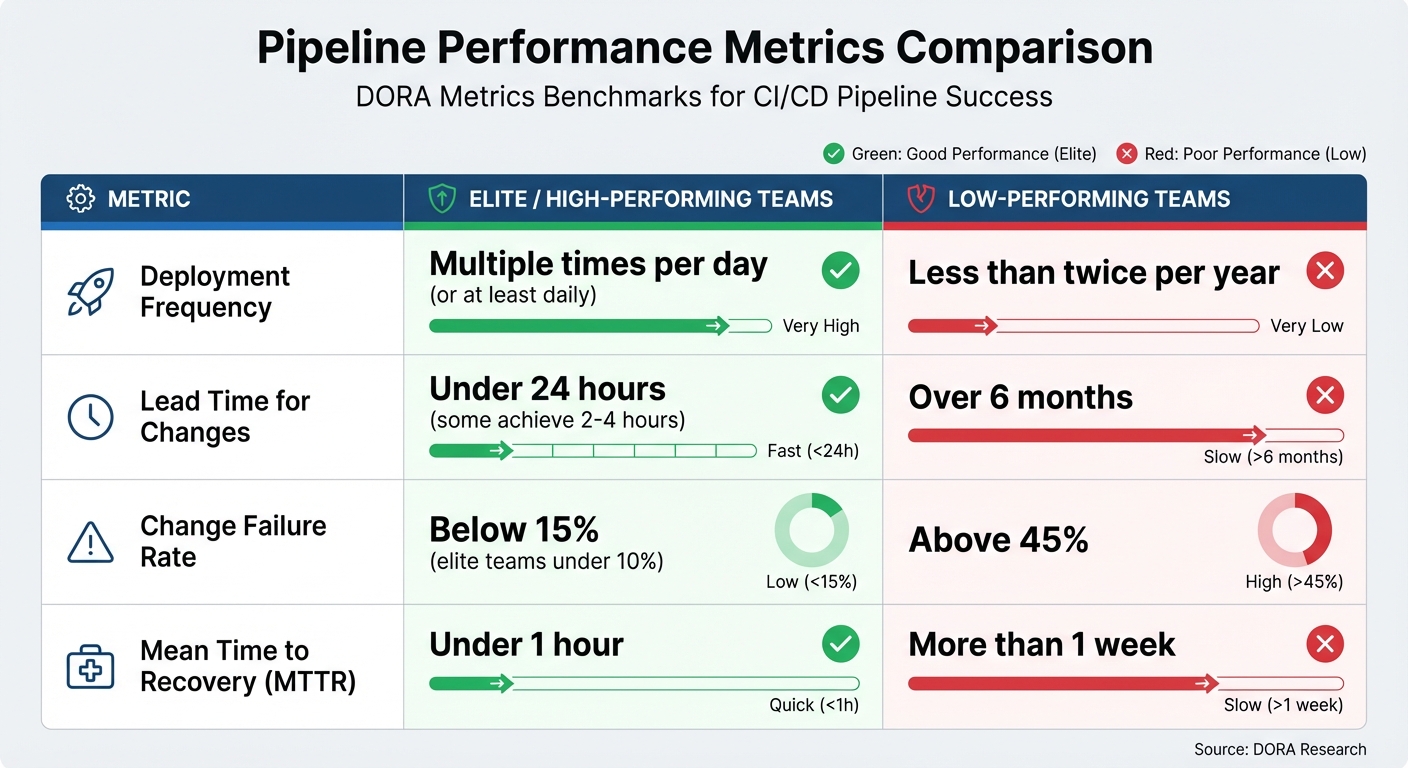 {CI/CD Pipeline Performance Metrics: Elite vs Low-Performing Teams Benchmarks}
:::
{CI/CD Pipeline Performance Metrics: Elite vs Low-Performing Teams Benchmarks}
:::
To catch issues early and keep delivery pipelines running smoothly, it's crucial to track the right metrics. At Hokstad Consulting, we focus on four core metrics: deployment frequency, lead time for changes, change failure rate, and mean time to recovery (MTTR). These metrics are the backbone of effective pipeline alerting and help distinguish high-performing teams from those struggling with delays and inefficiencies.
High-performing teams typically excel in these areas, while low-performing teams face significant challenges: deploying less than twice a year, taking over six months to move code from commit to production, experiencing failure rates above 45%, and needing more than a week to recover from issues [2]. Such gaps can seriously hinder a company's ability to adapt and meet customer expectations. Let’s break down each metric and its role in improving CI/CD performance.
Deployment Frequency
Deployment frequency tracks how often new code reaches production and serves as a key indicator of pipeline agility. High-performing teams aim for at least daily deployments, with elite teams achieving multiple deployments per day [2]. If deployment frequency drops below a set baseline, it could point to resource shortages, process inefficiencies, or other bottlenecks.
For instance, in 2025, the Development Bank of Canada used flow metrics to streamline their pipeline. Within three months, they cut pull request cycle time by 70% and saw a tenfold return on investment by refining their delivery processes [4].
Lead Time for Changes
This metric measures how long it takes for code to move from commit to production. It highlights inefficiencies across the delivery pipeline. High-performing teams keep lead times under 24 hours, with some achieving deployment times of just 2–4 hours [2][4].
If lead times start to exceed expectations or deviate from historical trends, it’s a sign that something’s off. Analysing logs and traces can help pinpoint where delays occur - whether in testing, artefact transfers, or deployment processes [2].
Change Failure Rate
The change failure rate reflects the percentage of deployments that fail or require rollbacks. It’s a measure of how robust and reliable the testing and integration processes are. Healthy pipelines maintain failure rates below 15%, and elite teams often go even lower, staying under 10% [2].
Spikes in failure rates should trigger alerts for immediate action. A great example: in June 2024, a UK-based fintech company used canary releases to detect a 30% increase in response times. This triggered a rollback, preventing a wider disruption [4].
Mean Time to Recovery (MTTR)
MTTR captures how quickly a team can recover from production issues - from identifying the problem to deploying a fix. High-performing teams aim for an MTTR of under one hour [2].
If recovery times exceed this target or start trending upwards, it signals a need for better incident response strategies. In 2023, Alexander Lystad, CTO of Visma, introduced a system where teams logged every production issue in Jira. This data was fed into Tableau, enabling them to track metrics like MTTR, deployment frequency, and change failure rates across 65+ teams [4]. A prolonged MTTR often highlights deeper pipeline inefficiencies or gaps in incident management.
Additional Metrics for Deeper Insights
Core metrics are great for measuring overall performance, but they don’t always tell the whole story. These supplementary metrics dig deeper, uncovering operational issues that might otherwise go unnoticed. By focusing on builds, tests, deployment timing, and infrastructure health, teams can ensure their pipelines stay reliable and nip problems in the bud.
Build and Test Metrics
Metrics like build success rate and test pass rate are key indicators of pipeline stability. If build success rates drop below 90–95% or test pass rates fall under 95%, it’s time to act. High-performing teams aim to keep artefact pass rates above 95%, using automated alerts to respond quickly to downward trends based on historical data.
Another critical metric is code coverage, which measures how much of the codebase is tested. If coverage falls below 80%, it’s a red flag. Top teams aim for over 90% coverage and set alerts to trigger if it dips below 80% [1][6]. By integrating code coverage reports directly into pipelines, regressions can be caught immediately. Paired with test pass rate monitoring, this approach ensures the effectiveness of tests and helps maintain quality over time.
Deployment Time and Queue Time
Deployment time tracks how long it takes to get code into production once the deployment process begins. High-performing teams aim for deployment times under 30 minutes, with alerts set for durations exceeding one hour [1][2][3]. Breaking down deployment stages - like artefact transfers, environment setup, or health checks - can help identify bottlenecks.
Queue time, on the other hand, measures how long changes are stuck waiting before the pipeline even starts. Long queue times often point to resource issues or inefficient job scheduling. If queue times regularly exceed a few hours, it’s a sign that scaling efforts - like adding more build agents or improving job prioritisation - are needed [2][3]. Setting combined alerts for queue times over two hours and deployment times over one hour can help focus on persistent bottlenecks while avoiding unnecessary noise.
Infrastructure and System Health Metrics
A pipeline’s performance relies heavily on the infrastructure supporting it. Monitoring metrics such as CPU usage, memory utilisation, latency, and processing time can reveal resource constraints that lead to delays or failures. Suggested alert thresholds include CPU usage above 80%, memory usage exceeding 85%, latency spikes more than 15% above baseline, and container processing times over 10 seconds [4][6]. For API rate limits, alerts should trigger at 80% of the quota - for example, 800 out of 1,000 calls per hour - to avoid throttling issues.
Here’s an example: XYZ HealthTech monitored Kubernetes metrics like CPU and memory usage, enabling them to implement auto-scaling. This adjustment reduced machine learning training job failures by 35% [4]. By integrating infrastructure metrics with pipeline observability tools, teams can quickly identify whether issues stem from code changes or resource limitations, making troubleshooting far more efficient.
Best Practices for Setting Up Alerts
When it comes to maintaining the performance of your CI/CD pipeline, setting up alerts correctly is a game-changer. Alerts should strike a balance: they need to catch real issues without overwhelming your team with unnecessary noise. The key? Make sure every alert serves a clear purpose and integrates seamlessly into your team's workflows. Without actionable alerts, you risk either missing critical warnings or drowning in irrelevant notifications.
Reducing Alert Fatigue
Every alert should lead to action - this is non-negotiable. Nawaz Dhandala, an engineer at OneUptime, explains it perfectly:
If an alert fires and the on-call engineer cannot take a specific action to resolve it, the alert should not exist.
This philosophy underpins symptom-based alerting. Instead of relying solely on internal metrics like CPU usage, focus on what users experience - such as error rates or latency spikes. After all, a high CPU usage alert is meaningless if it doesn’t impact users.
To further refine your alerts:
- Set sustained thresholds: For example, only trigger a CPU usage alert if it stays above 85% for 10 minutes. This avoids unnecessary alerts caused by short-lived spikes.
- Prioritise critical alerts: Route urgent issues to on-call engineers immediately, while logging informational alerts for later review.
- Group related alerts: Use intelligent grouping to consolidate multiple notifications into a single, summarised alert.
- Regularly review alerts: Schedule triage sessions to weed out redundant or non-actionable alerts and improve overall signal quality.
Once the noise is under control, the next step is to set meaningful thresholds that align with proven industry benchmarks.
Setting Alert Thresholds Using Benchmarks
Benchmarks like the DORA metrics provide a reliable foundation for setting alert thresholds. Elite-performing teams, for instance, typically:
- Deploy multiple times daily
- Keep lead times under one hour
- Maintain change failure rates between 0–15%
- Restore service within an hour [8][9]
Use these metrics to define actionable thresholds. For example, trigger alerts if change failure rates exceed 15% or if lead times stretch beyond an hour - especially if your team is aiming for elite performance.
Dynamic thresholds often outperform static ones. For instance, set alerts at 150% of a rolling seven-day average to account for natural variations in performance. Additionally, automated rollback triggers can safeguard your system by rolling back changes when failure rates cross predefined limits, ensuring alerts signal real problems rather than false alarms [9].
Connecting Alerts with DevOps Workflows
Alerts are only as effective as the workflows they support. Tailor notifications to specific roles - for example, developers might handle test failure alerts, while operations teams focus on infrastructure issues. For every critical alert, link it to an incident response playbook that outlines steps for investigation, impact analysis, and resolution. This ensures a quick and effective response [7].
To integrate alerts into workflows:
- Use unified dashboards: Combine pipeline metrics with application telemetry to create a single source of truth.
- Automate responses: Implement automated remediation like rollbacks or feature flag toggles to handle faulty deployments without manual intervention.
- Keep dashboards simple: Limit them to 6–8 key metrics to avoid information overload.
- Run periodic checks: Use simple
hello world
jobs to verify CI health. If these jobs fail, it often points to infrastructure problems rather than code issues.
Conclusion and Next Steps
After diving into core and supplementary metrics, it's clear how these elements can shape a more effective alerting strategy. The four core metrics - deployment frequency, lead time for changes, change failure rate, and MTTR (Mean Time to Recovery) - form the backbone of this approach. Supplementary metrics, such as build duration, test pass rates, and infrastructure health, add an extra layer of insight. When alerts are properly set up, they transform pipeline performance by offering clarity and enabling high efficiency. Integrating these alerts into day-to-day workflows is crucial for success.
Continuous improvement is essential. Thresholds should evolve based on your team's past performance and maturity level. Regularly reviewing the effectiveness of alerts and conducting post-incident analyses ensures your strategy keeps pace with organisational growth and changing needs.
Integrating alerts with incident-response tools like Slack or PagerDuty ensures swift action when issues arise. Additionally, correlating pipeline metrics with application logs and infrastructure telemetry makes troubleshooting faster and more precise [2]. This is especially important considering that 75% of organisations have reported security incidents linked to CI/CD environments [5].
The benefits of getting this right are hard to ignore. For instance, XYZ HealthTech reduced training job failures by 35% by monitoring Kubernetes cluster health metrics and setting up automated alerts for node scaling [4]. These improvements highlight how effective monitoring and alerting can lead to faster delivery, better system reliability, and noticeable cost savings.
Hokstad Consulting offers expertise in DevOps transformation and cloud infrastructure optimisation, helping businesses achieve results like reducing cloud costs by 30–50% while speeding up deployment cycles. Visit hokstadconsulting.com to learn how tailored DevOps solutions can enhance your pipeline performance.
For more information on setting up and integrating alerts, check out the Best Practices section above. By adopting these strategies, you can move from a reactive pipeline to a proactive and dependable delivery system.
FAQs
Which 4 metrics should we alert on first?
The initial four metrics to focus on for alerts are deployment frequency, lead time for changes, change failure rate (CFR), and mean time to recovery (MTTR). These are well-regarded as critical measures of pipeline performance and reliability. By keeping an eye on these, teams can quickly spot problems and ensure workflows remain smooth and productive.
How do we set thresholds without causing alert fatigue?
To combat alert fatigue, prioritise high-priority, actionable alerts and fine-tune sensitivity settings to reduce false positives. Introduce multiple alert levels with defined escalation procedures, ensuring teams are only notified when it's genuinely necessary. This method helps avoid overwhelm and ensures alerts remain relevant and effective.
How can we tell if failures are caused by code or infrastructure?
Failures can often be traced back to either code issues or infrastructure problems. To figure out the root cause, you can look at key metrics like the deployment success rate, build success rate, and patterns in failures. These indicators can reveal whether the problem stems from coding errors or something deeper within the infrastructure.