If your cloud forecast does not change a budget, an alert, or a commitment decision, it is not doing much.
I’d sum the article up like this: predictive FinOps works when I tie one forecast to one cost decision, feed it with clean billing data and business drivers, then push the result into the tools teams already use. The core jobs are simple: use 6–12 months of billing history, aim for 90%+ tag coverage, track MAPE and bias, review forecast variance each month, and act when spend looks set to hit 80%, 100%, or 120% of budget.
Here’s the short version:
- Start with a use case that has an owner: month-end forecast, team budget, commitment sizing, or GPU spend control.
- Clean the data first: remove credits and one-off items, standardise to £, and check billing exports across AWS, Azure, and Google Cloud.
- Use the simplest forecast that fits: native cloud forecasts for baseline planning, custom models when business events or AI demand change the picture.
- Connect forecasts to action: budgets, Slack or Teams alerts, dashboards, and commitment planning.
- Review forecast vs actual each month: investigate variance above ±5% at top level or ±10% by team or product.
A few points stand out. Native cloud tools are a good first step, but they mostly project from past usage. They do not account for a product launch, a marketing push, or a spike in ML training. That is where driver-based or ML-led models can help, especially when AI workloads move fast and monthly spend can jump without much warning.
I also think the article makes one point very clear: forecast accuracy matters only when it changes a money decision. For example, if a model shows August spend heading to £280,000 against a £250,000 budget by 17/08/2026, the value is in triggering action mid-month, not in logging the overrun after month-end.
So the article is not just about modelling. It is about building a loop:
- forecast spend
- compare with budget
- alert the right owner
- adjust commitments, usage, or workload timing
- review actuals
- update the model
That is the part I’d keep in mind before reading the full piece.
::: @figure 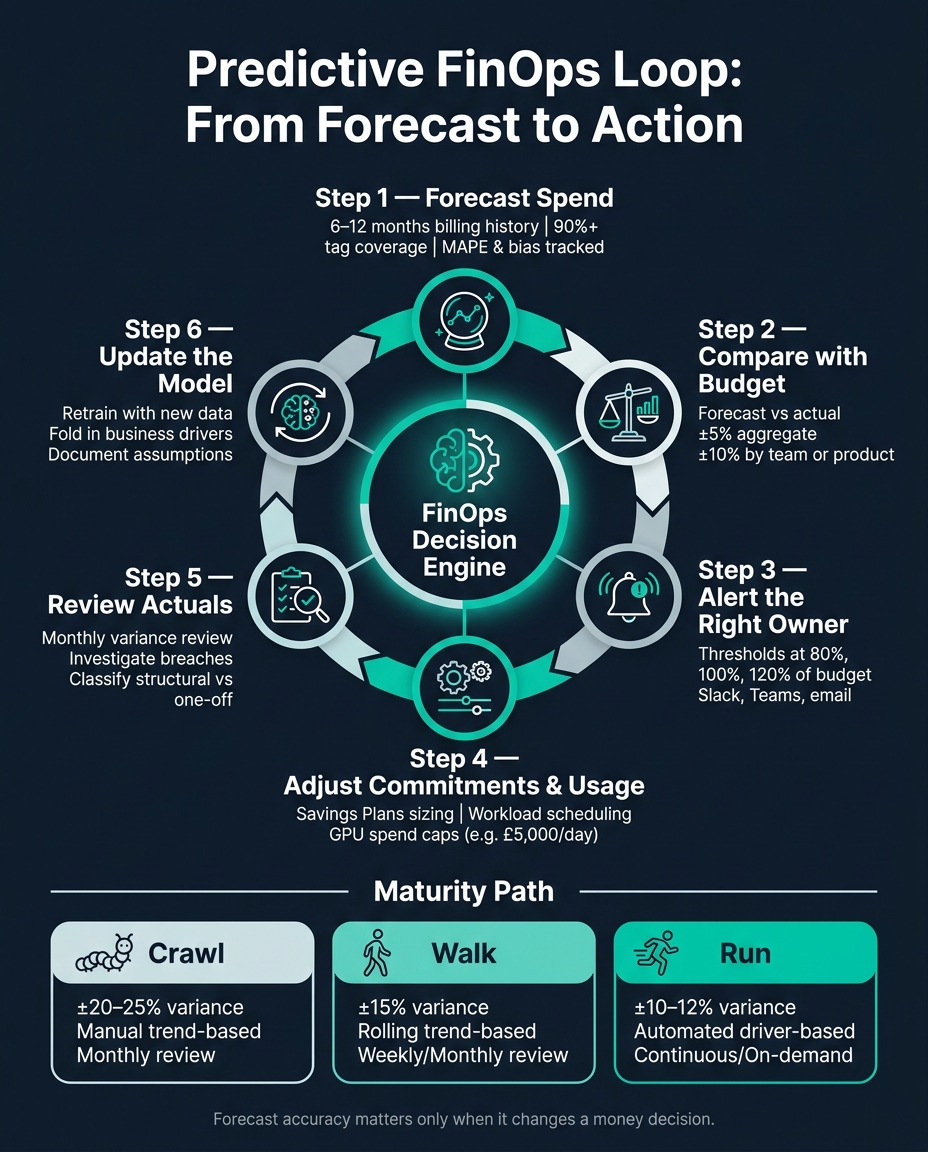 {Predictive FinOps Loop: From Forecast to Action}
:::
{Predictive FinOps Loop: From Forecast to Action}
:::
Step 1: Define the use case and prepare the right cost data
Choose a forecast that supports a real FinOps decision
A forecast without a clear owner is just noise.
Start with one forecast tied to a real FinOps decision. That decision should affect a budget, a commitment, or a capacity plan. The four most common use cases are month-end spend forecasts, team or product budget projections, seasonal capacity planning, and AI/ML workload forecasting.
Each one needs two things:
- a named decision owner
- a clear success metric
For example, you might aim to cut month-end cloud cost surprise to under 3% of budget.
Once the use case is set, check the data behind it before you build anything.
Check data quality before building any model
Forecast accuracy starts with clean billing data. Before modelling, audit what you have.
You need at least 6–12 months of continuous billing and usage history for each cloud provider. Twelve months is better because it helps you spot seasonal patterns, such as November–December retail peaks and March public sector year-end spikes. Daily data is the best place to start. Monthly totals can work for high-level budgeting, but they miss the detail you need for anomaly detection and short-term forecasting.
Check these three areas first:
- Tagging coverage: Work out what share of spend is tagged to a team, product, or environment. Aim for above 90% before building team-level or product-level models.
- Non-recurring items: Refunds, credits, and one-off charges can distort forecasts. Flag them and leave them out of training data.
- Consistency checks: Make sure spend trends line up with known business events. If they do not, the problem may be a misconfigured export or a change in billing structure.
On AWS, configure Cost and Usage Reports (CUR) with daily CUR exports to S3. On Azure, use Cost Management + Billing daily exports. On Google Cloud, enable Billing export to BigQuery with labels enabled. Standardise all amounts to £ and normalise dates to UK format, such as 17/08/2026, before you analyse anything.
Once the data is clean, connect cloud spend to the business activity that drives it.
Map business drivers to cloud cost drivers
Past spend tells you what happened. Business drivers tell you what is likely to happen next.
Use leading indicators alongside billing data. These are metrics tied to business activity that tend to move before cloud consumption changes. For a UK e-commerce business, that could be daily sessions and order volume. For a fintech platform, transaction counts and partner API calls. For an AI product, training runs and inference requests per day.
Here’s how common business metrics map to cloud cost drivers:
| Business Metric | Cloud Cost Driver | Example Unit Cost |
|---|---|---|
| Daily active users | Compute instance hours, database queries, cache usage | £50/day per 1,000 additional users |
| API requests | API gateway calls, serverless function invocations, network egress | £80 per 1 million calls |
| Storage growth | Object storage GB, database storage, backup volumes | £3–£5/month per 50 GB |
| GPU-hours (AI/ML) | Training jobs, inference batches, AI platform usage | Varies by GPU type and provider |
With the use case, data, and drivers in place, the next step is picking the forecasting method and FinOps tool that fit your setup.
Need help optimizing your cloud costs?
Get expert advice on how to reduce your cloud expenses without sacrificing performance.
Step 2: Choose FinOps tools and forecasting methods that fit your environment
Start with native forecasting in AWS, Azure and Google Cloud
Start with the forecasting tools already built into each cloud provider’s billing console.
AWS Cost Explorer projects spend up to 18 months ahead using up to 36–38 months of historical data [7][13]. AWS Budgets adds forecast-based alerts, so teams get notified when projected spend is likely to pass a set threshold [5][11].
Azure Cost Management forecasts up to a year ahead inside Cost Analysis. It also supports management groups and tags, which makes it easier for UK organisations to split spend by department or cost centre [10][12].
Google Cloud Billing projects spend up to 12 months forward at project or account level. Its budget notifications can be sent to email or Google Chat [6][8][9].
For many teams, that’s enough to cover baseline visibility and simple monthly reporting, as long as billing is set to GBP. The catch is pretty simple: these tools mostly project from past usage. They don’t natively factor in planned product launches, marketing pushes, or shifts in AI workload intensity.
So use native forecasts as your starting point. Then bring in custom models only when a decision needs more context or tighter accuracy.
Choose a model type based on data maturity and planning needs
Pick the simplest model that fits your data quality and planning window. The point isn’t to build the fanciest model. It’s to support the budgeting, commitment, or capacity decision in front of you.
Prophet works well with 12–24 months of stable, well-tagged history. ARIMA suits short-term, steady workloads [2][4]. Both can work for high-level budgeting. But when you’re making commitment decisions like AWS Savings Plans or Azure Reservations, you’ll often want a tighter forecast.
Driver-based models make more sense when spend links cleanly to a business metric. Think order volume for a UK retailer. If you can connect that metric to billing exports at daily or weekly level, you can build forecasts that reflect how the business actually moves.
Some costs don’t rise in a straight line, especially with AI workloads. That’s where ML-based approaches such as LSTM networks can help. In 30-day forward forecasts, they have shown MAPE of 8.7–14.3%, compared with 15.2–24.6% for linear regression baselines. That’s a 23–41% gain in accuracy [3].
There’s a trade-off, though. These models need more engineering work, version-controlled datasets, and checks for data drift. In plain terms, they’re worth the effort only when better accuracy changes a money decision.
When you assess any model, track both MAPE and bias. For budget setting, a slight over-forecast is usually safer than a pattern of under-forecasting.
Native forecasts vs custom predictive models: comparison table
Use the table below to match the forecasting method to the planning job.
| Dimension | Native Cloud Forecasts | Custom Predictive Models |
|---|---|---|
| Setup effort | Low - available in console | High - needs data pipelines, feature engineering and model upkeep |
| Customisability | Limited - historical extrapolation only | High - can include business drivers, scenario inputs and custom parameters |
| Forecast horizon | Up to 18 months (AWS), 12 months (Azure and Google Cloud) | Flexible - matched to your planning cycle, such as 12–24 months |
| Business drivers | Not supported natively | Included directly, such as user growth, transaction volume or AI workload |
| Accuracy tuning | Controlled by the provider | Tuned with MAPE, bias and regular retraining |
| GBP reporting | Supported if billing currency is GBP; multi-cloud reporting may still need manual reconciliation | Centralised across clouds and cost centres in GBP |
| Multi-team FinOps | Harder to standardise across providers without an overarching framework | Built to support shared tagging standards and consistent reporting structures |
Once you’ve chosen the model, plug the output into budgets, dashboards, and alerts.
Forecasting Cloud Costs FinOps FOCUS and Power BI
Step 3: Connect predictive outputs to daily FinOps workflows
Once you’ve picked the model, the next job is simple: get its output into the tools people already check every day.
Push forecasts into budgets, dashboards and alerts
Send forecast outputs into the same budget and alert channels your teams already use. That means feeding predicted monthly spend into AWS Budgets, Azure Budgets, or Google Cloud Budgets at the ownership level that makes sense - per account, subscription, tag, or cost centre.
Set forecast-based alerts at practical points, usually 80%, 100%, and 120% of budget. Show those thresholds in £, and send them to both the engineering lead and the central FinOps function by email, Slack, or Microsoft Teams.
There are a few platform details worth planning for.
- AWS Budgets needs about five weeks of usage data before it can produce forecast alerts[16][13]
- AWS daily budgets don't support forecasted alerts[15], so monthly budget periods work better for predictive controls
- Google Cloud forecast alerts estimate spend through to the end of the current calendar month[14], which makes them useful for mid-month action
Here’s what that looks like in practice. If a forecast in the second week of August shows spend heading for £280,000 against a budget of £250,000, a 112% alert should hit finance and engineering leads before month-end, not after the overrun lands.
Dashboards need the same level of clarity. Show forecast versus actual by team or product using UK-style monthly periods, such as 1 July–31 July. Put both figures in £ and show a plain variance metric next to them. If Team A was forecast to spend £45,000 in July but actual spend came in at £52,000, that’s a +15.6% variance. People should see that at a glance, not hunt for it in a spreadsheet.
Alerts should lead to action, not just more noise.
Use forecasts to guide commitment and optimisation decisions
Forecast baselines help with commitment sizing, workload timing, and day-to-day cost controls. In practice, that means using forecasts for Reserved Instance sizing, Savings Plans coverage, rightsizing, and workload scheduling.
For commitment decisions, the model should estimate steady-state usage over a period that matches the commitment term, usually one to three years. Say a production Kubernetes cluster is forecast to settle at around 800 vCPUs with only ±10% seasonal variation. In that case, covering 60–80% of that baseline with commitments is often a sensible move, while keeping the rest on-demand to handle spikes. Pair those volume forecasts with £-per-unit rates so finance can see the expected savings from each commitment mix before approval.
For non-production and variable workloads, shorter forecasts - daily or hourly - are often more useful. They show when demand is likely to dip, which gives teams room to move batch jobs, builds, or model training into cheaper windows.
For AI and GPU workloads, put firm controls in place. Set spend caps such as a daily GPU limit of £5,000, then feed forecast outputs into automation tools. That way, if spend is heading too high, the system can defer low-priority experiments or switch to cheaper instance types before the bill gets out of hand.
From model output to FinOps action: workflow table
Each forecast signal should map to one owner and one action.
| Forecast Input | Model Step | FinOps Tool | Owner | Resulting Action |
|---|---|---|---|---|
| Tagged product-team spend history | Trend-based baseline; publish next-month forecast | AWS Cost Explorer / Azure Budgets | FinOps Analyst | Set August baseline budget in £; publish to dashboards for team review |
| Steady-state compute baseline | Commitment sizing optimisation | AWS Budgets / AWS Cost Explorer | FinOps Lead + Finance | Propose 1-year Savings Plan purchase; submit for finance approval |
| Forecast breach at 110% of monthly budget mid-period | Forecast alert triggered | AWS Budgets / Azure Budgets / Google Cloud Budgets | Engineering Lead | Investigate tagging gaps, review autoscaling policies, pause discretionary work |
| Short-horizon GPU demand forecast | Anomaly and spike detection | ML platform + Slack / Teams alert | ML Engineering Lead | Reschedule low-priority training jobs; enforce daily GPU spend cap of £5,000 |
| Persistent low utilisation in test environment | Rightsizing and scheduling review | Internal FinOps dashboard / Jira | Service Owner | Downsize instance types or schedule off-hours shutdown for remainder of month |
Step 4: Set up governance, ownership and a review cycle
Once forecasts start feeding budgets and alerts, governance is what keeps them useful. If nobody checks a predictive model, its value drops fast. Forecasts drift. Assumptions get old. And before long, teams stop trusting the numbers.
A simple review rhythm fixes that. It gives finance, engineering and platform teams a shared way to work from the same numbers and turn forecasts into decisions.
Assign clear ownership for forecasts and decisions
Every forecast needs a clear owner for the model, the cost data behind it and the decisions that follow. One simple way to lock this down is with a responsibility matrix that covers model updates, monthly forecast sign-off, tagging standards and exception handling for large unplanned spend swings. That gives each team a clear part in the model-to-action chain from Step 3.
| Team | Primary Responsibility | Key Deliverable |
|---|---|---|
| Finance | Budget frameworks, cost allocation rules, financial reporting | Budget frameworks and reporting |
| Engineering & Platform | Tagging, resource configuration, optimisation actions | Tag coverage dashboards, rightsizing actions |
| FinOps | Forecast governance, variance review, alert management | Monthly variance report |
| Product | Demand forecasts, business event calendar | Planned launch and growth inputs |
| Data / Analytics | Model maintenance, retraining, accuracy monitoring | Forecast accuracy metrics |
For major spend decisions, such as renewing a multi-year Savings Plan or approving a large AI workload expansion, use a joint approval forum. Finance, product and engineering should all be involved, with platform input where needed. A short playbook also helps. It makes it clear who signs off what before any commitment is made.
Run a monthly forecast-versus-actual review
Use a fixed monthly review rhythm:
- Pull actual cloud spend for the previous month, broken down by account, service, environment and business unit, in GBP (£).
- Compare actuals with the latest forecast at total cloud spend, product and team level, then calculate the variance.
- Investigate anything above ±5% at aggregate level or ±10% at product or team level. [1][17]
- Classify each variance as structural, so it can be folded into the model, or as a one-off anomaly.
- Agree actions with named owners and capture them in a shared review pack.
Mature FinOps teams typically target forecast variance of under 5%. [1] If workloads are volatile, add a weekly anomaly check between monthly reviews so teams can spot issues sooner. [17]
It also helps to document the assumptions behind each forecast. That includes seasonality adjustments, planned product launches, architecture changes and commitment coverage. Then, when a variance shows up, the team can trace what changed and why instead of guessing.
When to bring in specialist support
Bring in Hokstad Consulting when internal teams don’t yet have the pipelines, allocation rules or governance needed to turn forecasts into action, especially for AI and ML workloads.
Conclusion: Treat predictive FinOps as an ongoing process, not a one-off model
The real test isn't the model itself. It's whether the forecast changes budgets, alerts, and commitment decisions.
Predictive FinOps starts working when forecasts lead to action. That usually means a few simple things done well: one clear use case, clean tagged data, the simplest model that fits the job, and direct links to budgets, dashboards, and alerts.
Forecasts only stay useful if optimisation work is part of the picture and actual spend is checked against the forecast on a regular basis. Otherwise, even a decent model can drift and lose its value.
The table below shows the maturity path:
| Maturity Level | Forecast Variance Target | Forecasting Method | Review Cadence |
|---|---|---|---|
| Crawl | ±20–25% | Manual, trend-based | Monthly |
| Walk | ±15% | Rolling, trend-based | Weekly/Monthly |
| Run | ±10–12% | Automated, driver-based | Continuous/On-demand |
Aim for progress, not perfection. Start with native cloud forecasts, plug them into your current budget and alert workflows, and only expand when accuracy gets better. A monthly variance review should stay your default control.
If you need help with pipelines, governance, or automation, Hokstad Consulting can help.
FAQs
When should I move beyond native cloud forecasts?
Move beyond native cloud forecasts if your environment changes fast. If workloads shift often, product launches come thick and fast, or growth is hard to call, past usage data won’t tell the full story.
You may also need more advanced models when basic estimates aren’t precise enough. That includes forecasting from active user numbers or units sold, matching forecasts to UK financial periods, and dealing with GBP currency swings. Native tools can produce a lot of variance for new or changing deployments, often in the 20% to 70% range.
What data issues most often break FinOps forecasts?
The biggest cause is poor data quality.
Common problems include:
- unclean historical data, such as one-off purchases, anomalies, or costs from deleted resources
- fragmented billing data across cloud providers
- missing business context, such as product launches or architecture changes
- currency volatility, especially between USD billing and GBP budgets
- data latency, which delays anomaly detection
How do I turn a forecast into real cost action?
Embed the forecast into a continuous FinOps loop that lines up with quarterly finance cycles and shows costs in GBP (£). Give each main cost driver a clear owner, then map planned optimisation work, like rightsizing or Reserved Instances, as dated changes with a measurable target.
If spend drifts by more than 5% to 10%, set up automated alerts in tools like Slack or Jira and move fast. Then review progress on a regular basis with Finance, Engineering and Product so cloud spend stays on budget.