
Performance testing in CI/CD pipelines ensures your software can handle traffic spikes, heavy loads, and resource constraints without breaking. By automating these tests early in the development process, you can identify and fix issues before they impact users. This approach reduces production problems by up to 30% and protects your system from outages during peak usage.
Key Takeaways:
- Why it matters: Performance bottlenecks can lead to slow response times, high error rates, and system crashes.
- What to test: Run smoke, load, stress, and soak tests at different pipeline stages.
- How to automate: Use tools like k6, Locust, or JMeter to simulate traffic and block builds if performance metrics fail.
- Metrics to track: Focus on p95 response times, error rates, throughput, and resource usage.
- Best practices: Test early, use cloud-based environments, and regularly update thresholds.
Integrating performance testing into your CI/CD pipeline ensures your software is fast, reliable, and ready to meet user demands.
Why Performance Testing Matters in CI/CD
What is Performance Testing?
Performance testing is all about understanding how your system behaves when pushed to its limits. Unlike functional testing, which checks if features work as intended, performance testing focuses on how well your application handles stress. This includes measuring response times, throughput (how many requests it can process per second), and scalability - essentially, whether it can handle a growing user base without slowing down. By simulating real-world conditions like heavy traffic, sudden spikes in usage, or limited resources, performance testing helps identify bottlenecks before they impact users. Without it, these hidden issues could cause serious trouble in live environments.
Problems Without Performance Testing in CI/CD
Skipping performance testing in your CI/CD pipeline can lead to major headaches. Bottlenecks that go unnoticed during development often emerge at the worst possible time - like during peak usage. For example, a database query that runs in 5ms during testing might balloon to 800ms under heavy load [2]. Modern applications are also built on complex ecosystems, relying on third-party libraries, open-source components, and external APIs. Without regularly testing these dependencies, a single latency issue in one external service could cripple your entire system [3]. Aakash Yadav, QA Lead at Testriq QA Lab, puts it starkly:
If you are not testing your system's limits within automated pipelines, you are not just at risk of a bug; you are at risk of being shut out of the market entirely [3].
Benefits of Testing Early
The best way to avoid these risks is by testing early. Performance issues are easier - and cheaper - to fix when caught early in the development process. As LoadForge aptly points out:
Performance regressions are bugs, and like all bugs, they are cheapest to fix when caught early [2].
Need help optimizing your cloud costs?
Get expert advice on how to reduce your cloud expenses without sacrificing performance.
Planning Performance Testing for CI/CD Pipelines
Setting Test Goals and Metrics
Before diving into performance testing, it’s crucial to define what success looks like. Adopting a shift-left strategy can help you identify and fix performance regressions early, when they’re less costly to address [2]. Establish clear pass/fail criteria that can block builds if performance targets aren’t met, ensuring performance becomes a core quality checkpoint [2][6].
When setting metrics, focus on percentiles instead of averages. For instance, aiming for a p95 response time under 500 ms ensures that 95% of users experience acceptable performance, while a p99 response time between 1,000 and 2,000 ms helps manage extreme latency outliers [2]. Keeping error rates between 0.1% and 1.0% is another key metric to capture issues during periods of high usage [5]. Additionally, tracking throughput (requests per second) ensures the system can handle expected traffic volumes. Monitoring resource usage - like CPU, memory, and I/O wait times - can help pinpoint whether bottlenecks stem from code inefficiencies or infrastructure constraints [4].
Start with a performance baseline. Use the current system’s metrics to set initial thresholds, then tighten these limits incrementally as the application improves [2].
Selecting the Right Test Types
Each type of performance test serves a specific role in the CI/CD pipeline.
- Smoke tests are quick checks, running on every pull request. They typically involve 10–20 virtual users and last just 2–5 minutes, helping to catch glaring issues early [2][6].
- Load tests simulate peak traffic conditions and are better suited for nightly builds or staging environments. These tests usually run for 15–30 minutes to ensure response times and error rates remain within acceptable limits [2][7].
- Stress tests push the system beyond its expected capacity to expose breaking points. These are generally performed in pre-release stages or on a weekly schedule [2][7].
- Soak tests are designed to run over extended periods - ranging from hours to days - to detect issues like memory leaks or resource exhaustion. These are often used for weekly or quarterly evaluations [6][7].
Building Realistic Test Environments
To get meaningful results, your test environment should closely reflect production. Differences in database size, network conditions, or infrastructure can lead to misleading outcomes. A dedicated, isolated load testing environment is crucial to avoid interference from other testing activities [2].
Include a warm-up phase in your tests to allow JIT compilers and caches to initialise properly [2]. Using cloud-based resources can also be a game-changer. They allow you to create temporary environments that mimic production setups without requiring permanent infrastructure, maintaining accuracy while keeping expenses under control.
How to add performance testing to CI/CD pipelines using k6 and GitHub Actions
How to Integrate Performance Testing in CI/CD
::: @figure 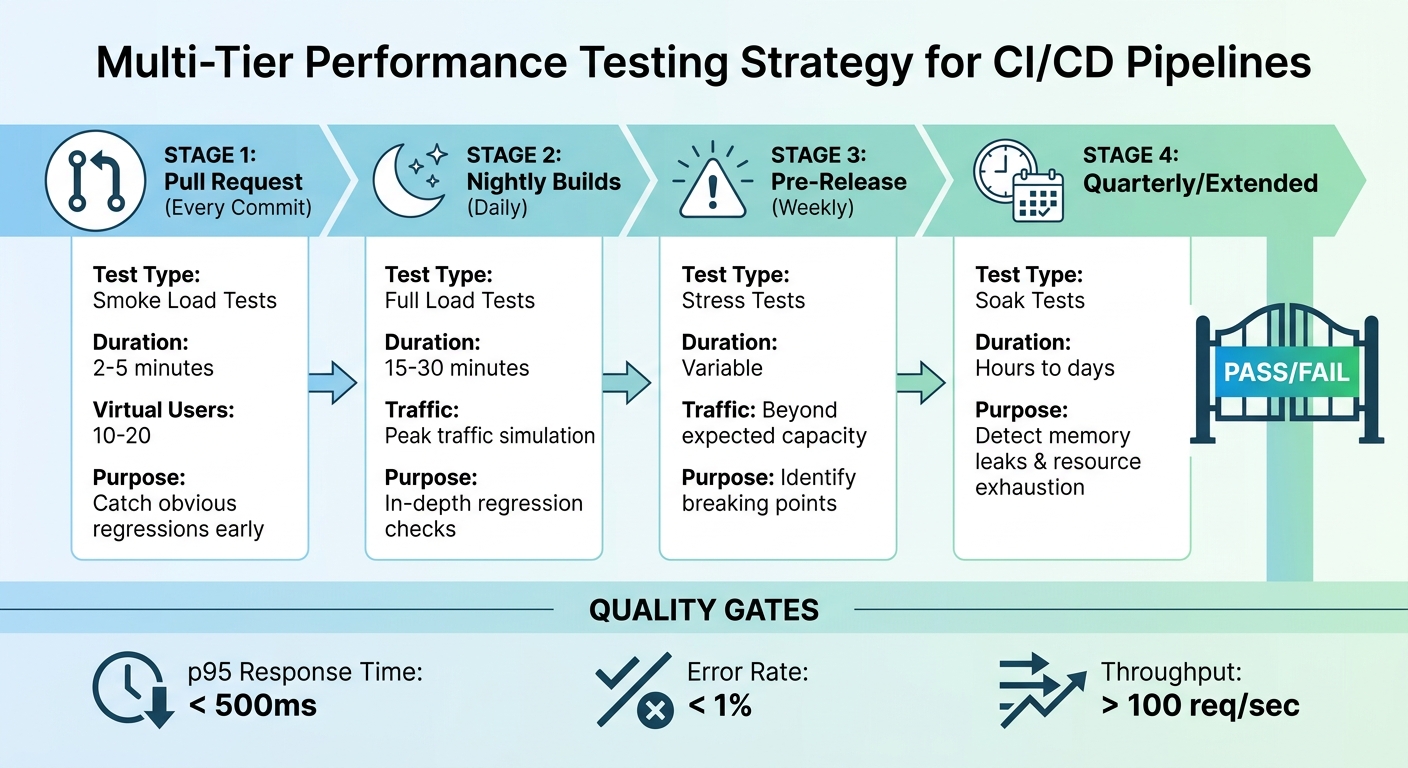 {Multi-Tier Performance Testing Strategy in CI/CD Pipelines}
:::
{Multi-Tier Performance Testing Strategy in CI/CD Pipelines}
:::
Writing Performance Test Scripts
When creating performance test scripts, the goal is to mimic how real users interact with your application. This means replicating genuine user behaviour and traffic patterns. The framework you choose should align with your team's expertise - k6 is great for JavaScript developers, Locust works well for Python teams, and JMeter is ideal if you prefer a GUI-based tool [2][6]. Focus on writing scripts that deliver consistent results and avoid relying on external factors that might vary during each run.
To simulate realistic traffic, use weighted tasks. For instance, if 70% of users browse product listings and only 10% complete a purchase, your script should reflect this distribution [2][6]. Avoid hardcoding sensitive data like URLs or credentials directly into your scripts. Instead, pass these through environment variables (e.g., BASE_URL or GITHUB_TOKEN) using your CI/CD tool's secrets management system [6][8]. This keeps your scripts adaptable and secure across different environments.
Once your scripts are reliable and secure, the next step is to integrate them into your pipeline for automated execution.
Automating Test Execution
Adopting a shift-left approach means catching performance issues as early as possible. Automating performance tests at various stages of your pipeline is a practical way to achieve this. A multi-tier testing strategy works best, with specific test types assigned to different pipeline stages. For example:
- Smoke load tests: Run on every pull request to detect obvious regressions early [2].
- Full load tests: Execute nightly on staging environments to provide in-depth regression checks [2].
- Stress tests: Conduct pre-release to push the system beyond expected traffic and identify breaking points [2].
Configure your CI/CD platform - whether it's Jenkins, GitHub Actions, or GitLab CI - to handle these tests automatically. Save the results as pipeline artefacts in formats like JSON, JUnit XML, or HTML, or upload them to external storage solutions such as S3 for long-term analysis [6][8]. To streamline developer workflows, you can even set up your scripts to post performance results as comments on pull requests, giving immediate feedback without disrupting their process [8].
Setting Quality Gates and Generating Reports
Automated testing generates valuable data that can be used to enforce quality gates - rules that prevent deployments if performance metrics fall below acceptable thresholds. For example, you might set thresholds like p95 response times under 500 ms, error rates below 1%, or throughput above 100 requests per second [2].
Start by establishing baseline thresholds based on your current performance metrics, then gradually tighten these as your application improves [2]. Allow for some margin - around 50% - to account for minor fluctuations and avoid flaky failures [2]. Reports should go beyond simple pass/fail results, highlighting performance trends over time. This helps teams spot subtle degradations before they escalate into major issues.
Best Practices for Performance Testing
Testing Early in Development
Identifying issues early can save time and reduce costs. Adopting a shift-left strategy allows you to run lightweight tests right after code changes. For instance, running smoke load tests on every pull request can quickly catch obvious regressions. This gives developers fast feedback without interrupting the workflow [2].
It’s all about striking a balance between speed and thoroughness. Developers need quick results, so save the more detailed tests for nightly builds. A layered testing strategy works well here. While lightweight tests keep the pipeline moving during the day, full load tests run overnight to provide a deeper analysis of potential regressions [2]. This way, you maintain a steady development pace without compromising on quality.
Using Cloud Resources for Scalability
Beyond early testing, scalability becomes crucial for replicating real-world scenarios. Cloud-based load generators are a game-changer here. Instead of investing in and maintaining dedicated hardware, you can spin up thousands of virtual users across multiple regions on demand. This setup more accurately mirrors real-world conditions, as your users are likely connecting from various locations - not just a single data centre. Tools like k6 or Locust in headless mode can integrate seamlessly into your CI/CD workflows, reducing overhead while maintaining efficiency [9].
This on-demand approach not only saves costs by avoiding idle infrastructure but also allows you to simulate traffic spikes that would be impossible to replicate with in-house hardware. By testing these extreme scenarios, you can identify breakpoints before they impact actual users.
Monitoring and Improving Tests Over Time
Integrating and maintaining performance tests is an ongoing process. Performance testing isn’t something you set up once and forget. Over time, user behaviour evolves, and your tests need to evolve with it. Using Application Performance Monitoring (APM) tools can provide valuable insights into real-world response times, error patterns, and resource usage. These insights should inform updates to your test scenarios.
It’s also important to regularly adjust thresholds to prevent unnoticed regressions [2]. For example, if optimisations reduce your p95 response time from 450ms to 320ms, you should lower your quality gate from 500ms to 400ms. This ensures that performance doesn’t gradually deteriorate back to previous levels. However, leave some breathing room - about 50% headroom is a good rule of thumb. For instance, if your baseline is 320ms, set your limit at 500ms to account for natural variations [2].
Conclusion
Adding performance testing to your CI/CD pipeline does more than just catch bugs - it protects your business from costly failures. As Gartner points out, Applications with performance issues lead to loss of revenue and brand damage, especially during peak usage times
[1]. Spotting bottlenecks early, when fixes are easier and cheaper, helps avoid last-minute production crises and expensive downtime.
The advantages go beyond cost savings. Automated quality gates help block poor-quality code, and cloud-based testing removes the need for dedicated hardware. RadView highlights that Integrating performance testing earlier in CI/CD pipelines can reduce production issues by up to 30%
[1]. This means fewer emergency fixes, less downtime, and smarter use of resources. Plus, by getting instant performance feedback, teams can make faster decisions and improve their development pace with confidence.
Making performance testing a continuous process is key. Regularly tracking real-world metrics, updating test scenarios to match user behaviour, and gradually tightening performance thresholds as your application grows ensures your software stays fast, dependable, and ready to handle user demands.
At Hokstad Consulting (https://hokstadconsulting.com), we specialise in helping businesses fine-tune their CI/CD pipelines to create scalable, high-performance digital solutions.
FAQs
Where should performance tests run in my CI/CD pipeline?
Performance tests should be conducted early and at critical points throughout your CI/CD pipeline to ensure systems perform reliably before deployment. Integrating these tests during the build, integration, and testing phases allows you to catch and resolve potential issues early. This approach helps prevent performance problems from making it to production while promoting ongoing improvements in quality.
How do I set reliable performance thresholds without flaky builds?
Automated performance testing plays a critical role in ensuring reliable builds and avoiding flaky results. By integrating this process early in your CI/CD pipeline, you can establish clear, measurable benchmarks for essential metrics like response times, error rates, and resource usage.
Consistency is key - using stable testing environments, such as containers, helps maintain uniformity across test runs. Additionally, monitoring key metrics during every test run allows you to identify issues promptly.
It's equally important to regularly review and adjust your performance thresholds. This ensures they align with actual performance expectations, reducing the chances of false positives or missed regressions.
How can I make load tests realistic without using production data?
To design load tests that feel authentic without using live production data, focus on emulating actual user behaviour and replicating real-world conditions. Use tools that can simulate how users interact with your system, including common usage patterns and peak traffic scenarios. Additionally, incorporate geographically distributed testing to mirror how users access your system from different locations. This approach ensures your tests provide a realistic representation of user activity, all without depending on production data.