
DORA metrics are a set of four data points used to assess software delivery performance. These metrics focus on speed and reliability and are widely adopted to improve development processes. Here's a quick summary:
- Deployment Frequency: How often code is deployed to production.
- Lead Time for Changes: Time from the first commit to production deployment.
- Change Failure Rate: Percentage of deployments causing issues.
- Time to Restore Service: Time taken to recover from failures.
Why should you care? Teams using DORA metrics can identify bottlenecks, improve delivery speed, and maintain system reliability. To get started, you'll need tools like Git-based version control, CI/CD pipelines, and incident tracking systems. Consistent definitions and automated data collection are key to accurate measurement.
The benchmarks for elite teams? Multiple daily deployments, under an hour for lead time and recovery, and failure rates below 15%. By focusing on one metric at a time and comparing against your own historical data, you can make steady improvements.
Measuring Software Delivery With DORA Metrics
Need help optimizing your cloud costs?
Get expert advice on how to reduce your cloud expenses without sacrificing performance.
Defining and Calculating DORA Metrics
::: @figure 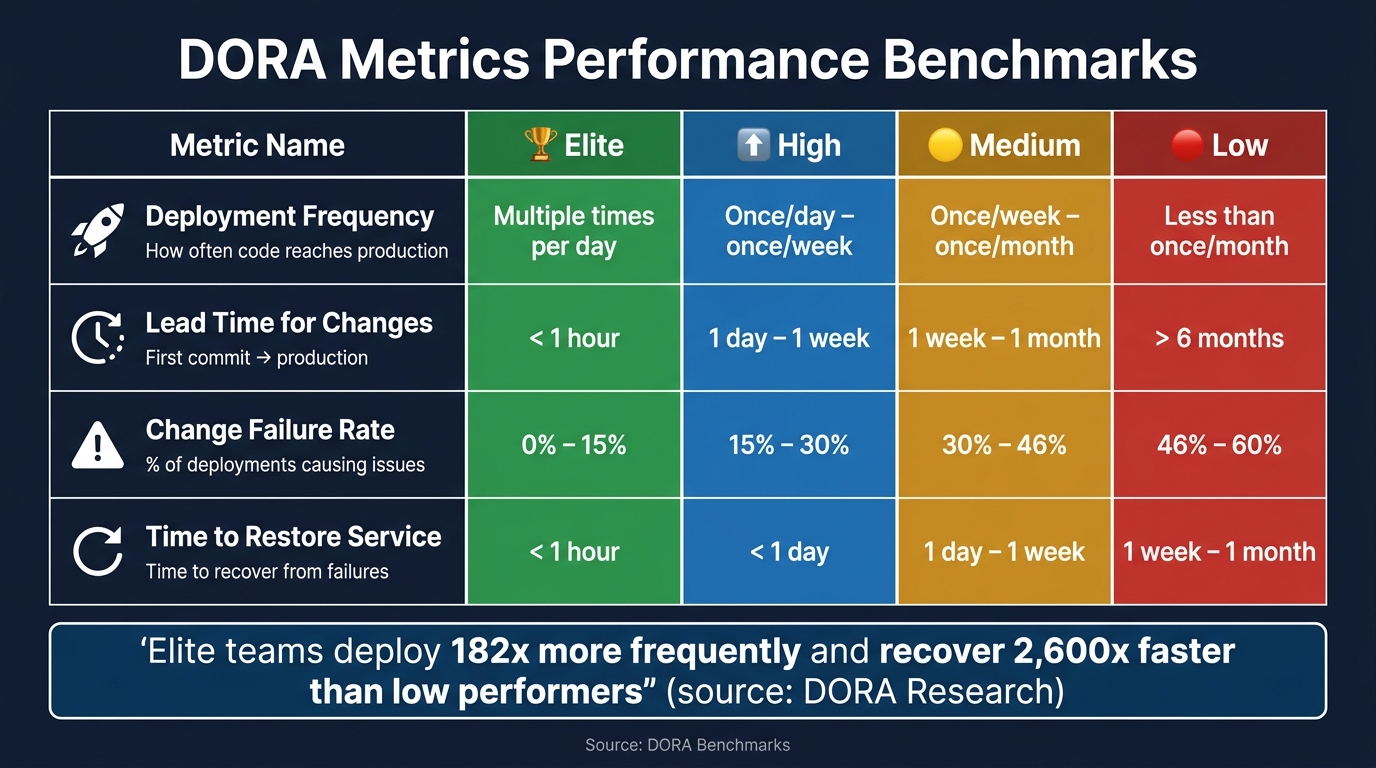 {DORA Metrics Performance Benchmarks: Elite vs Low Teams}
:::
{DORA Metrics Performance Benchmarks: Elite vs Low Teams}
:::
Let’s break down each of the DORA metrics and look at how they’re calculated. These metrics provide a clear picture of your team’s performance and help identify areas for improvement.
Deployment Frequency
Deployment Frequency tells you how often your team delivers code to production. To calculate it, count the number of production deployments over a 28- or 30-day period, then divide that by the number of days. This gives you the daily deployment rate.
Make sure to deduplicate deployments by commit SHA to avoid counting reruns as separate deployments [8]. For mobile teams, consider the final internal distribution step (like a TestFlight submission) as the production deployment point, rather than the App Store release. This avoids delays caused by external factors [2].
Lead Time for Changes
Lead Time for Changes measures how long it takes for code to move from the first commit on a feature branch to being live in production. The best starting point is the first commit on the feature branch, as using the merge timestamp can hide time spent on code reviews and pre-merge activities [8].
When reporting this metric, it’s better to use the median (p50) or 90th percentile (p90) rather than the average. A single delayed deployment can skew the average and make your team seem slower than it actually is [5][8].
Change Failure Rate
Change Failure Rate (CFR) calculates the percentage of deployments that require fixes or rollbacks. Use this formula:
CFR = (Failed Deployments ÷ Total Deployments) × 100
The challenge lies in defining a failure.
A reliable definition includes three signals: explicit rollbacks, hotfixes deployed within 24 hours of a release, and incidents tied to a specific deployment SHA [8][4]. Relying on just one of these signals can undercount failures, leading to overly optimistic results.
Time to Restore Service
Time to Restore Service (TTRS) tracks how quickly your team recovers from production issues. To calculate it, you need two timestamps: when the incident was detected (or the alert was triggered) and when it was resolved. These timestamps usually come from tools like PagerDuty or Jira Service Management, rather than your CI/CD pipeline [8][4].
As with Lead Time for Changes, report the median recovery time, as a single long outage can distort the mean [5].
The table below provides benchmarks for these metrics, helping you evaluate your team’s performance:
| Metric | Elite | High | Medium | Low |
|---|---|---|---|---|
| Deployment Frequency | On-demand (multiple/day) | Once/day – once/week | Once/week – once/month | Less than once/month |
| Lead Time for Changes | < 1 hour | 1 day – 1 week | 1 week – 1 month | > 6 months |
| Change Failure Rate | 0%–15% | 15%–30% | 30%–46% | 46%–60% |
| Time to Restore Service | < 1 hour | < 1 day | 1 day – 1 week | 1 week – 1 month |
Source: DORA Benchmarks [[5]](https://www.manageengine.com/products/applicationsmanager/blog/measure-and-improve-devops-performance-with-dora-metrics.html)_
Setting Up Tools and Data Flows for DORA Metrics
Mapping Your DevOps Toolchain
Once you’ve defined your metrics, the next step is to map your toolchain to gather the data you need. Start by identifying where your data is stored. Typically, your SCM (Source Control Management), CI/CD pipeline, and incident management tools will serve as the main sources for DORA metrics.
| Metric | Primary Data Source | Key Linking Identifier |
|---|---|---|
| Deployment Frequency | CI/CD Pipeline / Git Tags | Deployment ID / Environment Tag |
| Lead Time for Changes | SCM (GitHub/GitLab) + CI/CD | Commit SHA / PR ID |
| Change Failure Rate | Incident Tool + Deployment Log | Deploy ID / SHA |
| Time to Restore Service | Incident Management (PagerDuty) | Incident ID / Resolution Timestamp |
A common mistake is failing to standardise what production
or deployment
means before collecting data. For example, does deployment refer to a successful merge into the main branch, a tagged release, or the push of a container image? Choose a single definition and apply it consistently across all teams and services [4][9].
Creating a Normalised Data Model
Once you’ve located your data, the next step is to connect it. A simple three-table schema works well as a starting point:
| Table | Key Fields | Purpose |
|---|---|---|
| Deploys |
id, service, sha, deployed_at, is_failed
|
Tracks deployment success |
| Commits |
commit_sha, author_timestamp, deploy_id
|
Links code changes to releases to measure Lead Time |
| Incidents |
incident_id, detected_at, resolved_at, deploy_id
|
Captures incidents for assessing stability and recovery |
To correctly link incidents to deployments, you’ll need to implement a time-based attribution window, typically between 24 and 72 hours, as described in the metric definitions [7].
Automating Data Collection
With your data model in place, automation is essential to ensure accuracy and scalability. Manual collection is prone to errors, so rely on automated methods, like webhooks, to capture events in real time. For instance, configure your SCM to trigger events when deployments are completed or pull requests are merged. Similarly, set up your incident management tool to log events as they happen.
If you’re using GitHub Actions, keep in mind that deployment data stored in workflow artefacts is temporary. To preserve historical data for trend analysis, push this information to an external storage solution, such as a PostgreSQL table or an S3 bucket, as part of your pipeline. Additionally, make sure your automation processes exclude non-production events to maintain data relevance.
To get started quickly, focus on Git data first. Automating metrics like Deployment Frequency and Lead Time for Changes provides immediate insights without requiring extensive integrations [1].
Using DORA Metrics to Improve Performance
Setting Baselines and Targets
Before diving into improvements, it's essential to establish a clear starting point. Gather at least 4–6 weeks of historical data - up to three months is even better - to account for short-term fluctuations and reflect your team's regular workflow [1][2].
When calculating your baseline, use median values, not averages. Why? A single major incident or delayed deployment can skew averages, but the median offers a more accurate picture of your team's typical performance [3].
Once you've set your baseline, focus on improving one metric per quarter. Aim to move up one DORA performance tier (e.g., from Medium to High) instead of trying to jump straight to elite status. A realistic goal is improving by 20–40% over a 6- to 8-week period [3].
Here are the benchmarks elite teams strive for:
| Metric | Elite Benchmark | What It Looks Like in Practice |
|---|---|---|
| Deployment Frequency | Multiple times per day | 16.2% of elite teams achieve continuous, on-demand releases [2] |
| Lead Time for Changes | Under one hour | 24.4% of elite teams deliver changes in less than a day [2] |
| Change Failure Rate | 0–5% | Stable pipelines with strong automated test coverage [10] |
| Time to Restore Service | Under one hour | 56.5% of elite teams restore service within a day [2] |
The most meaningful comparison is against your own historical data. Teams working with older monolithic systems shouldn't be held to the same standards as those using greenfield microservices. By setting a personalised baseline, you can find the right balance between speed and reliability for your specific environment.
Balancing Speed and Reliability
Once you've established your baselines, the goal is to improve speed without sacrificing reliability. There's a common misconception that you must choose between the two, but successful teams consistently achieve both.
Speed and stability are not trade-offs. The best teams are both fast and safe.- PanDev Metrics [10]
Elite teams deploy about 182 times more frequently than low performers and recover from failures 2,600 times faster [6]. The trick is to treat speed and stability as interconnected, not opposing, goals.
For example, if your Deployment Frequency improves but your Change Failure Rate rises, you're not making real progress - you’re just delivering bugs faster. To address this, consider techniques like automated test gates or canary deployments to maintain quality [2].
It's also worth paying attention to the Deployment Rework Rate, a newer metric introduced in 2024. This measures unplanned follow-up deployments. Sometimes a low Change Failure Rate hides frequent reactive patches, and tracking rework can help uncover these issues [12][13].
Driving Continuous Improvement
Once your baselines are stable and speed-reliability balance is achieved, it's time to dig deeper into your processes. Break down Lead Time into four actionable stages to identify bottlenecks:
- Coding: From the first commit to pull request (PR) creation
- Pickup: From PR creation to the first review
- Review: From the first review to merge
- Deploy: From merge to production
Each stage highlights specific inefficiencies:
| Lead Time Stage | Common Bottleneck | Practical Fix |
|---|---|---|
| Coding | Tasks are too large | Break work into smaller, more manageable units |
| Pickup | PRs sit unreviewed | Set team SLAs, e.g., review within 4 hours [3] |
| Review | Unclear standards or back-and-forth | Define clear review criteria |
| Deploy | Slow CI/CD or manual approvals | Automate pipelines and remove unnecessary gates |
When analysing Lead Time, look at the 90th percentile in addition to the median. The median reflects typical performance, but the 90th percentile can reveal long delays that may point to systemic issues [4].
For Time to Restore Service, formalising incident classification can cut MTTR by 40–60% by improving triage and handoffs [2]. For instance, in April 2026, Maksim Popov, CTO of ABR Tech, aligned DORA metrics with data from developer IDEs. This approach led to a 30% boost in team productivity and a 25% improvement in release quality. It gave tech leads visibility into process issues without making developers feel micromanaged [3].
To keep progress on track, integrate lightweight reviews into existing team rituals. A 15-minute weekly check-in during retrospectives and a 30-minute monthly deep dive for leadership reports can ensure discussions remain data-driven. Use 90-day rolling averages rather than weekly snapshots to focus on long-term trends instead of short-term noise [3][11].
Conclusion
DORA metrics offer valuable insights into your software delivery process, helping teams make steady, data-informed improvements.
To build on the setup outlined earlier, focus on a few key practices: identify your data sources, agree on clear definitions, automate data collection, use median values to minimise the impact of outliers, and establish baselines using historical data.
However, the technical setup is only part of the equation. The mindset around these metrics is equally important. When used correctly, DORA metrics serve as a tool for refining processes, not for evaluating individual performance. Research consistently shows that organisations applying these metrics with discipline are 1.8 times more likely to achieve better business outcomes [2].
DORA metrics are your starting point, but comprehensive measurement is your path to sustainable high performance.- DX [14]
If you're aiming to go further - whether that's cutting cloud costs linked to inefficient deployments, improving your CI/CD pipelines, or driving a larger DevOps transformation - Hokstad Consulting partners with engineering teams to convert these metrics into measurable operational gains.
By focusing on these strategies, you can ensure your DORA measurement approach remains practical and effective.
Key Takeaways
The power of DORA metrics lies in four main areas: what to measure, how to measure it accurately, how to set achievable targets, and how to act on the data. Deployment Frequency and Lead Time for Changes reveal the speed of your team, while Change Failure Rate and Time to Restore Service indicate reliability. Together, they provide a balanced picture of delivery performance.
For accurate results, rely on automated data collection integrated with your SCM, CI/CD, and incident management tools. Consistent definitions across teams ensure the data remains reliable and comparable. Improvements come step by step - tackling one metric at a time, always benchmarking against your own historical data rather than generic industry averages [2][3].
FAQs
What counts as a production deployment for DORA metrics?
A production deployment in the context of DORA metrics means releasing code into a live production environment where it directly affects end users or customers. This specifically refers to code that is actively running in production, excluding staging or testing environments.
Different teams might have varied definitions of what constitutes production
- some may consider it a live environment accessible to all users, while others might include internal releases that impact specific user groups. However, maintaining a consistent definition is crucial for tracking deployment frequency and related metrics accurately.
How do I reliably link commits, deployments, and incidents?
To connect commits, deployments, and incidents effectively for tracking DORA metrics, automation is key. Use shared identifiers like commit SHAs or build numbers to create links between these elements. Make sure to:
- Capture detailed commit data.
- Log deployment events systematically.
- Correlate incidents to their relevant deployments.
Leverage tools or custom scripts to query APIs, ensuring timestamps align across systems. This approach minimises errors and helps maintain precise tracking throughout the process.
What should I do first if my DORA metrics look bad?
If your DORA metrics aren't looking great, don't panic - this happens more often than you'd think. The first step is to set a baseline to understand where you currently stand. From there, pinpoint the metric that needs the most attention. Whether it's sluggish deployment speeds or a high failure rate, focus on tackling the biggest bottlenecks first. Set clear, realistic goals and track your progress consistently. The key here is to aim for steady, continuous improvement rather than expecting overnight success.