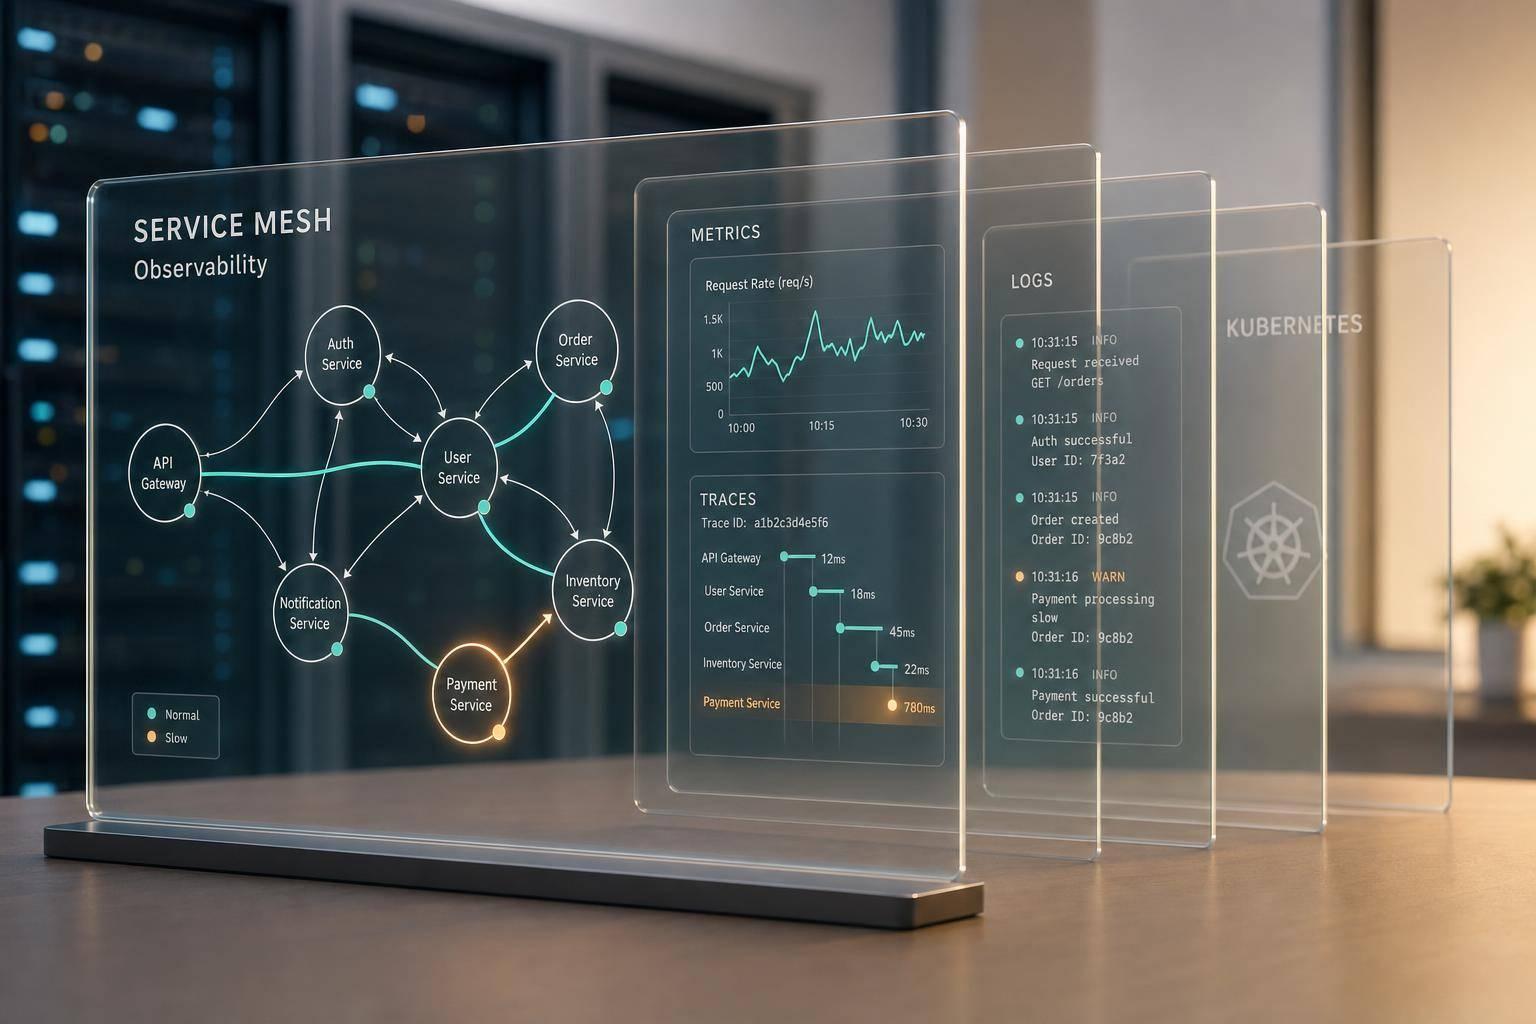
A service mesh helps me see what Kubernetes misses: the traffic between services. That means I can track request rate, latency, errors, traces across hops, and per-request logs without changing app code in most cases. And that matters, because 82% of DevOps teams say network visibility is their main challenge in Kubernetes, while 67% say older monitoring setups see less than 40% of the traffic that matters.
If I wanted to sum up the whole article in a few lines, it would be this:
- Kubernetes shows pod and node health, not the full request path
- A service mesh adds sidecar proxies that produce metrics, traces, and access logs
- Metrics help me spot issues first
- Traces show which service hop is slow or failing
- Logs confirm the exact request, error, timeout, or routing problem
- For full end-to-end traces, apps still need to pass trace headers
- Before I start, I need a healthy mesh, sidecar injection, Prometheus, Grafana, log storage, and a tracing backend
- I should troubleshoot in this order: metrics → traces → logs
In short: if I want to cut guesswork during incidents, a service mesh gives me a much clearer view of service-to-service traffic.
A few points stand out straight away:
- Sidecars usually add around 100–300m CPU and 100–300 MiB memory per pod
- Tracing backends can include Jaeger, Tempo, or Zipkin
- Common Envoy response flags such as NR, UH, UF, UO, and UT help me sort routing, health, connection, overflow, and timeout issues
- Metrics are good for alerts, but logs often appear sooner during a live incident
- Traces are often sampled, so they show part of the picture rather than every request
This article is, at heart, a simple guide to turning those signals on and using them together so I can go from “something is slow” to “this hop timed out” with less trial and error.
2. What you need before you start
Before you switch on observability features, get the basics sorted first.
Cluster and mesh prerequisites
Use a Kubernetes cluster running 1.24 or later. You’ll also need enough spare capacity for sidecar proxies to run next to your workloads. Each sidecar adds about 100–300m CPU and 100–300Mi memory per pod, so plan for that up front, especially if your nodes are already running hot.
Your control plane needs to be healthy, and your data plane needs to be active. In an Istio setup, that means istiod is running, the CRDs are installed, and automatic sidecar injection is turned on for the namespaces you want to observe. In most cases, that’s done by applying the label istio-injection=enabled.
Don’t just assume it’s working. Check that new pods in those namespaces are actually getting sidecars. If traffic isn’t passing through the mesh, you won’t see proxy-level metrics or logs.
Platform engineers need RBAC permissions to manage mesh CRDs, telemetry settings, and exporter Secrets. Developers need read access to metrics, logs, and tracing views.
Telemetry and tracing prerequisites
Once the mesh is healthy, switch on the observability signals in this order.
Prometheus scrapes Envoy’s /metrics endpoint, and access logs come straight from the proxy, so you don’t need app changes for either. Before you go any further, make sure Prometheus, Grafana, and a log backend such as Loki or Elasticsearch are already running and reachable from inside the cluster.
Proxies can emit spans at each hop. But if you want full traces, every outbound call needs trace-context propagation. That’s what makes one request show up end to end across services. Use W3C Trace Context (traceparent and tracestate) or B3 headers (x-b3-traceid), and set a tracing backend such as Jaeger, Tempo, or Zipkin as the mesh exporter.
| Component | What it enables | App change needed? |
|---|---|---|
| Sidecar proxies | Metrics, access logs, proxy-level spans | No |
| Prometheus + Grafana | Metrics collection and visualisation | No |
| Log backend (Loki/Elasticsearch) | Centralised access log storage | No |
| Jaeger / Tempo / Zipkin | Trace storage and visualisation | No |
| Trace header propagation | Full end-to-end distributed traces | Yes |
With the cluster, backends, and trace headers in place, you can switch on metrics, traces, and logs.
3. Enable and verify the core observability signals
With the mesh and backends in place, start with metrics, then tracing, then access logs. That order keeps things simple. You first confirm traffic is showing up, then trace how requests move between services, and only then dig into single-request detail.
Enable metrics for request rate, latency and errors
Istio sidecars emit HTTP and TCP metrics by default. You can use those metrics to track traffic, latency, errors and saturation without changing your application code. That gives you a view of service health, not just pod health.
Once traffic is live, check Prometheus for the main request metrics. A rate(...) query over the request counter shows request volume per service. For latency, check histogram quantiles such as P50, P95 and P99 across your key services. For errors, filter by response code. For example, rate(...{response_code=~"5.."}[5m]) shows 5xx traffic. If you use Grafana, make sure each critical service shows non-zero traffic and a latency spread over a recent window, such as the last 15 minutes.
A simple sanity check helps here. Run a known load against a service - even a basic curl loop from a pod - and watch the request rate climb on the dashboard. If the graphs stay flat, check whether sidecar injection is enabled for the namespace and confirm the pods are running with the proxy container.
Once the metrics look right, move to tracing.
Configure distributed tracing across services
Tracing shows where a request slowed down as it moved across service boundaries. Point the mesh at your tracing backend and enable span export. The mesh sidecars generate spans at each proxy boundary, so you get ingress gateway spans and per-service proxy spans without changing application code.
One thing can trip you up: trace-context propagation. If that’s missing, the spans appear, but they don’t connect. The clearest sign is a set of short, single-span traces for downstream services with no parent-child link back to the upstream caller.
After you can see end-to-end spans, switch on access logs.
Turn on access logs to inspect individual requests
Use logs to inspect the exact requests behind a spike in errors or latency. Access logs give you the most detailed signal. Each entry covers one request and includes the source service, destination service, response code, duration in milliseconds, protocol, method and path.
Enable structured access logs and ship them into your log pipeline. Once they’re flowing, you can filter by response_code >= 500 during the incident window or search for requests with durations above 2,000 ms to find slow calls. If your application writes the trace ID into log fields, you can correlate straight from a failing log entry to the full trace in your tracing UI.
Envoy response flags also help you sort failures fast.
| Response flag | Meaning | Common cause |
|---|---|---|
| NR | No route | Host mismatch in VirtualService or missing route |
| UH | No healthy upstream | Target service pods failing health checks |
| UF | Upstream failure | Connection refused or reset by the destination |
| UO | Upstream overflow | Circuit breaker triggered due to connection limits |
| UT | Upstream timeout | Request exceeded the configured timeout |
4. Use metrics, traces and logs together to troubleshoot
::: @figure 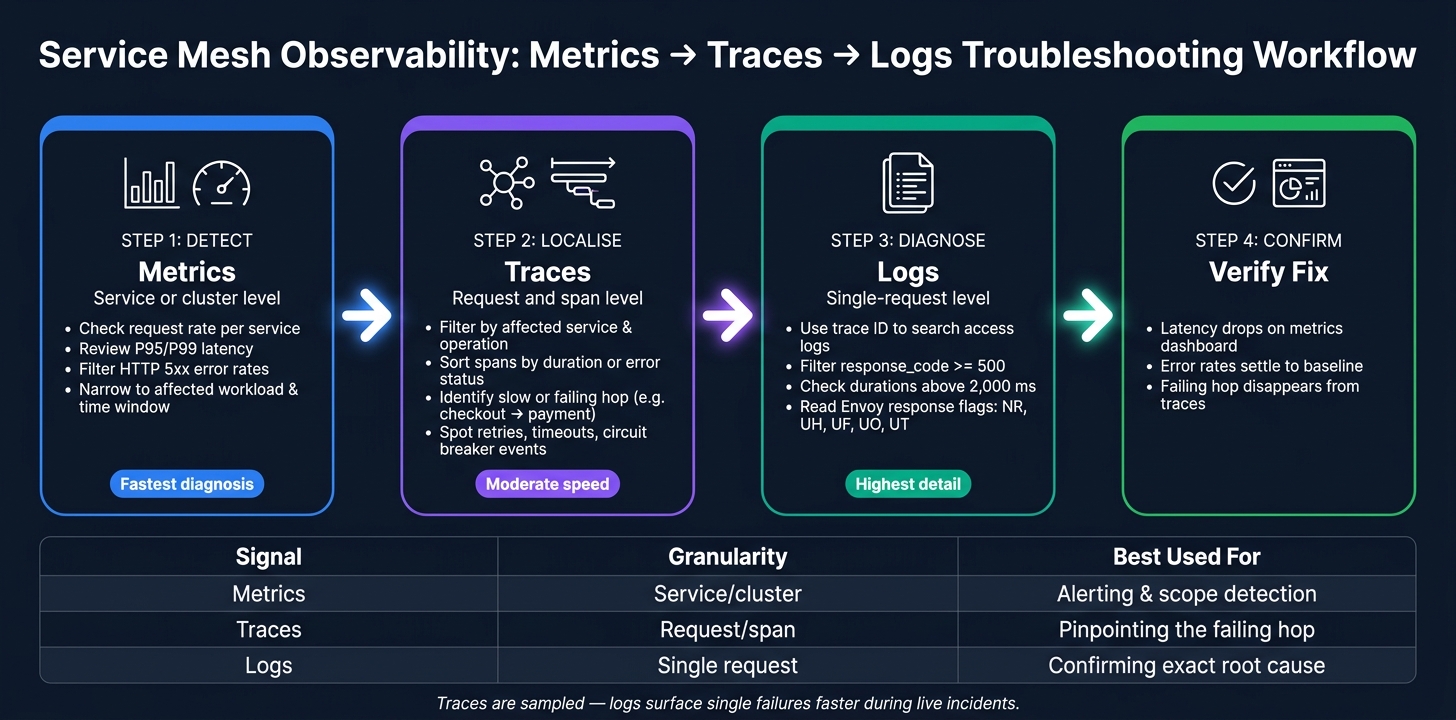 {Service Mesh Observability: Metrics → Traces → Logs Troubleshooting Workflow}
:::
{Service Mesh Observability: Metrics → Traces → Logs Troubleshooting Workflow}
:::
Use the signals in order: metrics to spot the issue, traces to find where it sits, and logs to confirm the cause. That split makes incident work much less messy. You go from alert to root cause with a lot less guesswork.
A simple workflow for finding latency and error issues
Start with your metrics dashboard. Check request rate, P95/P99 latency, and HTTP error rates for each service and route. When one of those moves, narrow it down to the affected workload, route, and time window. That gives you the scope of the problem and when it began.
Once you know the service and route, switch to traces. Filter for that service and operation, then sort by duration or error status. Read the span timeline to see which hop is slow or failing. In a service mesh, sidecar spans can show retries, timeouts, and circuit breaker events, so the weak link often stands out fast - for example, checkout → payment.
When you know the failing hop, go to logs. Use the trace ID to search mesh access logs and application logs in the same time window. Then check status codes, response time, and response flags. That’s usually where the exact cause shows up.
After the fix, go back and check metrics and traces again. You want to see latency drop, error rates settle, and the failing hop disappear.
When to use each signal first
Use this rule of thumb during incidents:
| Signal | Purpose | Granularity | Speed of diagnosis | Troubleshooting value |
|---|---|---|---|---|
| Metrics | Detection and alerting | Service or cluster level | Fastest | Detects impact and scope |
| Traces | Localisation and path analysis | Request and span level | Moderate | Shows the failing hop |
| Logs | Root cause diagnosis | Single-request level | Slower - high volume | Shows the exact failure |
One practical note: metrics usually refresh every minute, while logs are often pushed every ten seconds or so.[3][1] In a fast-moving incident, that gap matters. If you need the newest signal, logs will show single failures sooner than a metrics graph catches up. Traces are a bit different. They’re often sampled by default, so you’re looking at a sample set, not a full record of every request.[1][2]
5. Conclusion: What service mesh observability gives you in practice
Once you turn on the three signals, the payoff shows up straight away. A service mesh gives you a clear view of service-to-service traffic, measured the same way across teams and languages, without leaning on patchy logs or noisy cluster events.
Put together, these three signals help close the gap between an alert and the actual root cause. In practice, teams use them in sequence: metrics to spot the issue, traces to pinpoint where it sits, and logs to verify what happened. That cuts down the time from symptom to cause and trims the effort spent on root cause analysis.
It also goes beyond troubleshooting. The same telemetry helps with day-to-day decisions, like tuning autoscaling thresholds, spotting overprovisioned services, and setting SLOs that mean something. The result is faster diagnosis, clearer ownership, and more reliable services.
FAQs
Do I need to change my application code?
No. You don’t need to change your application code.
A service mesh handles observability at the infrastructure level. It collects metrics, logs and distributed traces through proxies that sit between your services and intercept service-to-service traffic.
That means you get automatic visibility into how your application’s services talk to each other, without rewriting the app itself.
How much overhead do sidecars add?
Sidecars come with a cost. They use extra CPU and memory, and they can add a bit of delay to each request. In older sidecar setups, that delay can climb to about 8 ms per request.
How much they use depends on the setup. For example:
- Some proxy configurations use around 0.20 vCPU and 60 MB of memory per 1,000 requests
- Newer modes can cut that to about 0.06 vCPU and 12 MB per 1,000 requests
That gap matters. On a busy system, even small savings in CPU, memory, and latency can add up fast.
What should I check if traces do not link up?
The most common cause is failed context propagation. In plain terms, one service isn’t passing the right request context headers to the next one.
Check that your applications forward the required headers between services, including trace identifiers. If those headers go missing, sidecar proxies can’t keep the spans linked together, which leaves you with a broken or partial trace.
It’s also worth checking your CI/CD pipeline. Make sure it sets up tracing headers and collectors the right way, and confirm that the sampling rate is high enough to catch the traffic you’re looking into.