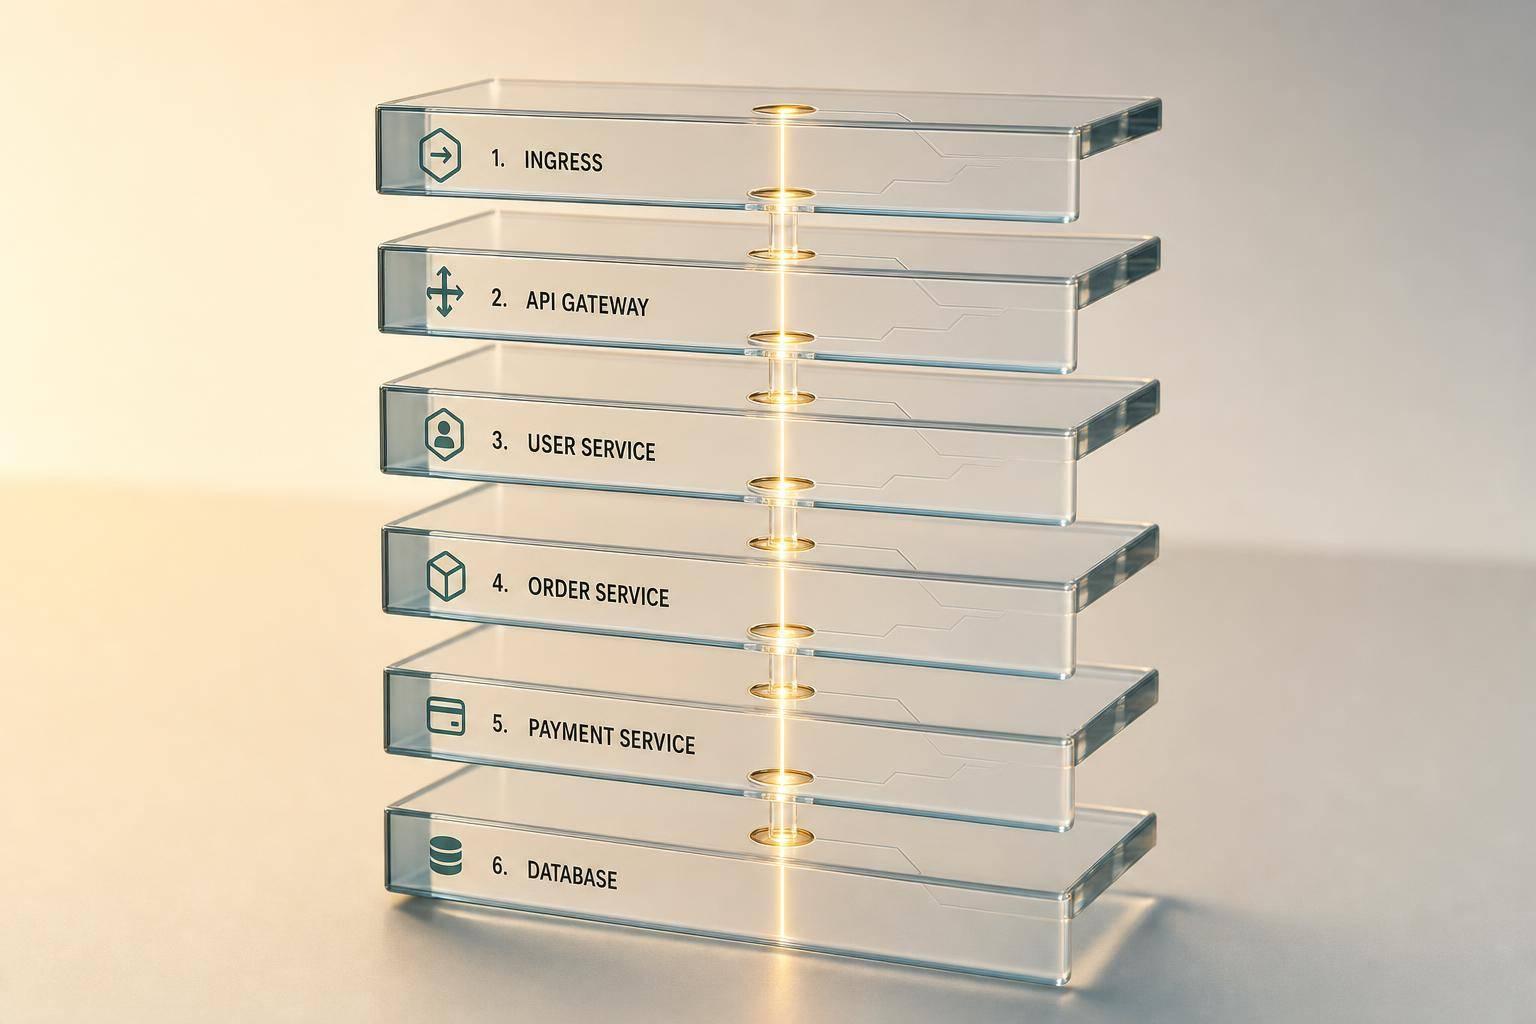
If one request crosses ingress, APIs, jobs, databases, queues, and even clusters, tracing is how I see where the delay starts. This article boils Kubernetes tracing down to 6 common paths and one core rule: if trace context breaks at any hop, the whole view becomes patchy.
Here’s the short version:
- I need OpenTelemetry to send spans from apps, proxies, and workers to a backend such as Jaeger, Zipkin, or Tempo
- I need W3C Trace Context (
traceparent,tracestate) to stay in place across HTTP, jobs, and messages - I need stable names and span fields like
service.name,http.route,db.system,messaging.system, andk8s.cluster.name - I need to watch 6 tracing cases:
- Ingress with Istio for edge delay and retries
- Service-to-service HTTP for timeout chains, N+1 calls, and slow downstream hops
- Background jobs and CronJobs for queue delay, retries, and lost spans on exit
- Database calls for slow queries, pool issues, and N+1 patterns
- Queues and events for publish/consume links, lag, retries, and dead-letter flows
- Cross-cluster tracing for region hops, tenant-level faults, and collector pressure
- I also need a Collector setup that fits the workload: DaemonSet, gateway, or sidecar
- And I need to avoid common break points, like:
- stripped
traceparentheaders - mesh sidecar injection issues
- short-lived Jobs exiting before spans flush
- head sampling dropping the traces I need most
- stripped
What matters most? In most cases, the slow part is not where the request starts. An ingress span might take 40 ms, while a child payment span takes 1.8 seconds because of retries. A queue-backed order flow might return in seconds, but confirmation can still sit for 20+ minutes if partitions run hot.
::: @figure 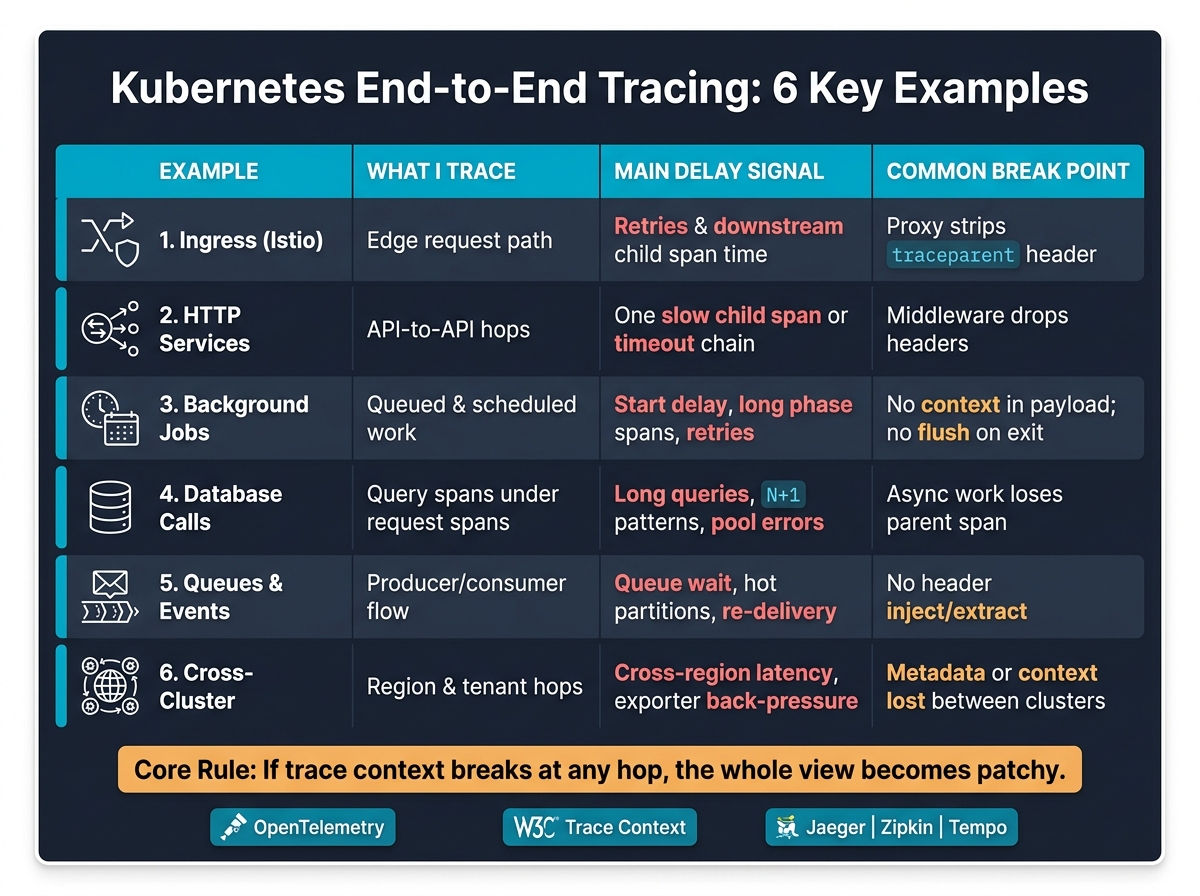 {Kubernetes End-to-End Tracing: 6 Examples at a Glance}
:::
{Kubernetes End-to-End Tracing: 6 Examples at a Glance}
:::
Tutorial: Exploring the Power of Distributed Tracing with OpenTelemetry on Kubernetes
Quick comparison
| Example | What I trace | Main delay signal | Common break point |
|---|---|---|---|
| Ingress | Edge request path | retries and downstream child span time | proxy strips traceparent
|
| HTTP services | API-to-API hops | one slow child span or timeout chain | middleware drops headers |
| Jobs | queued and scheduled work | start delay, long phase spans, retries | no context in payload, no flush on exit |
| Database | query spans under request spans | long queries, many small queries, pool errors | async work loses parent span |
| Queues | producer/consumer flow | queue wait, hot partitions, re-delivery | no header inject/extract |
| Cross-cluster | region and tenant hops | cross-region latency, exporter back-pressure | metadata or context lost between clusters |
If I keep context, naming, and collector routing tidy, traces stop being just a debug tool. They help me find the slow hop, trim retry waste, and tie delay back to spend in £ as well as milliseconds.
What You Need Before You Start Tracing in Kubernetes
These four basics keep spans linked across ingress, services, queues and jobs. Skip them, and one request can split into multiple traces. When that happens, delay points across ingress, HTTP calls, batch jobs and async messaging are much harder to pin down.
Trace Context Propagation Across Services and Jobs
Every hop in a request path needs to keep the same trace IDs. The standard way to do that is W3C Trace Context, via the traceparent and tracestate headers.
That means ingress controllers, HTTP middleware, queue producers and queue consumers all need to do two things:
- extract incoming context
- inject it into outgoing requests or messages
Most OpenTelemetry SDKs do this for HTTP and gRPC out of the box. Queues are different. They usually need explicit context propagation.
For background jobs started by HTTP requests, pass the parent trace context in the job payload. The producer has to write it, and the consumer has to extract it. If that hand-off is missed, the trace breaks right there.
Service Naming and Span Attribute Standards
Traces are much easier to read when service names stay stable and low-cardinality. So use names like payments-api, orders-worker or ingress-gateway instead of a pod hash.
It also helps to keep a small set of query-friendly attributes that tell you where latency shows up. Common ones include service.name, service.namespace, deployment.environment, k8s.cluster.name, k8s.namespace.name, http.route, db.system, messaging.system and messaging.destination.name.
Span names matter too. Name spans after business operations, such as CheckoutService.AuthorisePayment, instead of something vague like http.post. During an incident, that saves time because you can see what the system was trying to do, not just which protocol it used.
OpenTelemetry Collector Deployment Options
The best Collector pattern depends on traffic volume, day-to-day ops load and tenancy boundaries.
A DaemonSet runs one Collector pod per node. It fits node-level telemetry collection and cuts down duplicate config across lots of pods.
A gateway Deployment centralises ingestion. This works well for multi-cluster setups, tail-based sampling, data masking and routing to more than one backend.
A sidecar gives per-pod isolation. That makes it handy for short-lived batch jobs or workloads with special routing needs. The downside is simple: every pod pays the resource cost.
Some teams combine DaemonSet agents with a central gateway. Sidecars are best kept for workloads that need per-pod isolation.
| Pattern | Best Fit | Key Trade-off |
|---|---|---|
| DaemonSet | Node-level telemetry, general workloads | Node failure affects all pods on that node |
| Gateway Deployment | Multi-cluster, sampling, routing | Adds a network hop; needs separate scaling |
| Sidecar | Batch jobs, per-tenant isolation | Higher resource overhead across all pods |
That Collector path shapes how trace data gets to the backend and how much it costs to process.
Backend Options for Viewing Traces
The right backend comes down to how your team searches, stores and views trace data.
Choose by workflow. Jaeger is useful for trace search and dependency views. Zipkin suits lightweight deployments. Tempo fits Grafana-led teams that want lower-cost trace storage. If your team already lives in Grafana dashboards, Tempo plugs in directly and supports TraceQL for query and visualisation.
Common Setup Problems That Break Traces
A few setup issues trip teams up again and again.
- Missing
traceparentheaders - often stripped by a legacy proxy or load balancer between services. - Istio sidecar injection failures - if a namespace is missing the needed injection label, or the
istio-validatorwebhook can't be reached, pods run outside the mesh and traces end up incomplete. - Exporter flushing for short-lived Jobs - if the process exits before buffered spans are sent, trace data is lost. Set a short export interval or call a graceful shutdown hook before exit.
- Overly aggressive head-based sampling - this can quietly discard the spans you most need during an incident. Tail-based sampling, which keeps 100% of traces that end in errors or go past a latency threshold, is a safer choice for high-value request paths.
With these basics in place, the six examples below show how traces surface delay points in ingress, HTTP calls, jobs, databases and queues.
1. Ingress and Edge Routing Tracing with Istio and OpenTelemetry
This first example starts at the cluster edge, where ingress latency and retries often hide the actual bottleneck. At this point, Istio creates the root span, and downstream services add child spans under the same trace ID. So if the edge span is short but a downstream span is long, ingress usually isn't the problem.
Wire Istio to your OpenTelemetry Collector through mesh telemetry settings, and make sure traceparent moves across every hop. If that link is missing, child spans break away from the root span and the end-to-end view falls apart.
Watch three things in particular:
- ingress latency
- downstream span time
- retries
That same pattern shows up again in later examples: the slow span often isn't where the request started.
A UK retail platform traced intermittent slow checkouts. The ingress span for POST /checkout was only 40 ms, but the payments-service child span kept showing about 1.8 seconds. Span attributes showed istio.retry_attempt firing three times against an external payments provider, with each attempt hitting a 600 ms timeout. After the team adjusted the VirtualService retry policy, payments-service spans dropped to about 700 ms and overall checkout latency fell to under one second. [10][12][13][14]
The edge failure that shows up most often is a legacy proxy stripping traceparent before traffic reaches Istio. A synthetic trace check in CI can catch that early. From here, the same trace pattern carries into service-to-service calls.
2. HTTP Microservice-to-Microservice Tracing with Jaeger and OpenTelemetry
The ingress example showed what happens at the edge. This one moves inside the service chain, where latency often hides: between services, not at the edge. When a request travels from a frontend API to accounts and then to payments, every hop can add delay. Without tracing, you're left guessing which service is dragging things down.
Each service reads traceparent, starts a child span, and passes the updated context into the next HTTP request. If a gateway, ingress controller, or middleware strips that header, Jaeger will show broken trace fragments instead of one connected path.
Jaeger’s waterfall view is where this starts to pay off in day-to-day work. You can filter by minimum duration to spot slow traces fast, then check which span sits on the critical path. In practice, the table below works well for incident triage because it maps common trace patterns to likely causes.
| Issue | Signal in Jaeger | What to Do |
|---|---|---|
| Slow downstream service | One child span dominates total trace duration | Check whether the service is nearing capacity or waiting on a slow dependency |
| Timeout chain | Span ends exactly at the configured timeout value | Review timeout and retry policies for that hop |
| Cascading failure | One failed span causes errors in all parent spans | Pinpoint the root cause service; consider a circuit breaker |
| N+1 call pattern | Many identical spans under one parent span | Batch or cache the repeated calls |
| Network gap | Large gap between the end of a parent span and the start of a child span | Investigate network latency |
OpenTelemetry can auto-instrument many common HTTP frameworks, which saves a lot of setup time. But status codes still need care. Mark server spans ERROR for 5xx responses, and mark client spans ERROR for failed calls, timeouts, and network exceptions. [15][16]
Once the HTTP chain is mapped out, the next choke point often sits one layer below it: the database span.
3. Background Job and Batch Processing Tracing in Kubernetes
HTTP tracing ends when the request ends. Batch work doesn't. So if a background job starts later, maybe seconds later, maybe hours later, you need to pass trace context at the moment the work is queued and read it back when the worker begins.
That handoff matters. When an API sends work to a worker, the trace has to move from request time to run time.
Take a CronJob running at 01:00 UK time. It pulls data from object storage, writes to a reporting database, then publishes a summary message. There's no HTTP request hanging around to carry context for any of that. If an API service dispatched the job, it should serialise traceparent into the job payload or message headers before the request finishes. The worker Pod then extracts that value and starts its own span as a link or follows-from relationship, not a strict parent-child chain. Each downstream call adds a span to the same trace. Trace both the enqueue span and the execution span so teams can see whether delay came from queue backlog or from the work itself [18][5][9].
For standalone Jobs and CronJobs, start a root span at the entrypoint. Then add job attributes such as service.name, service.namespace, k8s.job.name, batch.job_type, batch.schedule, batch.run_id and batch.records_count. Those fields make it much easier to filter runs and compare them side by side. Inside the job, wrap each main phase - load_input, transform_records, write_output - in named child spans. And before the process exits, flush the exporter.
Once the worker starts, the trace makes the delay visible. You can answer the main question fast: where did the time go? A nightly ETL trace might show a long read_from_s3 phase, which points to limited bandwidth or poor batching. A gap between scheduled start and actual start points to scheduler delay or queue backlog [17][19].
Kubernetes Jobs also retry failed Pods. That means traces with repeated ERROR spans, exception.type attributes and a rising job.retry_count can show retry behaviour clearly. If you see orphaned spans, the usual cause is broken context propagation. Maybe the queue library stripped unknown headers. Maybe the job payload wasn't serialised the right way.
These are the batch-specific signals to watch.
| Signal | What it reveals |
|---|---|
| Gap between scheduled and actual start | Scheduler delay or queue backlog |
| Dominant phase span | I/O bottleneck or slow downstream dependency |
Repeated ERROR spans |
Job retries due to transient or persistent failures |
| Orphaned spans | Broken trace context propagation |
| Repeated child spans | Fan-out pattern causing downstream pressure |
4. Database Query Tracing for Kubernetes Microservices
After service-to-service tracing, the database is often the next place where things slow down. A database span should sit under the request that triggered it. If that link is missing, you can spot a slow request, but you can’t tell whether the hold-up is in the application code or in the database.
A common chain looks like this: ingress/API gateway span → service handler span → database client span. OpenTelemetry auto-instrumentation supports common drivers and ORMs for Java, .NET, Python and Node.js. [23][24] For database spans, use attributes such as db.system, db.operation.name and a sanitised db.statement or db.query.summary. [20][21]
The signals that matter most are span duration, errors and span count. A long DB span makes it plain where the time is going. If one handler contains dozens of small SELECT spans, that usually points to an N+1 query pattern. In that case, batch loading or eager loading cuts both span count and latency. [27]
Connection pool exhaustion looks different. Here, DB spans fail with transport-level errors, while pool metrics such as db.pool.size and db.pool.active show that the pool is saturated rather than the query being slow.
Manual thread creation or async work without context propagation can turn DB spans into orphan spans. When that happens, check parent span IDs in Jaeger or Tempo. [25][26]
| Signal | What it reveals |
|---|---|
| Long DB span duration | Slow query, missing index, or full table scan |
| High DB span count per request | N+1 query pattern or missing batch loading |
| DB span errors with transport attributes | Connection pool exhaustion or network failure |
Repeated DB spans with retry.count
|
Retry storm amplifying database load |
| DB spans as orphan spans | Broken trace context propagation |
From here, the same tracing problem shifts from SQL calls to asynchronous messages.
5. Message Queue and Event-Driven Tracing with OpenTelemetry
HTTP tracing stops at the request boundary. Queue tracing has to carry context across that break.
A queue cuts the HTTP call chain in two, so you need to inject traceparent and tracestate into message headers before publish, then extract them when the message is consumed. The idea is simple: message headers act as the carrier, just like HTTP headers do for requests.
Because publish and consume happen at different times, you should link the spans instead of forcing a parent-child relationship. That small choice matters. It makes the queue boundary show up clearly in waterfall views.
Once context makes it across the queue boundary, the trace can show where time starts slipping away. Instead of seeing only the API request, you can view ingress, publish, queue wait, consume, and downstream work in one timeline. The producer records a SpanKind.PRODUCER span. The consumer then extracts the context and starts a SpanKind.CONSUMER span before moving into downstream work, such as a database write.
It also helps to trace queue wait, consumer runtime, retry attempts, dead-letter routing, and broker throttling through span timing and attributes. That’s where things often get interesting. A UK-based e-commerce team using Kafka for order events saw HTTP metrics showing API responses within a few seconds, but some orders still took over 20 minutes to confirm during peak traffic. After instrumenting the producer and consumer services and sending traces to Jaeger, they found that specific partitions were taking a disproportionate share of traffic. After rebalancing partitions and increasing consumer replicas, queue delays fell to under two minutes for 95% of orders. [5][29]
For span attributes, use these as a starting point:
-
messaging.system -
messaging.destination.name -
messaging.operation.name -
messaging.message.id
For Kafka, add messaging.destination.partition.id and messaging.kafka.offset. Those fields help you spot hot partitions and per-partition lag straight from your trace queries.
When traces break across queues, the cause is usually missing inject or extract logic, not a backend setup issue. Auto-instrumentation for common queue clients makes propagation the default instead of something teams have to wire up by hand. That way, queue lag and hot partitions appear in the same trace rather than hiding in separate tools.
6. Cross-Cluster and Multi-Tenant Tracing with OpenTelemetry Collector
Tracing inside one cluster is fairly straightforward. The hard bit starts when a request crosses cluster boundaries. If traceparent and tracestate don't make it across, one request gets split into two traces. You lose the full story at the exact point you need it most.
You can see this clearly in a cross-region path. A checkout request might begin in London, move to Frankfurt, and still sit under the same trace ID. But that only works if both clusters pass the trace context along and add span attributes like k8s.cluster.name and tenant.id. Without that, the path goes blurry fast. The Collector setup needs to keep that metadata intact at every hop.
In most setups, that means a two-layer or three-layer Collector path. Run local Collectors in each cluster, send data to a central gateway, and then apply tail-based sampling plus tenant attributes before export to the backend. That layout keeps tracing readable across the whole estate: cluster and tenant boundaries stay visible on every span, and one waterfall view can show the full request path end to end. [31][32][1]
There are three signals worth watching closely:
- Cross-region latency: this tends to jump out in the waterfall. If a 60 ms hop suddenly climbs to 350 ms, you're likely looking at network or routing trouble.
- Tenant-specific errors: tags such as
k8s.cluster.nameandtenant.idhelp you tell whether a spike is limited to one tenant in one region or affects the system more broadly. - Exporter back-pressure: retries and queue depth show when the telemetry pipeline is under stress. [31][33]
For day-to-day reliability, two safeguards do most of the heavy lifting. First, encrypt telemetry links between clusters with TLS or mTLS. Second, run synthetic transactions on a regular basis that cross both clusters and tenants, then check that every expected span appears in the backend. [2][31][33][34]
These cross-cluster traces show the same pattern that runs through all six examples: context starts in one place, crosses a boundary, and then either holds together or falls apart.
Patterns That Appear Across All Six Examples
Across all six examples, the same four questions keep coming up. They decide whether tracing helps or just turns into extra noise: where the trace begins, how it moves across boundaries, which attributes you track, and how delay shows up.
Where Trace Context Starts
A new root span will usually begin at an ingress or API gateway, a scheduler or CronJob controller, or a message producer.[11][4][5][6]
How Context Crosses HTTP, Queue and Job Boundaries
Use W3C Trace Context for HTTP and gRPC. Inject trace headers into queue messages. Pass context in job payloads or environment variables so workers can join the existing trace.[4][8][7][3][9][5][6][39]
Queues are where traces most often fall apart. Once the context makes it across that hop, the attributes start to show which part is slow.
Span Attributes That Expose Bottlenecks
Use these attributes across all six examples. They make it easier to compare spans across each hop, from services and jobs to clusters: http.route, db.system, messaging.system, messaging.destination.name, retry.count, k8s.cluster.name and tenant_id.[35][30][28][22]
How Waterfall Views Reveal Delay Points
Waterfall views show where time goes. Long spans often point to slow logic or contention. Repeated spans under a parent can signal N+1 patterns or retry loops. A gap between producer and consumer spans shows queue lag. Remote spans tagged with cluster or region attributes show cross-cluster hops.[36][37][38]
Waterfalls make long spans, repeated spans, queue gaps and cross-cluster hops easy to spot.
These patterns set up the trade-offs in the tables below.
Comparison Tables
These six examples come down to four choices: how deep you want to see, which backend to use, where async handoffs happen, and whether traces stay inside one cluster or cross several. A good way to think about it is simple: start with visibility, then match the backend and deployment scope to the traffic path.
Service Mesh Tracing vs Ingress-Only Tracing
Use this comparison to choose between edge-only visibility and full service-to-service tracing.
Service mesh tracing through Istio can see internal hops because the sidecar proxy runs on every pod. Ingress-only tracing shows traffic as it enters the cluster, but it stops after the first service unless that service has its own instrumentation.
| Aspect | Service Mesh Tracing | Ingress-Only Tracing |
|---|---|---|
| Visibility depth | Full service-to-service traffic, retries and internal hops | North–south edge traffic only |
| Setup overhead | High - sidecar injection and mesh control plane configuration | Low - configure the ingress controller and exporter |
| Where context breaks | Centralised via mesh policies for headers, sampling and retries | Relies more heavily on application code to preserve trace context past the gateway |
| Best-fit team | Complex microservice platforms with many internal calls | Teams starting with tracing at the edge before rolling out full mesh |
Jaeger vs Zipkin vs Tempo
These three tools differ mainly in how they store trace data and how people search through it.
Jaeger gives teams a strong search-focused UI. Zipkin keeps things lighter and simpler. Grafana Tempo takes a different route: it uses object storage and skips a full span index, which can help keep long-term storage costs down.
| Aspect | Jaeger | Zipkin | Grafana Tempo |
|---|---|---|---|
| Storage approach | Elasticsearch, Cassandra or OpenSearch | MySQL, Cassandra or Elasticsearch | Object storage with no full span index |
| Operational complexity | Moderate to high; mature Helm charts and operators | Low; simpler to run, can bottleneck at volume | Low storage cost; ingester and compactor add configuration overhead |
| Query experience | Rich UI - filter by service, operation, tag, latency and time range | Simple UI - service name and trace ID focus | Search by trace ID first; queried through Grafana and correlated with metrics and logs |
| How teams find the slow span | Drill down from a service or operation to high-latency traces | Quick lookup by trace ID or service name | Start from a Grafana metric or log alert, then pivot into the trace |
| Best fit | General-purpose Kubernetes tracing with strong search needs | Lightweight setups or legacy B3-based systems | Teams already using Grafana who need low-cost long-term retention |
Synchronous HTTP Tracing vs Asynchronous Messaging Tracing
The main difference here is straightforward: synchronous HTTP tracing follows one continuous request path, while asynchronous messaging tracing connects producer and consumer work through span links.
With async systems, producers need to inject context into message headers, and consumers need to extract it. That means the relationship is often not a clean parent-child chain.
| Aspect | Synchronous HTTP Tracing | Asynchronous Messaging Tracing |
|---|---|---|
| Propagation model | W3C Trace Context headers forwarded across HTTP/gRPC hops | Context injected into message metadata by the producer; extracted by the consumer |
| Latency signals | End-to-end response time per request | Queue wait time and consumer processing duration |
| Failure patterns | Timeouts, 5xx errors and cascading failures across the call graph | Dead-letter queues, re-delivery loops and consumer crashes |
| What to inspect first | Follow a single waterfall from ingress through API services to database spans | Search by message ID or queue name, then correlate producer and consumer spans |
Single-Cluster Tracing vs Multi-Cluster Tracing
Multi-cluster tracing starts to matter when services cross cluster boundaries. That might mean a producer in one cluster and a consumer in another, or separate clusters by tenant or region.
In a single-cluster setup, the trace path stays inside one boundary. In a multi-cluster setup, you’re stitching together request paths that move across regions, tenants or both.
| Aspect | Single-Cluster Tracing | Multi-Cluster Tracing |
|---|---|---|
| Where the trace path is visible | Full view within one cluster boundary | Cross-cluster request paths, including regional and tenant hops |
| Collector overhead | One collector deployment per cluster or per node | Local collectors per cluster forwarding to a central backend |
| Tenant separation | Logical - via namespace labels and tenant_id span attributes |
Physical - separate clusters per tenant, with optional aggregated global view |
| Sampling and retention | Single policy applied cluster-wide | Per-cluster or per-tenant policies that help with cost control and compliance |
How Tracing Supports DevOps and Cost Optimisation
Trace data shouldn't stop at debugging. It should also shape deployment checks, reliability reviews and cost work. The ingress, API, job, database and queue spans in the earlier examples can all feed release gates, SLO reviews and cost analysis.
Using Trace Data in CI/CD and SLO Reviews
Run smoke or load tests on each deployment, then export trace metrics such as p95 latency, span error rate and spans per request into your metrics backend. From there, teams can set automated gates to block a release if, say, checkout-service latency jumps by more than 20% against the previous build, or if database span errors pass a set limit. If you tag spans with build_id, git_sha and environment attributes, comparing one release with another becomes much easier.[43]
During SLO reviews, waterfalls show where the error budget was spent. That matters, because the issue often isn't just latency missed the target
. It's which service or dependency caused it. When teams compare traces from requests that breached the SLO with traces from requests that didn't, they often spot a pattern: extra spans, retries, or a slow third-party call that only appears in the failing cases. In multi-tenant clusters, attributes such as tenant_id also make it easier to see whether one tenant's workload is dragging down shared infrastructure.[40][45]
The same traces can also show repeated work and retry loops that quietly push costs up.
Finding Wasteful Call Chains and Retry Loops
Group spans by service and operation, then check for repeated calls between the same two services or retry storms with growing delays. Both patterns add CPU load, network traffic and database pressure. In UK-hosted environments, that can turn straight into higher spend on managed databases, node groups and network egress billed in pounds sterling.[41]
For retries, look for spans tied to the same logical operation with longer delays between each attempt. That's a strong sign that retry policies need tightening, or that circuit breakers should be added.[41]
These patterns also point to places where teams can trim wasted capacity and tune workloads.
Tracing for Capacity Planning and Resource Tuning
Span timing and concurrency data help teams size systems with more confidence. Long, CPU-heavy spans usually point to compute bottlenecks. Spans stuck waiting on downstream services tend to show I/O limits instead. For background jobs and batch workloads, like the month-end processing jobs in Example 3, span duration data shows when jobs saturate CPU and how long that lasts. That can help a team decide to add replicas only during peak windows instead of keeping them running all the time.[42][47]
Database spans with query fingerprints and row counts help DBAs decide which costly queries need indexing or caching first. Teams can also line up seasonal spikes, such as Black Friday traffic, with autoscaler behaviour to tune HPA and VPA policies and avoid keeping too much capacity in place all year.[46]
Once the sizing picture is clearer, the next step is to connect those same spans to billing labels and cost centres.
Tracing as Input to DevOps and Cost Engineering Work
Trace data becomes far more useful when it lines up with cloud billing labels. Tag spans with namespace, cost_centre and environment, then match those tags to the labels used in billing reports. That gives platform and FinOps teams a way to connect costly call chains to specific services or teams. If traces show a reporting job triggering thousands of long-running database spans during UK working hours, and the billing data shows a matching spike in database I/O charges, the team can look at moving the job off-peak, batching the queries or shifting the workload to lower-cost nodes.[44][46]
Use that same trace-and-billing view to rank the fixes that carry the highest cost.
Conclusion
These six examples map the main request paths in Kubernetes and show where latency tends to hide. In practice, most user actions pass through several boundaries, so if you only instrument part of the path, you miss what matters.
The pattern is pretty simple: context starts in one place and stays useful only if it survives every hand-off.
Good instrumentation gives developers enough context to diagnose issues without adding extra spans in the middle of an incident. That kind of clarity shifts traces from a debugging aid to a tool for performance and cost control. Tracing cuts diagnosis time and keeps optimisation aimed at the actual bottleneck.
The aim is a connected view of request paths, bottlenecks and cost drivers, so teams act on evidence instead of guesswork. With complete traces, teams can fix the right span, right-size the right workload, and cut wasted spend.
FAQs
How do I choose between DaemonSet, gateway and sidecar Collectors?
Choose based on your observability needs and infrastructure limits:
- DaemonSet: node-wide coverage without per-pod overhead
- Sidecar: granular per-pod visibility, but higher resource use
- Gateway: visibility into service interactions without changing application code
In high-traffic production setups, gateway- or proxy-level tracing can scale on its own, which helps you keep performance steady.
When should I use span links instead of parent-child spans?
Use span links when operations are causally related but don't share a direct execution hierarchy. Parent-child spans are the better fit for nested, synchronous request paths.
Span links work well for asynchronous batch processing, message queues, and distributed tasks where one operation is triggered by multiple upstream requests. They're also a good choice when background work continues after the original request.
How can I stop short-lived Jobs losing spans on exit?
Make sure the application explicitly flushes telemetry before the process exits. In short-lived Kubernetes Jobs, background export threads or in-memory buffers can be cut off before spans are sent.
Use the OpenTelemetry Collector to collect spans, and trigger shutdown so it calls force_flush() on the tracer provider before the container stops. It also helps to watch metrics such as otelcol_exporter_queue_size, which can flag silent data loss.