
If your cloud bill changes by the hour, a fixed monthly recharge is too blunt.
I’d sum the article up like this: dynamic chargeback links cloud spend to the teams, products, or cost centres that used it, using current usage data instead of rough month-end splits. That matters in the UK, where cloud use is now common, cloud revenue has grown from £3.7 billion in 2020 to £10.5 billion in 2024, only 5% of firms say their FinOps is fully mature, and 69% still overspend against cloud budgets.
If I were putting the core message into a short list, it would be this:
- Start with showback if your tagging and ownership data are not in good shape.
- Use simple allocation rules that teams can explain in one sentence.
- Match charges to elastic usage across autoscaling, Kubernetes, serverless, storage, and shared services.
- Split shared costs with clear drivers such as vCPU-hours, namespace usage, requests, or data volume.
- Spread discounts and commitments properly so savings follow the teams that used them.
- Automate the data pipeline and reconcile it to the cloud invoice before posting internal charges.
- Set a dispute window and review rules every quarter, with a full yearly review.
- Keep unallocated spend visible instead of hiding it in a shared bucket.
In plain terms, the article says one thing: cloud charging works when ownership is clear, shared-cost rules stay stable, and Finance can trace every number back to the provider bill.
A few points stand out most:
- Static recharge models break down in elastic setups.
- Kubernetes, serverless, and autoscaling need time-based usage data.
- Untagged spend should go to
__unallocated__, not be guessed. - Daily data with monthly statements is often a sensible rhythm.
- A shadow chargeback period helps test the model before money moves.
| Area | What the article pushes for |
|---|---|
| Starting point | Showback first, then chargeback |
| Main input | Current usage data plus ownership tags/labels |
| Shared spend | Split by a small set of clear usage drivers |
| Discounts | Apply blended rates and show savings separately |
| Governance | Written policy, dispute path, regular reviews |
| Data flow | Automated, auditable, invoice-reconciled |
So if I strip it right back, the article is not just about cost reporting. It is about making cloud spend visible in £, linking it to the people who caused it, and giving Finance and engineering one set of numbers they can both use.
Cost Allocation Models and Chargeback
What dynamic chargeback means in cloud environments
::: @figure 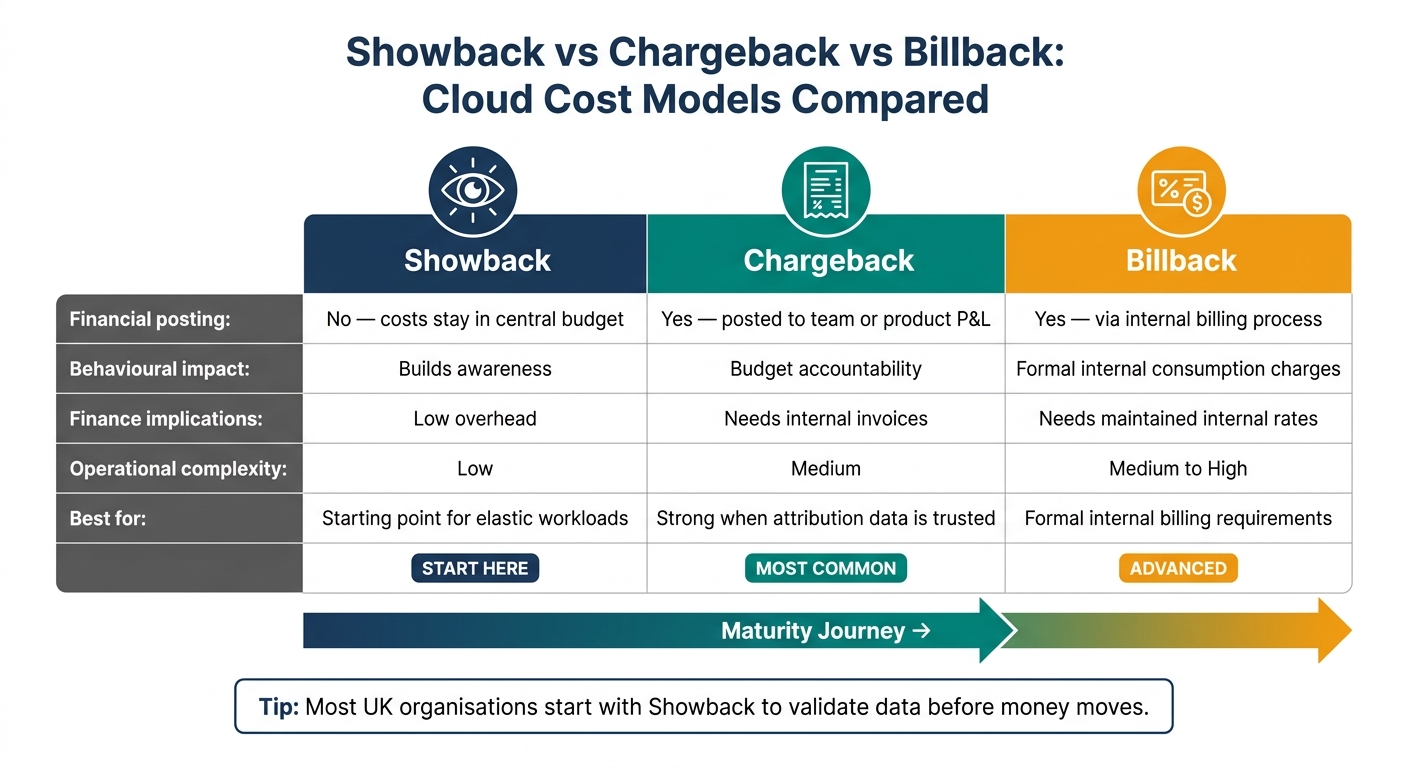 {Showback vs Chargeback vs Billback: Cloud Cost Models Compared}
:::
{Showback vs Chargeback vs Billback: Cloud Cost Models Compared}
:::
Dynamic chargeback assigns cloud spend based on current usage to the teams or business units that used it. In plain English, it links cost to what happened, not to what someone guessed would happen at the start of the month.
The model updates allocations when workload scale changes, when committed-use discounts kick in, or when unit prices move. That sounds simple, but it depends on two things going right: usage must be linked to a clear owner, and shared spend must be split the same way every time. When that’s in place, internal recharges in £ line up with what teams actually used, rather than what they were expected to use.[2][7][10][12]
Showback, chargeback and billback: key differences
Showback is information-only. Teams can see a breakdown of their cloud usage and the cost tied to it, but no money changes hands. The bill still sits in a central IT or cloud budget, which makes showback a low-risk place to start.[3][4][7]
Chargeback adds a financial step. Costs are posted to internal cost centres or product P&Ls, so engineering choices show up directly in team budgets. That creates clear accountability, because spend is no longer hidden inside a shared pot.[5][7][10][12]
Billback is a bit different. It uses agreed unit rates and internal billing, rather than passing through the exact cloud invoice.[4][9][13]
| Dimension | Showback | Chargeback | Billback |
|---|---|---|---|
| Financial posting | No - stays in central budget | Yes - posted to team or product P&L | Yes - via internal billing process |
| Behavioural impact | Builds awareness | Budget accountability | Formal internal consumption charges |
| Finance implications | Low overhead | Needs internal invoices | Needs maintained internal rates |
| Operational complexity | Low | Medium | Medium to high |
| Suitability for elastic workloads | Good starting point | Strong when attribution data is trusted | Useful when formal internal billing is needed |
Many UK organisations start with showback first. It gives teams and finance a chance to test the data, spot gaps, and build trust in the numbers before moving to chargeback.[4][7][8][11] That matters in cloud settings because elastic workloads don’t sit still. If ownership shifts, shared capacity changes, or unit costs move during the month, the allocation rules have to keep up.
What makes cloud resources elastic
Cloud resources are elastic because they can scale up and down on demand, often without manual action. An autoscaling group of virtual machines can grow during busy periods and shrink later. A Kubernetes cluster shared across product teams can shift spend between owners as workloads move around. Serverless functions add another layer, with charges based on invocation count and GB-second of execution. In all of these cases, spend can move a lot in a single day.[16][17]
Storage and managed services work in much the same way. A managed database can grow as data volume rises and shrink when records are deleted. A message queue or data warehouse may bill by throughput, requests, or queries processed instead of a flat monthly charge. That’s why a static split based on last month’s usage, team headcount, or department size often gets it wrong. One team may have a bursty workload, while another stays steady, and a fixed allocation won’t reflect that.[2][14][15]
A dynamic model deals with this by updating allocations from actual consumption, so the spend follows usage as it changes.
The next step is defining the ownership, allocation and pricing rules that make those updates reliable.
Core building blocks of a dynamic chargeback model
A reliable model rests on four inputs: ownership, shared-cost splits, pricing rules and measurement windows. Cloud spend can change by the hour, so chargeback needs rules that still hold up when usage scales, services are shared and prices shift. Get those rules right, and elastic usage turns into charges teams can actually trust.
Attribution data: tags, labels and ownership rules
Tags and labels are the link between cloud spend and a business unit. At a minimum, every billable resource should include six fields: team or squad, service or application, environment (prod, staging or dev), product or line of business, cost centre, and owner (usually a group email or ID). On AWS, that might look like Team=Payments, CostCentre=CC1234, Environment=Production. On Kubernetes, the same fields usually show up as namespace or workload labels such as team, app, env, cost-centre.
Of course, standards on paper don't mean much if nobody enforces them. AWS tag policies, Azure Policy, GCP Org Policies and Kubernetes admission controllers can reject or flag resources that arrive without the required tags. Use one tagging dictionary shared by Finance, Cloud Platform and Product Management. If a cost centre code in AWS doesn't match the code in Azure and the finance ledger, monthly reconciliation turns into a manual mess.
| Maturity level | Tagging compliance | Cost allocation | Reporting latency |
|---|---|---|---|
| Crawl (low) | 10–20% | 31–79% | 10–29 days |
| Walk (mid) | 21–50% | 80–85% | 5–9 days |
| Run (high) | >80% | >90% | <1 day |
Any spend that arrives without a valid tag should be sent to a central cost centre and reported in plain sight, not quietly absorbed or split on a whim.[22]
Allocation methods for dedicated and shared spend
Not every cost can be tied to one owner, so the model needs at least three allocation methods. The best rule here is simple: use the simplest method that fits the resource.
Direct allocation charges one team for one resource. Proportional allocation splits shared platforms using a usage metric like CPU hours, pod-hours or node-hours. Activity-based allocation charges for specific drivers such as egress, storage, logs or database requests.
| Method | Accuracy | Complexity | Best-fit resource types |
|---|---|---|---|
| Direct allocation | High | Low | Dedicated VMs, single-tenant databases, isolated storage buckets |
| Proportional | Medium | Medium | Shared Kubernetes clusters, central CI/CD, shared load balancers |
| Activity-based | High (when well-implemented) | High | Network egress, object storage, logging, shared databases, API gateways |
Most UK organisations begin with direct allocation and simple proportional splits. Then, once the basics are working, they add activity-based allocation for high-value services where cost drivers are easy to measure and matter to budget decisions.[18][24]
Time windows, discounts and variable pricing
For autoscaling and serverless workloads, daily granularity is usually the right measurement window. It takes the edge off short spikes but still shows weekday versus weekend patterns, or the impact of a marketing campaign. A sensible rhythm is to collect hourly data, review it daily and issue monthly chargeback statements.[20][23][25]
Committed-use discounts - AWS Reserved Instances, Savings Plans, Azure Reservations and GCP Committed Use Discounts - need careful handling. These discounts are often bought centrally but used across many teams, so the savings should follow usage. Charge teams at the blended effective rate, then record the realised saving as a separate line.[21][27][28] The rules for sharing those savings should be written into the chargeback policy before commitments are bought, not after the fact.
Spot and pre-emptible instances add price volatility. Record the actual hourly rates, then show a smoothed monthly average alongside a separate spot-savings line item.[21][25] Reconcile monthly and true up quarterly.
With ownership, allocation and pricing rules in place, the next step is wiring them into autoscaling, serverless and Kubernetes.
How to design and implement the model
Once ownership, allocation and pricing rules are set, the next step is to turn them into an operating policy. Put that policy into a Chargeback Charter signed off by Finance, Engineering and Product. Spell out the objective, scope and excluded use cases at the start. Be clear about which cloud accounts and regions are covered, how non-GBP billing is converted into £, and the minimum level of allocation detail. A simple way to handle precision is to use two tiers: high precision for stable costs, and lower precision for elastic or R&D workloads.
That same policy then needs to work across very different runtime models. Autoscaling, serverless and Kubernetes don’t behave in the same way, so the allocation pattern has to match the way each one consumes spend.
Design patterns for autoscaling, serverless and Kubernetes
For autoscaling groups on AWS EC2 Auto Scaling, Azure Virtual Machine Scale Sets or Google Managed Instance Groups, charge based on instance-hours or vCPU-hours. Multiply the number of instances by the hours they ran, then apply the provider’s actual invoiced rate. If teams use mixed instance types, normalise to vCPU-hours so cross-team comparisons stay fair and rightsizing discussions use the same baseline. It also helps to split each team’s autoscaling cost into two visible lines: baseline capacity and elastic capacity.[33][35][36]
For serverless, allocate cost by invocation and execution duration (GB-seconds) to the owning team or product, using tags, naming conventions or deployment pipelines. Shared platform costs - log retention, APM licences, API gateways and security scanning - should go into a pooled bucket and then be split using a simple driver, such as share of invocations or share of data volume. Free-tier credits should be allocated proportionally at organisation level. On top of that, report unit economics like cost per 1,000 invocations or cost per successful checkout.
For multi-tenant Kubernetes, start with namespace-based allocation. In plain terms, that means one namespace per team or product wherever possible. Meter CPU and memory requests, persistent volume claims and network egress per namespace, then map those figures to cost using the underlying node price. If namespaces are shared, use workload labels such as team, service and environment to sharpen attribution at pod level. Treat kube-system, monitoring and ingress namespaces as a platform overhead bucket, then redistribute that overhead across tenants in proportion to usage. Control-plane charges and shared cluster services should follow the same pattern: pool them, then allocate them with a simple driver. Report unused resource requests too, so teams can see where they are over-requesting at namespace or workload level.[32][19][34][36]
Provider implementation patterns and rollout phases
Each major provider gives you native billing and usage feeds that can power a dynamic chargeback pipeline. For UK teams, the main inputs and setup notes look like this:
| Provider | Primary mechanism | Allocation inputs | Implementation notes |
|---|---|---|---|
| AWS | Cost & Usage Report (CUR), Cost Explorer, Cost Categories | Resource tags, accounts, organisational units (OUs), instance-hours, GB-months, discount/credit data | Store CUR in S3 and query with Athena or Glue; use AWS Billing Conductor for multi-account blended rates |
| Azure | Azure Cost Management + Billing, Resource Tags, Management Groups | Resource groups, subscriptions, tags, usage metrics | Export usage data to Azure Storage or Log Analytics; report via Power BI |
| Google Cloud | Cloud Billing export to BigQuery, labels, projects, folders | Project ID, labels, SKU usage, commitment/discount data | Set up a separate FinOps project for billing exports; build BigQuery views and Looker Studio dashboards |
Before any recharge happens, convert non-GBP billing into £ using a finance-approved FX rate.
Start with provider feeds first, then move from visibility to billing in stages:
- Foundations: enforce tagging and labelling standards, ingest billing exports into a central data store, and define governance roles and success metrics.
- Showback: publish team cost reports only.
- Chargeback: introduce internal charging for larger, more predictable categories first. Internal invoices should line up with finance processes, including cost-centre codes, VAT and journal entries.[30][31][37][6][3][7]
- Optimisation: use chargeback data to drive rightsizing, commitment planning, autoscaling tuning and architecture decisions. Let teams keep a share of the savings they generate.
A shadow chargeback period between showback and live chargeback is often the safest route. Teams can see what their internal bill would be, but no money moves yet. That gives you time to test the model and flush out disputes before they turn into budget rows.[3][7]
Governance, disputes and review cycles
A written allocation policy is the backbone of governance. It should set out which costs are in scope, the ownership hierarchy (team → product → business unit), the shared-cost rules for platform services, the review cadence and a clear dispute path.
Tag compliance should be enforced at deployment time. CI/CD pipelines can reject resources that are missing required tags, while scheduled audits can flag untagged spend. Any cost that lands without a valid tag should go to a default unallocated cost centre and be reviewed in the open. It also makes sense to version tag rules, so historical reports remain comparable over time.[29]
For disputes, define a formal window - usually 15 to 30 days after internal invoices are issued - during which teams can challenge specific charges. Each dispute should be logged, checked against the written allocation policy and closed with a written outcome. Shared service costs and discount-sharing rules should be reviewed quarterly, or whenever a major architecture change, pricing update or new commitment purchase shifts the assumptions underneath the model. Writing down why a rule was set, not just what it is, makes those quarterly reviews much easier and keeps the model auditable over time.[37][6][3][7]
The dispute process is what keeps the model trusted once money starts moving.
Tools, data pipelines and operating support
Designing a chargeback model is only half the job. The harder part is keeping it accurate month after month as teams expand, services change and cloud bills move around. That’s where many organisations hit trouble.
The pipeline behind chargeback reports needs to be automated, auditable and checked against the provider invoice before any internal recharge is posted.
Data sources needed for reliable chargeback
Once the allocation rules are in place, the next step is feeding them with clean, reconciled data. A dependable dynamic chargeback model pulls from five main data source groups, each tied to the ownership and allocation rules already defined.
- Cloud-provider billing exports: the base layer for month-end reporting, with detailed billing lines such as SKU, region, usage type and list price.
- Technical usage data: data from monitoring tools that adds context like CPU hours, requests per second and storage operations.
- Kubernetes and platform metadata: data from cost-allocation tools that map cluster, pod and namespace usage to teams and services, so platform activity can be turned into cost by workload or business service.
- Discounts and commitments: reserved instances, savings plans, committed use discounts and enterprise agreements, which need to be spread across consuming workloads instead of left as lump sums.
- Finance mappings and reference data: cost-centre hierarchies, department codes and GL account mappings, joined to cloud tags and labels so costs land in the right budget.
A strong pipeline usually follows a landing → modelling → reporting pattern. Raw billing exports and usage metrics are ingested on a schedule. From there, the data is normalised and joined to finance reference data. Shared and untagged costs are then allocated using the agreed rules, discounts are spread proportionally, and foreign-currency spend is converted into £ using agreed FX rates. The end result is an authoritative cost table that feeds dashboards and month-end journals.
Daily or hourly refreshes make sense when workloads move fast, especially with autoscaling groups, serverless functions and multi-tenant Kubernetes clusters. For UK organisations, trust tends to come from lining the model up with finance periods such as a 4-4-5 cycle or a fiscal year starting in April, and reconciling allocated spend closely to the provider invoice.[38][39][40] Locking or versioning the dataset after month-end close also helps keep everyone working from the same baseline.
That creates the monthly recharge view Finance needs for elastic workloads.
Operational dashboards should support repeat decisions, not just one-off analysis. A useful set of views includes an executive summary by business unit or cost centre in £ with variance against budget, a team or service owner view with drill-down into application, environment and service costs, a tagging and ownership health view showing untagged or mis-tagged spend, and a commitments and discounts view that tracks utilisation. Untagged spend should appear as __unallocated__, so it’s plain where action is needed before month-end.[41][42]
When to bring in outside help
When the pipeline starts becoming difficult to maintain, outside support can help keep the model trusted and current. Common warning signs include cloud spend growing faster than the allocation model can handle, Finance rejecting chargeback numbers because they do not reconcile to the invoice, or multi-cloud and hybrid setups where no single team owns the full data picture.
Hokstad Consulting can help when internal teams need support with tagging, ETL pipelines, governance and hybrid-cloud cost normalisation.
Common problems and how to avoid them
Once chargeback goes live, two issues tend to show up first: poor data quality and overcomplicated models. You usually see both fastest in autoscaling, serverless, and shared Kubernetes estates, where usage moves around day by day.
Weak data quality and inconsistent ownership
The clearest sign of weak data quality is a big unallocated
or shared services
bucket in the monthly report. If 20–40% of an AWS or Azure invoice can't be tied to a team, product, or cost centre, finance starts to lose faith in the detail and falls back to rough top-down allocation. That often means splitting costs by headcount or revenue instead of actual usage. When that happens, the model stops shaping budget decisions.[44][45][46]
In most cases, the root cause is tag drift. There may be a tagging policy on paper, but if nobody enforces it when resources are created, compliance slips as the estate grows. Short-lived test environments, manual console changes, and stale infrastructure-as-code templates all play a part. Without enforced tags, dynamic chargeback can't track usage properly as resources scale up and down.
FinOps guidance recommends aiming for 95%+ coverage by spend if you want dependable financial governance. Once you drop below roughly 80%, the allocation data becomes shaky and is only good for rough estimates.[47]
The fix is pretty plain: treat tagging like core infrastructure, not admin tidy-up. Set the minimum tags that Finance will enforce:
- owner
- environment
- service
- cost centre
Then enforce those tags through infrastructure-as-code and CI/CD policy checks, so resources can't be deployed without them. For items that can't carry provider tags, such as data transfer charges or legacy assets, use virtual tags based on account hierarchy or rules. That helps shrink the unallocated bucket.[26][48]
It also helps to publish spend-weighted tagging compliance to both engineering and finance. If the gaps are visible, they can be tracked and fixed.
Too much precision, not enough trust
The second failure mode is less obvious, but just as damaging: a model that looks tidy in a spreadsheet and is useless in day-to-day work. Some teams build allocation formulas that combine CPU hours, memory, storage operations, API call counts, and user volumes, all shifting month to month. The goal is fairness. The result is often a model that almost nobody can explain.
And that's where it falls apart. If the model can't be explained in one sentence, people stop using it. Engineers can't predict the cost effect of a new feature. Finance can't explain a variance to an auditor. Product teams stop using the data in roadmap choices. Finance ends up building a second, simpler spreadsheet on the side. The detailed model turns into a reporting exercise instead of something that guides decisions.[47]
The right amount of precision is the lowest amount of detail that still supports sound decisions. In practice, that usually means one clear driver for each shared platform. For example:
- namespace-level CPU and memory use for Kubernetes
- service count per team for observability
Write the rule in plain English and include a worked example in £.
If a team's workloads consume 30% of cluster resources, they receive 30% of the £50,000 monthly cluster cost = £15,000
That kind of rule is easy to follow, easy to challenge, and easy to audit. Keep the core rules stable for 12 months as well. If the method keeps changing, historical comparison becomes messy. Frequent methodology changes are one of the clearest signs that the model needs simplification, not more detail.[43][1]
Conclusion: what a good dynamic chargeback model delivers
With the right model, pipeline and governance in place, a dynamic chargeback setup makes elastic cloud spend traceable across autoscaling, serverless and Kubernetes workloads. Engineering managers can see team spend in £, finance can reconcile it to cost centres, and product owners can bring cost data into planning.
Its job is simple: turn elastic usage into charges that teams can trust, budget for and improve. That leads to tighter control, clearer accountability, better forecasts, and faster rightsizing and allocation calls.
Key takeaways for decision-makers
In practice, the simplest rules tend to work best:
- Start with showback if tagging and ownership are incomplete. Showback gives you room to fix those gaps before moving to internal recharging.
- Keep allocation rules explainable. If a rule can't be explained in plain English, people will stop trusting it long before they care about the extra accuracy. A simple, agreed method is often better than a precise one that nobody understands.
- Align chargeback to real usage patterns. Elastic workloads - autoscaling groups, serverless functions and Kubernetes pods - shift hour by hour. A static monthly snapshot can misstate consumption. Time-aware allocation ties cost to actual use.
- Review the model regularly. Cloud estates change. New services appear, teams get reshaped and provider pricing moves. Review the model each year, with quarterly check-ins, so it stays fit for purpose.
What matters most is a model that teams trust, finance can audit and leaders can use - and one that gets better with each review.
FAQs
How do we start chargeback with poor tagging?
Don’t roll out billing on day one. Start with a showback period for 3 to 6 months so teams can see the cost data, get used to it, and build trust in the numbers.
During that window, tighten up tagging. Put a mandatory tagging policy in place and use automated enforcement to block untagged resources. Once tagging accuracy is above 90%, move into a 2 to 3-month shadow chargeback. That gives you time to check the cost model, sort out disputes, and make sure charges land where they should.
How should shared Kubernetes costs be split fairly?
Split shared Kubernetes spend into two buckets:
- Direct costs, like compute and storage
- Shared overheads, like the control plane and monitoring tools
A practical way to allocate those costs is a 70/30 split. Assign 70% based on resource requests and 30% based on actual usage.
For other shared services, use proportional allocation tied to metrics like:
- CPU hours
- Data egress
- Request counts
It’s also smart to start with a showback phase before moving to chargeback.
How are discounts and savings allocated?
Use amortised costs instead of unblended costs. That way, teams get their fair share of the savings from centrally bought Reserved Instances or Savings Plans.
Some resources can't be tagged on their own. In those cases, use virtual tags or split costs based on usage drivers like:
- CPU hours
- Request counts
- Data egress
You can also divide shared overhead in a simple, practical way. For example, split 70% by resource requests and 30% by actual usage.