
AI is reshaping DevOps by predicting failures before they happen. Instead of waiting for builds to break, AI tools analyse patterns in pipeline data - like error rates, latency, and resource usage - to flag potential issues early. This means fewer disruptions, reduced downtime, and faster deployments.
Here’s what you need to know:
- AI uses historical data to predict build, test, deployment, or infrastructure failures.
- It relies on data like build logs, test history, and system metrics to spot warning signs.
- Models like Random Forest or XGBoost can classify risks or assign failure probabilities.
- Early detection cuts downtime costs (over £1M/hour) and saves testing resources.
- Integration options include real-time alerts, automated gates, or self-healing systems.
Why it matters: Operational downtime averages 220 minutes and costs enterprises millions. AI reduces this by up to 50%, improving reliability and saving resources. Want to make your pipelines smarter? Start with 90 days of clean historical data, choose the right AI model, and integrate predictions into your CI/CD workflows.
How to Use AI to Explain CI Pipeline Failures!
Understanding Pipeline Failures and Data Sources
When building AI models to predict pipeline failures, it's crucial to define the types of failures you want to address. Each failure type has its own causes and data patterns, and understanding these distinctions helps you tailor your AI model to the specific challenges of your DevOps pipeline.
Common Failure Types in DevOps Pipelines
Build failures are among the most noticeable issues. They often occur due to dependency drift, missing environment variables, or lockfile conflicts. In these cases, the code itself might be fine, but the environment is misconfigured. On the other hand, test failures, especially flaky tests, present a more elusive challenge. A flaky test might pass during one run and fail during another - even when the code hasn't changed. Common culprits include race conditions, asynchronous timing issues, or shared mutable states between tests. Research shows that flaky tests contribute to 5%–16% of build failures in large-scale projects [2], and Google reports that 16% of its internal test failures are flaky rather than actual bugs [5].
Deployment errors often arise from configuration drift or differences in regional infrastructure. These problems only become apparent when the code is deployed to a real-world environment. Lastly, infrastructure failures stand apart, as they are typically unrelated to code quality. Examples include CPU or memory exhaustion, runner cold-starts, and pod restarts.
If your test suite is green but defects keep reaching production, you do not have a coverage gap. You have a signal problem.- Bhawana [4]
Key Data Sources for AI Prediction
Each type of failure leaves behind a distinct data trail. Knowing where to look for these signals is key to improving the accuracy of your AI model.
| Failure Type | Typical Root Causes | Key Data Sources for AI |
|---|---|---|
| Build Failure | Dependency drift, syntax errors, lockfile issues | Commit metadata, build logs, VCS diffs |
| Flaky Test | Race conditions, async timing, network jitter | Test execution history, duration stddev, network call logs |
| Deployment Error | Missing env vars, config drift, regional instability | System metrics, infrastructure telemetry, deployment logs |
| Infrastructure | CPU/memory exhaustion, runner cold-starts | Resource usage metrics, runner metadata |
To enhance prediction accuracy, leverage version control metadata for file-level and function-level changes, and CI/CD logs to capture step-specific errors. For flaky tests, test execution history is invaluable, as it reveals patterns in pass/fail results and retries. Meanwhile, infrastructure metrics - like CPU and memory usage or network I/O - offer time-series data that can help identify resource-related failures before they escalate.
Minimum Data Requirements
Once the data sources are identified, it's essential to ensure you have enough data to train your AI model effectively. Training on less than 30 days of CI data is risky - it can lead to guesswork rather than meaningful learning [4]. A safer baseline is 90 days of historical CI runs, providing enough information to separate genuine patterns from random noise. For flaky test prediction, aim for at least 100 runs per test to achieve consistent precision [5].
Data quality is just as important as quantity. Exclude infrastructure-related issues, like runner disk pressure, from your training set, as these can distort the model's understanding of defect signals [4]. Similarly, remove data from major outage periods to prevent the model from interpreting abnormal error rates as typical behaviour [7]. Clean, well-organised data spanning at least 90 days is the foundation for building an effective AI prediction model, setting the stage for the next steps in development.
Designing an AI-Based Prediction Approach
::: @figure 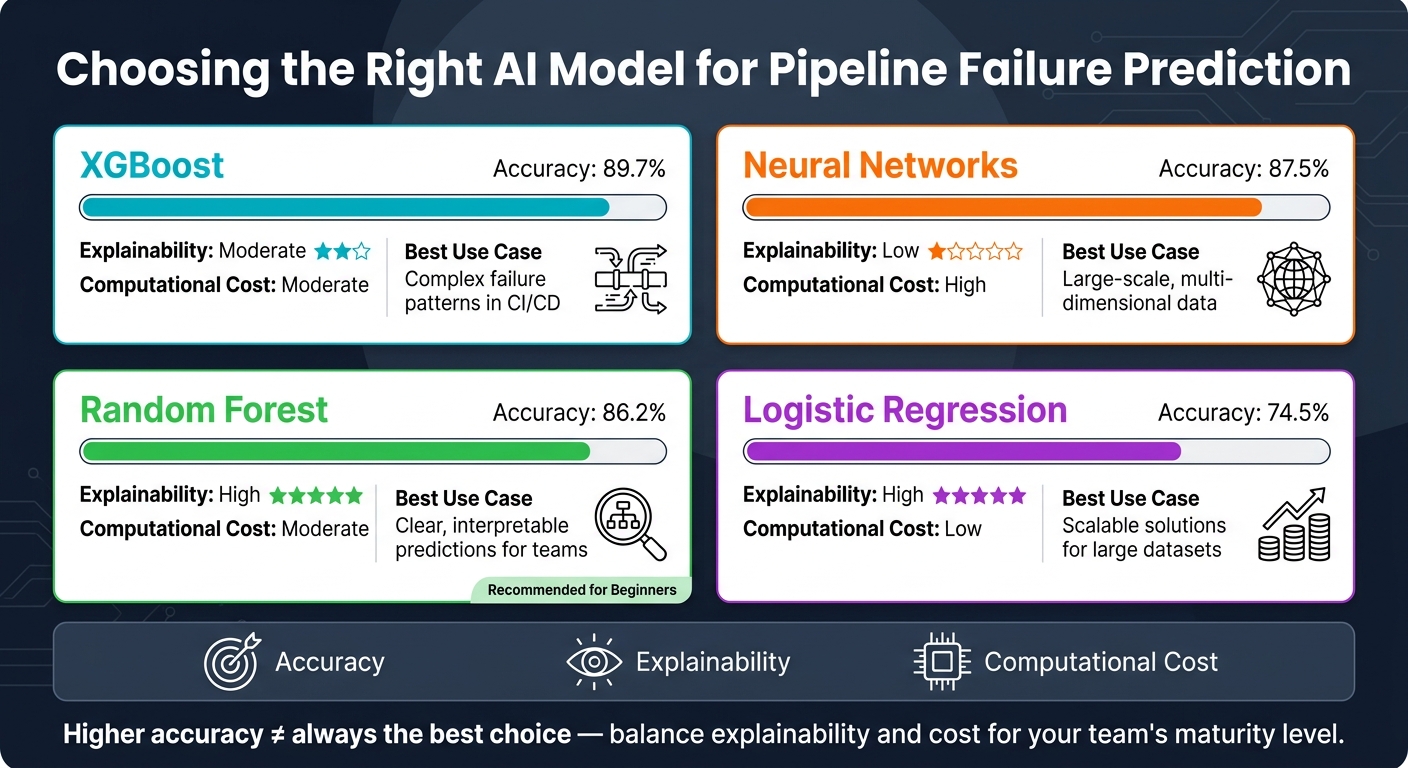 {AI Models for DevOps Failure Prediction: Accuracy vs. Explainability vs. Cost}
:::
{AI Models for DevOps Failure Prediction: Accuracy vs. Explainability vs. Cost}
:::
Once your data is clean and ready, the next step is selecting an AI method that can effectively predict failures in real-world scenarios.
AI Techniques for Failure Prediction
There are three main AI approaches commonly used to predict pipeline failures, each tailored to specific challenges.
- Supervised learning: This method, using models like Random Forest or XGBoost, is ideal when you have labelled historical data (e.g., past builds tagged as
failed
orpassed
). These models pinpoint combinations of features, such as commit metadata or test results, that often precede failures. - Unsupervised anomaly detection: Techniques like Isolation Forest focus on understanding what
normal
behaviour looks like and flagging deviations. This is particularly useful for detecting infrastructure issues when labelled data is scarce. - Time-series forecasting: This approach analyses resource trends, such as CPU or memory usage, and predicts when a critical threshold might be crossed, providing early warnings of potential issues.
Selecting the right method depends on the nature of your problem and the type of data available.
Framing the Prediction Problem
Clearly defining the prediction task is essential for aligning the AI approach with operational goals. Two common ways to frame the problem are:
- Binary classification: A straightforward yes/no prediction, such as
Will this build fail?
- Risk scoring: Assigning a probability (e.g., 0.0 to 1.0) to indicate the likelihood of failure. This approach is often more actionable, helping teams prioritise pipelines that need the most attention.
To improve precision, consider these strategies:
- Use file- or function-level diffs to enhance predictive accuracy [4].
- Apply recency weighting, such as an exponential decay with a 60-day half-life, to give more importance to recent failures [4].
- Run the model in observation mode for at least two weeks before making it operational. This helps validate that predictions align with actual outcomes [4].
Trade-offs in Model Selection
Choosing the right model involves balancing accuracy, explainability, and computational cost. Here's a comparison of some common models [9]:
| Model Type | Accuracy | Explainability | Computational Cost | Best Use Case |
|---|---|---|---|---|
| XGBoost | 89.7% | Moderate | Moderate | Handling complex failure patterns in CI/CD |
| Neural Networks | 87.5% | Low | High | Large-scale, multi-dimensional data |
| Random Forest | 86.2% | High | Moderate | Clear, interpretable predictions for teams |
| Logistic Regression | 74.5% | High | Low | Scalable solutions for large datasets |
While accuracy is important, it's not the only factor. For teams just starting out, a model like Random Forest often strikes a good balance between accuracy and explainability. As Yile Gu from Microsoft Research explains:
An explainable anomaly detection system will enable on-call engineers to easily improve any inaccuracies.
Another key decision is choosing between real-time and batch processing. Real-time inference is ideal for mid-pipeline decisions, such as blocking a deployment to avoid production failures, but it requires low-latency infrastructure. Batch processing, on the other hand, works well for overnight trend analysis and model retraining. Many teams combine both approaches: using a lightweight model for real-time predictions and a more complex model for periodic deep analysis [8].
These decisions lay the groundwork for integrating AI into your CI/CD pipelines effectively.
Training Models Using Pipeline Data
To build effective models, you need to start with well-organised data and a focused approach to feature selection.
Preparing the Training Dataset
The first step is to gather and normalise CI/CD telemetry from platforms like GitHub Actions, GitLab CI, or Jenkins. Use their REST APIs to structure the data into a row-per-test-per-run format. Include details like run ID, commit SHA, test name, status, and duration, and combine this with version control metadata such as commit messages, author information, and file-level code changes [5][10].
A clear labelling strategy is crucial. For failure prediction tasks, binary labels (0 for success, 1 for failure) are effective. For flaky test detection, label a test as flaky
if its pass rate falls between 10% and 90% over a rolling window of at least 5–30 runs [5][11]. To maintain consistency, version your labelling function in Git. This way, as your team's tolerance for flakiness evolves, retraining the model remains straightforward.
Before training, it's important to clean the dataset by removing irrelevant noise. This includes filtering out issues like runner disk pressure, DNS errors, and debug messages unrelated to the code. This ensures the model focuses on meaningful, code-related signals rather than environmental anomalies [4][5].
Once your dataset is clean and labelled, the next step is to extract features that will provide real predictive value.
Feature Engineering Best Practices
Raw pipeline logs don’t offer much value on their own. The real insights come from transforming this data into meaningful features. Below is a summary of feature categories that can significantly improve model performance:
| Feature Category | Specific Features | What It Detects |
|---|---|---|
| Behavioural | Pass-rate variance, duration standard deviation | Timing bugs, instability [5] |
| Structural | Async operation count, network call frequency | Race conditions, unbounded timeouts [5] |
| Environmental | Runner OS, distinct runner count | Platform-specific flakes, worker contention [5] |
| Metadata | File change rate (last 90 days), shared fixture count | High churn correlating with future regressions [5] |
For behavioural features, use a 30-run rolling window. This strikes a balance between capturing recent changes and providing enough data for stable variance estimates [5]. Combine this with exponential decay weighting (using a 60-day half-life) to prevent older failures from distorting predictions [4]. To extract structural signals, rely on AST parsing to count async operations and network calls accurately [5].
For categorical data, such as branch names or runner types, convert them into numerical values to ensure compatibility with your model.
With these features in place, the next step is to evaluate how well your model performs.
Evaluating Model Performance
The key engineering choice is the threshold. A reckless 0.5 threshold floods your team with false positives. Set a precision threshold of ≥ 0.80, then accept the resulting recall.- Desplega.ai [5]
When evaluating your model, focus on precision and recall. Precision measures how often flagged failures are genuine, while recall indicates the proportion of actual failures the model identifies. Additionally, use ROC-AUC to assess the model’s ability to distinguish between stable and failing builds across all thresholds. Aim for a range of 0.90–0.95 for a well-tuned model [11].
In practice, prioritising precision is often more useful. For example, studies show that 16% of test failures in Google's infrastructure are flaky, and 59% of developers encounter flaky tests at least weekly [5]. To validate the model, run it in observe mode for a week. This allows you to compare its predictions against real-world build outcomes in your environment [5].
Integrating AI Predictions into DevOps Workflows
Once your model is performing well and has been validated, the next step is ensuring its outputs actively influence decisions in your pipelines. The goal is to avoid letting these predictions become just another overlooked report. Instead, they should drive meaningful, proactive actions within your workflow.
Embedding AI Models in CI/CD Systems
There are several ways to incorporate predictions into your pipeline:
- Use a MaaS (Model-as-a-Service) setup to call a hosted API for risk scores after each build.
- Embed a Python script directly in your YAML configuration to load and run a pre-trained model inline.
- Implement custom test reporters that flag high-risk failures in real-time, marking them as warnings rather than hard failures [5].
The best approach depends on your team's needs. Inline inference offers low latency and avoids external dependencies, but it requires bundling the model artefact with your pipeline. On the other hand, a MaaS setup is easier to maintain and update centrally, though it introduces a network dependency. For most teams, starting with an internally hosted endpoint provides a practical balance between ease of use and control.
Automation Strategies Based on Predictions
Risk scores are only useful if they lead to actionable responses. Automation built around these scores can be structured into three levels of maturity:
- Level 1: The model acts as an observer, posting diagnostics (e.g., as a PR comment) without directly affecting the pipeline.
- Level 2: It becomes a gatekeeper, routing high-risk PRs for additional integration tests or even blocking merges based on confidence thresholds.
- Level 3: The model evolves into a healer, autonomously opening fix PRs for specific, well-understood failure types [6].
AI detection should never silence failures automatically. That would be dangerous.- Pete Miloravac, Software Engineer, Semaphore [3]
Starting with Level 1 is often the safest and most effective approach. For instance, a high-risk score could trigger a review process instead of halting the build entirely. This builds trust and ensures a measured response. Elastic's self-healing system is a great example - it autonomously fixed 24 broken PRs in a single month, saving significant development time [6].
Monitoring and Refining Prediction Outputs
Deploying an AI model isn’t a one-and-done task. Codebases evolve, workflows change, and models trained on older data can quietly lose their edge. To prevent this, log prediction outputs - like probability scores and confidence levels - into a time-series database such as InfluxDB. Pair this with visualisation tools like Grafana to monitor these metrics alongside real-time pipeline data [1]. This makes it easier to spot performance drift before it becomes a problem.
A well-calibrated model typically flags 3%–5% of data points [7]. If this rate increases sharply, your thresholds might need adjusting; if it drops too low, the model could be growing stale. Set automated alerts for models that haven’t been retrained within 30 days, and reset baselines right after major deployments, as new features often shift the definition of normal
[7]. Regularly review prediction outputs during postmortems to fine-tune the model over time.
Scaling and Improving Predictive DevOps
Governance and Trust in AI Predictions
Before expanding the use of AI predictions, it’s crucial to establish a clear governance framework. Without it, engineers may ignore model outputs if they don’t fully understand them.
Transparency is essential. Models that act like black boxes
- producing predictions without any explanation - are not suitable for production environments. Instead, focus on models that show the contributing factors behind their predictions. This allows engineers to verify and trust the results. To enforce model decisions, use Policy-as-Code tools like Open Policy Agent (OPA) with Rego. These tools let you set strict rules, such as only permitting automated actions when a model’s confidence score exceeds 0.8.
Building trust in AI predictions works best with a phased approach. Start by deploying the model in shadow mode
for at least two weeks, where it observes and predicts but doesn’t influence pipeline decisions. This period allows teams to validate its accuracy in real-world conditions without any risk. After that, you can gradually move through stages like approval-gated actions, limited autonomy under strict boundaries, and finally conditional autonomy, where the system operates independently but with safety measures like kill-switches.
| Trust Tier | Description | Human Involvement |
|---|---|---|
| Observational | AI provides insights only | Full - human decides and acts |
| Approval-Gated | AI suggests action; requires sign-off | High - human validates |
| Narrow Autonomy | AI acts within strict limits | Low - human monitors |
| Conditional Autonomy | Full autonomy with safety measures | Minimal - human intervenes on failure |
To ensure accountability, document model versions, data lineage, and training datasets. This creates a reliable audit trail for cases where an AI-driven action produces unexpected results.
With these governance measures in place, organisations can confidently scale AI predictions across teams and workflows.
Scaling Across Teams and Services
Once integration techniques are in place, scaling AI predictions requires standardisation and centralised oversight. Challenges arise because services generate different types of telemetry, teams follow varied deployment timelines, and compliance needs can differ across regions or business units.
A central model registry with standardised REST or gRPC interfaces simplifies adoption. This setup avoids vendor lock-in and allows teams to integrate AI predictions into their workflows without extensive rework. To streamline data collection and system modularity, use a five-layer architecture that includes data collection, reliability intelligence, predictive modelling, adaptive execution, and human-AI collaboration. This approach makes it easier to onboard new services without rebuilding the system [2].
Multi-region deployments add complexity due to infrastructure differences. A rollout strategy that works well in one region might not suit another. Multi-region awareness, where models adapt their validation rules based on the stability patterns of each region, helps manage these differences without needing separate models for every location [2]. Standardising metrics like the Pipeline Health Index (PHI), Test Stability Score (TSS), and Failure Prediction Confidence (FPC) provides leadership with a unified view of system health, reducing reliance on fragmented team dashboards [2].
Continuous Improvement and Cost Reduction
To maintain accuracy over time, regular retraining of models is essential. As codebases evolve, concept drift can reduce the reliability of predictions unless addressed.
Automate retraining every seven days or after major deployments. Be sure to exclude incident data during retraining to prevent the model from treating unusual error rates as normal [8][7]. Use a 60-day half-life for historical data, so recent failure patterns carry more weight than outdated data from retired or heavily refactored modules [4].
On the cost side, monitor metrics like CI cost per merged pull request and inference cost per run to ensure that compute expenses remain aligned with the savings generated by AI. Implementing intelligent caching can cut redundant CI work by 20–40% [13], delivering measurable savings. For organisations seeking more targeted optimisation, Hokstad Consulting specialises in reducing cloud and DevOps costs while refining AI strategies - a valuable service for scaling systems in larger environments.
Conclusion
AI-powered failure prediction is transforming how DevOps teams handle challenges, shifting the focus from scrambling to fix issues to preventing them from happening in the first place. For instance, predictive maintenance has been shown to reduce unplanned downtime by up to 50% and lower maintenance costs by 30% [12]. This means smoother workflows, fewer disruptions, and reduced operational expenses.
To get started, the steps are clear: review your current CI/CD data, clean and balance your datasets, choose models tailored to specific failure types, and roll out predictions gradually. Start by using them in a monitoring capacity, then move towards automation. Governance plays a key role here, ensuring transparency through tools like Policy-as-Code and maintaining audit trails. This approach ensures that teams understand the reasoning behind system decisions, which is essential for trust and accountability.
AI won't replace DevOps engineers - but DevOps engineers who use AI will replace those who don't.- Claude AI
Scaling these practices across teams and services involves standardisation, frequent model retraining, and keeping a close eye on cost efficiency to ensure the investment delivers tangible benefits.
For organisations ready to take the leap, Hokstad Consulting provides expert guidance in DevOps transformation, AI strategy, and cloud cost management. Their No Savings, No Fee
model lowers the financial barrier to entry, while their expertise in custom monitoring and AI agent development aligns perfectly with the tailored approach outlined here. By adopting AI for failure prediction, organisations can achieve more stable systems and long-term operational gains.
FAQs
What data is needed to predict pipeline failures with AI?
To anticipate pipeline failures effectively, you need a well-organised collection of historical data to spot patterns and recurring issues. The most important types of data include:
- CI results and logs: Information such as test outcomes, durations, retries, and reasons for failures - ideally gathered over a minimum of 90 days.
- Change metadata: Details like pull requests, modified files, and dependency graphs.
- Infrastructure metrics: Key performance indicators such as CPU usage, memory consumption, and latency.
Make sure this data is cleaned and centralised to improve the accuracy and reliability of AI-driven predictions.
How do I stop AI alerts creating too many false positives?
To cut down on false positives in AI-driven DevOps alerts, focus on improving the model's context and training process. Consider using machine learning models that adjust over time to account for changes in patterns, also known as concept drift. Place emphasis on golden signals - such as error rates - rather than relying on sheer volume-based metrics, which can be misleading.
Run a supervised learning phase lasting about 2–3 weeks to test and validate the recommendations before fully automating the system. Additionally, organise related logs and metrics into cohesive insights. This approach not only reduces alert fatigue but also makes the signals clearer and more actionable.
How can I add AI risk scores into my CI/CD without slowing builds?
To seamlessly integrate AI risk scores into your CI/CD pipeline while keeping everything running smoothly, it's important to take a risk-based approach. Here's how:
- Prioritise tests based on risk: Use a prediction service to estimate the likelihood of defects. This allows you to focus on the most critical tests first.
- Run high-risk tests in a blocking phase: These tests provide immediate feedback, ensuring that potential issues are caught early in the process.
- Execute lower-risk tests asynchronously: This helps maintain the pace of your builds without compromising on thoroughness.
- Keep safeguards in place: Use smoke tests as a safety net to catch major issues quickly.
- Use AI as a decision-making tool: Let AI assist in prioritising and managing tests, but don’t rely on it as a complete replacement for human judgement.
If you're looking for expert guidance, Hokstad Consulting offers tailored solutions to design pipelines that balance efficiency with reliability.