
When a multi-cluster deployment fails, I don’t start by guessing. I check four things in order: where it failed, which cluster it hit, whether access still works, and what changed in that cluster.
That simple flow cuts delay, trims wasted CI minutes, and helps teams avoid repeat failures that can add up to hours of engineer time and extra £ spend on reruns and overprovisioned clusters. In most cases, the fault comes back to a short list: bad credentials, blocked API access, drift, version mismatch, or a broken dependency outside the cluster.
Here’s the short version:
- Start in CI first: find the first failed job, the run ID, and the target cluster
- Check GitOps next: look for sync, health, and controller errors in Argo CD or Flux
- Test access fast: verify context, API reachability, auth, and RBAC with
kubectl - Compare clusters: check Kubernetes versions, CRDs, Secrets, ConfigMaps, and controller versions
- Review external links: DNS, TLS, ingress, queues, and database endpoints often fail in one region only
- Use shared visibility: central logs, metrics, and labels like
cluster_nameandpipeline_run_idmake faults easier to trace - Stop repeat issues: add pre-flight checks, drift scans, runbooks, and version-controlled cluster baselines
A lot of multi-cluster issues are only partial failures. One cluster may deploy fine while another breaks, which can hide the pattern. That’s why I’d treat debugging as a fixed path, not a scramble between tools.
| Check area | What I look for | Common failure signs | First action |
|---|---|---|---|
| CI pipeline | First failed stage, context, run ID | Wrong cluster, failed deploy step, broken validation | Inspect job logs and active context |
| GitOps | Sync state and controller status |
OutOfSync, Degraded, Ready=False
|
Check controller and app conditions |
| Cluster access | API, auth, RBAC, network |
401, 403, DNS or routing errors |
Run kubectl get ns and kubectl auth can-i
|
| Cluster state | Drift, version gaps, missing CRDs | One cluster fails, others pass | Compare against a working cluster |
| External services | DNS, TLS, queues, databases | Post-deploy tests fail after rollout | Check region-specific endpoints |
If I had to sum it up in one line, it’s this: make every cluster and every pipeline run easy to trace, then narrow the problem in a fixed order.
CI/CD Tutorial for Kubernetes: Build & Deploy with GitLab, Harbor and ArgoCD
Need help optimizing your cloud costs?
Get expert advice on how to reduce your cloud expenses without sacrificing performance.
Set up observability across every cluster before you debug
Before you try to isolate a fault, make sure every cluster and every pipeline run is traceable from one place. You want one shared view of logs, metrics and deployment state across all clusters. That gives you the three observability pillars for multi-cluster debugging: centralised logs, dashboards and a cluster inventory.
Centralise logs and tag them by cluster and pipeline run
Deploy a log collection agent on every cluster, such as Fluent Bit, Vector or an OpenTelemetry Collector, and send those logs to a central store like Loki, Elasticsearch or OpenSearch. Do the same for your CI platform, so pipeline logs end up in that same location.
Tag every log with the same cluster and pipeline fields. At a minimum, include cluster_name, environment, namespace, and pipeline_run_id. Once those labels are in place, an engineer can filter by one pipeline run ID and trace the whole chain straight away, from the CI job to the GitOps controller and then into the pods on the target cluster.
Use structured JSON logs with consistent fields such as timestamp, service name, environment and trace ID. That keeps queries stable as your setup grows. It also helps to annotate Kubernetes workloads with the pipeline run ID, so the link between a CI run and a live workload doesn't get fuzzy.
Once logs are searchable by run and cluster, carry that same context into your dashboards.
Use dashboards to track jobs, clusters and sync status
Track CI status, GitOps sync state and workload health in one dashboard. Argo CD exposes metrics like argocd_app_sync_status and argocd_app_health_status out of the box, while Flux exposes reconcile and readiness metrics for Kustomization and HelmRelease objects. When you pull those signals together with CI pipeline metadata and per-cluster pod readiness, the failure path becomes much easier to spot.
In plain terms, you can see where the break starts: the CI job, the sync step or the workload itself. That's a lot better than bouncing between five tools and guessing.
Use those signals to tie each failure to a specific cluster path or dependency.
Maintain a current cluster inventory and topology map
Next, document the setup that sits behind those dashboards and logs. Keep a live cluster inventory in Git, a wiki or an internal portal. At a minimum, include:
- Cluster name
- Purpose (production, staging, ephemeral test)
- Region and hosting provider
- Kubernetes version and distribution
- Key controllers and add-ons (Argo CD, Flux, ingress controller, service mesh)
- Network boundaries (VPC, VPN, peering)
- Which CI jobs or Git repositories target that cluster
Then add a topology map that shows how clusters, CI runners, GitOps controllers and shared services connect to each other, including central logging and a secrets manager. That way, an on-call engineer can look at a failed deployment and quickly see which clusters, controllers and shared services might be involved.
The best way to keep the inventory current is to generate it automatically. Query your cloud provider API or Terraform state for cluster metadata, annotate clusters with environment and owner tags, and run a nightly job that updates a central JSON or YAML file in Git. You can also query GitOps tools for registered clusters and applications, which adds live deployment relationships to the inventory.
Follow a step-by-step sequence to localise the failure
::: @figure 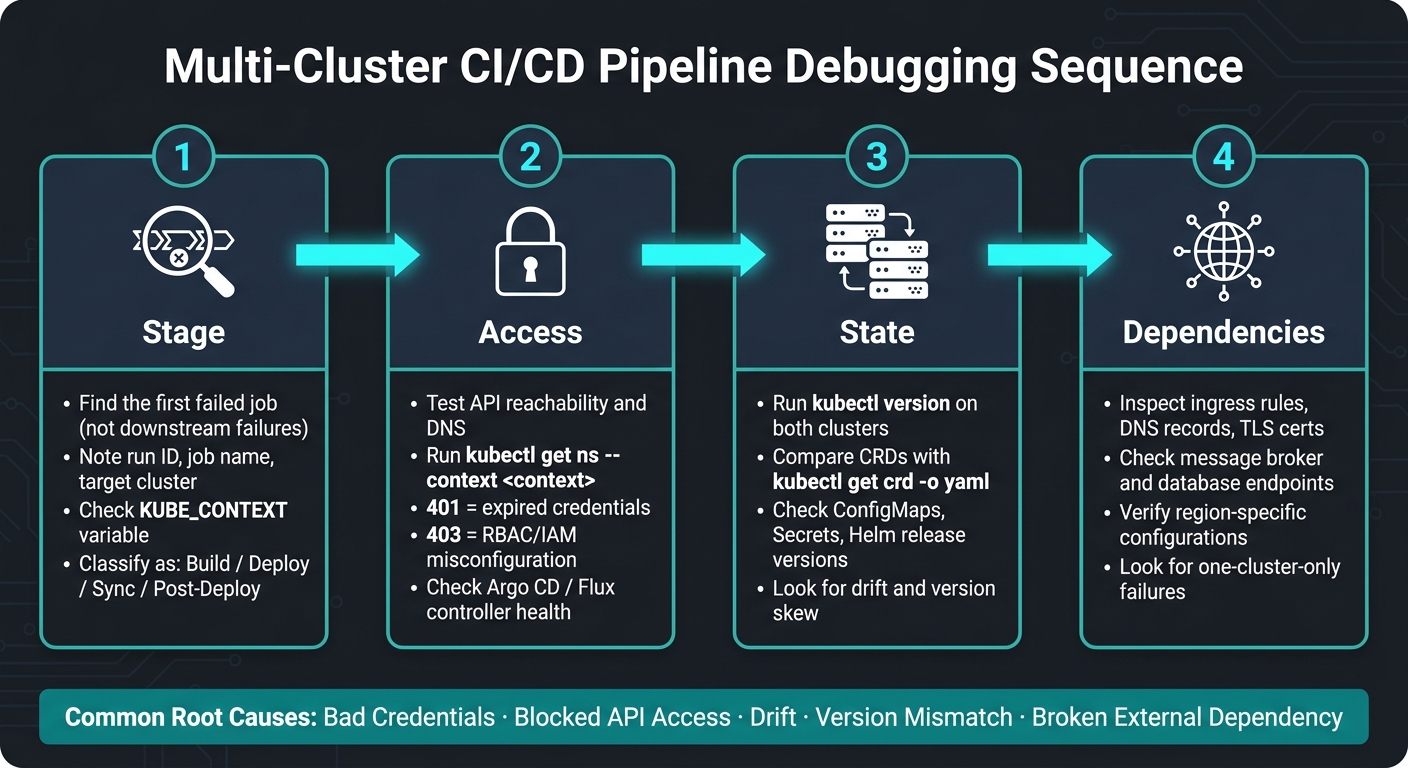 {Multi-Cluster CI/CD Pipeline Debugging: Step-by-Step Sequence}
:::
{Multi-Cluster CI/CD Pipeline Debugging: Step-by-Step Sequence}
:::
Use your observability data in a clear order: stage, access, state, then dependencies. That gives you a simple way to narrow the fault without bouncing around the stack. With the cluster and pipeline context from the previous section, you can pin down the issue in four passes.
Identify the failing stage, target cluster and deployment path
Start in the CI pipeline view and look for the first job that failed, not the later jobs that fell over because of it. That first failure usually tells you where things went off the rails.
From that job, note the run ID, job name, and target cluster. Then check variables like KUBE_CONTEXT so you can confirm exactly which cluster the job was meant to hit. After that, label the problem for what it is: build, deploy, sync, or post-deploy validation.
If the job already points to one cluster, don’t overthink it. Go straight to the access checks.
Check connectivity, credentials and controller health
Next, test whether the runner or controller can still reach the cluster API. Look at API reachability, DNS, and routing first. Then use kubectl get ns --context <your-context> to check authentication.
The response code tells you a lot:
-
401usually means the credentials have expired -
403usually means the RBAC or IAM setup is wrong
After that, check controller health with argocd app list or flux get kustomizations. If an Argo CD application is stuck on "Refreshing", the application-controller or repo-server pod may need a restart as a short-term fix. Not pretty, but sometimes that’s the fastest way to get moving again.
If access looks fine, the next step is to compare cluster state.
Compare cluster state for drift, version skew and dependency issues
Now compare the failing cluster with one where the same run worked. Use the cluster map from the previous section so you’re comparing like with like.
Start with kubectl version on both clusters to check for version skew. Then compare CRDs with kubectl get crd -o yaml. A missing CRD in the failing cluster can break sync for just one environment, which is the sort of thing that can waste hours if you don’t check it early.
From there, look at the other moving parts:
-
ConfigMaps -
Secrets - Helm release versions with
helm list - Controller image tags with
kubectl describe deployment
Then move to outside dependencies. Check ingress rules, DNS records, TLS certificates, message broker endpoints, and database connection strings. These often vary by region or environment, and that’s where odd one-cluster-only failures tend to hide.
A certificate that expired only in the
prod-ukcluster, or a message queue endpoint pointing to the wrong region, can cause post-deploy tests to fail even when the deployment itself succeeded.
Run tool-specific checks for common multi-cluster setups
Once you know which cluster is failing, stop doing broad cluster-wide checks and get more targeted. At that point, the goal is simple: identify the tool in use, confirm the controller and access path, and run checks that show the exact point of failure.
Debug Argo CD and Flux multi-cluster sync problems
For Argo CD, start with argocd cluster list and make sure the cluster shows as Successful. Then inspect the cluster Secret for stale credentials or a CA mismatch. [2][3][4] If the cluster doesn't appear at all, check that the Secret exists in the argocd namespace and has the label argocd.argoproj.io/secret-type: cluster. [5][1]
Next, use argocd admin cluster kubeconfig to export a kubeconfig from the stored Secret. From there, run kubectl commands from the application controller pod. That helps you narrow the problem down to network access, authentication, or certificates. [6]
For x509 errors, run openssl s_client and compare the API server certificate chain with the CA data stored in the cluster Secret. Also check that the API server URL matches the certificate's CN or SAN. For RBAC failures, run kubectl auth can-i get deployments --as=<serviceaccount> -n <namespace> against the target cluster. That will show whether the ServiceAccount has the permissions Argo CD needs. [2][1]
For Flux, start by checking whether resources show Ready=False. Then read .status.conditions and look for the first clear error. Run kubectl get kustomizations -A or kubectl get helmreleases -A, and follow that with kubectl describe on any resource that reports Ready=False. [7][8][9] After fixing the source, manifest, or CRD issue, run flux reconcile kustomization <name> --with-source. [10][13]
CRD mismatches are one of the trickier Flux failure modes in multi-cluster setups. Run kubectl get crds on each cluster and compare the output. The same resource may work in one cluster and fail in another. A common example is no matches for kind "HelmRelease" in version "helm.toolkit.fluxcd.io/v2beta1" in the helm-controller logs. [11][12]
If the controller looks healthy, shift your attention to the job that supplied the context and credentials.
Debug CI jobs that deploy to different clusters
Print and set the active context before every deploy step. In GitHub Actions, echo the context right after credential setup. Don't rely on default contexts in ephemeral runners. Set the context yourself with kubectl config use-context <cluster-name>, or pass a cluster-specific kubeconfig file to each job. [14][16][20][21]
In GitLab CI, run kubectl config get-contexts to confirm the expected context is there. If a context is missing or misnamed, the job can fail before deployment even starts. [17][18]
Before any write action, check that the injected credentials can do the job. A quick kubectl auth can-i create deployments -n <namespace> test will fail fast if the token is wrong or RBAC is off. [14][16]
For jobs that run inside Kubernetes - like GitLab runners, Jenkins agents, or Tekton pipelines - inspect the runner pod logs directly. Tekton keeps TaskRun and PipelineRun logs in the pod that runs the steps, so finding that pod is part of the debugging path. [15][19]
| Tool | First check | Failure signs | Fastest fix |
|---|---|---|---|
| Argo CD |
argocd cluster list + cluster Secret label |
Unknown, Unreachable, x509, RBAC errors |
Fix Secret or RBAC |
| Flux |
kubectl describe kustomization / helmrelease conditions |
Ready=False, reconciliation errors, CRD not found |
Fix source or manifests, reconcile |
| CI jobs | kubectl config current-context |
Wrong context; missing permissions; runner logs | Set context explicitly |
Prevent repeat failures and cut operational cost
Standardise clusters and add pre-deployment checks
Once you’ve found the fault, the next job is to stop it coming back. The cleanest way to do that is with a standard baseline across every cluster.
Set one version-controlled baseline with tools such as Terraform or Pulumi for infrastructure, and Helm or Kustomize for Kubernetes manifests. That baseline should cover Kubernetes version, CNI, ingress, auth, NetworkPolicies, PodSecurityStandards and namespaces. Then apply it through GitOps, so each cluster stays aligned with Git instead of being patched by hand in one place and forgotten in another. That’s what gets rid of the drift and version skew you just spent time checking.
Before any deployment starts, add a pre-flight stage to the pipeline. Keep it simple, but make it strict. At a minimum:
- Check API server reachability with
kubectl version - Confirm node readiness with
kubectl get nodes - Verify that required namespaces exist
- Validate credentials with
kubectl auth can-i
These checks fail fast before rollout, which is exactly what you want. It’s far better to stop early than let a broken deployment chew through CI time and then fail halfway through.
Write runbooks, automate drift checks and track cost impact
After an incident, turn what happened into a runbook. Don’t leave the fix buried in chat threads or someone’s memory. Link the runbook straight from your pipeline graph, your Argo CD or Flux dashboard, and your alerting tool. A good runbook starts with the symptom and ends with the fix. Use the same path each time: logs, sync status, cluster health, remediation.
Scheduled drift checks help catch the same issue before the next release. Argo CD and Flux expose sync status and out-of-sync resources through metrics and dashboards, so it’s much easier to spot repeated gaps between Git and live state. Feed those findings into your reliability backlog. If the same namespace keeps drifting, that usually points to missing IaC coverage or manual hotfixes sneaking in.
There’s also a direct cost angle here. Failed and repeated deployments aren’t just annoying - they cost money. Every aborted pipeline run burns CI minutes. Every incident that drags on can keep clusters running at higher capacity for longer than planned. Tag pipeline runs and resources so you can measure failed-run spend and build a clear £ case for putting time into standardisation and automation.
Conclusion: Key steps to fix and prevent multi-cluster pipeline failures
Debugging multi-cluster CI/CD pipelines gets much easier when you treat it as a set process instead of a scramble. Start by understanding the common failure modes: credentials, connectivity, version skew and drift. Put shared observability in place across every cluster before anything breaks.
When an issue shows up, follow a fixed localisation sequence: identify the failing stage and target cluster, check connectivity and cluster health, then compare cluster state and GitOps sync status. After that, use tool-specific checks for Argo CD, Flux or your CI jobs to pinpoint the exact failure point.
Then close the loop. Standardise clusters, add pre-deployment checks, write runbooks and automate drift detection. For UK engineering teams, that means faster releases, fewer failed deployments, and tighter control over both engineering time and infrastructure spend.
FAQs
What usually causes one cluster to fail when others pass?
Most of the time, the issue comes back to configuration drift. Clusters may have started out the same, then slowly drifted apart because of manual tweaks or uneven updates.
Other common causes include resource constraints, such as CPU or memory shortages, and environmental differences, such as mismatched Kubernetes versions, missing SDKs, or regional network latency.
How can I tell if the issue is in CI, GitOps or the cluster itself?
Check which part of the pipeline owns the failing step. CI covers builds and tests. GitOps deals with deployment and state reconciliation.
If a build or test stage fails, start with the CI logs. They usually tell you where things went off the rails.
If you spot configuration drift or a cluster state that doesn’t match what you expected, compare the live cluster with your Git repository in Argo CD or Flux.
For cluster-level issues, look at the basics first:
- CPU and memory
- Node status
- Control plane metrics
- Tracing for network, database, or service-to-service errors
What checks should I automate before deployment?
Automate pre-deployment checks so you catch problems before they hit production. That usually means setting up pre-commit hooks and linting with tools like yamllint, actionlint, and kubeval.
It also helps to run kubectl --dry-run so you can validate manifests against the cluster before anything goes live. On top of that, check dependencies and the local environment too, including tool versions and lock files. Small mismatches there can cause a surprising amount of grief.
You can add Policy-as-Code with tools such as Kyverno or OPA to enforce rules early, not at the last minute. Pair that with GitOps drift detection and automated health checks to confirm connectivity and configuration before production.