Build failures in CI/CD pipelines can disrupt releases, delay patches, and even expose systems to security risks. Fixing these issues quickly is crucial to maintaining smooth workflows and avoiding costly downtime.
Here’s how you can address and prevent build failures effectively:
- Check logs first: The last 20 lines often reveal the issue. Enable verbose logging for more details (e.g.,
ACTIONS_STEP_DEBUG=truein GitHub Actions). - Reproduce locally: Use Docker or similar tools to recreate the CI environment and test the failing steps.
- Validate configurations: Run linters like
yamllintto catch syntax errors in YAML files. Ensure all environment variables, dependencies, and lock files are correct. - Break down jobs: Split pipelines into smaller steps (e.g., Build, Test, Deploy) to isolate the problem.
- Use debugging tools: Leverage built-in CI/CD features like GitLab's
CI_DEBUG_TRACEor third-party tools for centralised logging and dependency checks.
Prevention tips:
- Commit lock files to avoid dependency mismatches.
- Standardise build environments with tools like Docker or Kubernetes manifests.
- Add pre-commit hooks to catch errors before they reach the pipeline.
- Mock external services to eliminate dependency-related failures.
UK businesses lose 8.2 hours per week per engineer due to test failures. Preventing issues upfront can save time, cut costs, and improve deployment cycles. Debugging isn't just about fixing problems - it's about ensuring your pipeline runs efficiently and reliably.
How To Debug A Failed Build Using Pipeline Logs?
Why Builds Fail in CI/CD Pipelines
Understanding why builds fail can help you diagnose issues faster and get your pipeline back on track.
Missing Dependencies or Version Mismatches
One of the most common culprits is untracked or mismatched dependencies. While local builds might rely on cached or global dependencies, CI pipelines operate in a clean environment. Without committing lock files - like package-lock.json or poetry.lock - you risk version mismatches, leading to dependency drift. These hidden dependencies, masked by local caching, become glaringly obvious in the CI environment.
Configuration Syntax Errors
Even a tiny YAML syntax error can throw a wrench into your pipeline. A misplaced space, missing colon, or incorrect indentation can cause failures that are hard to trace. Similarly, typos in secrets' names or incorrectly scoped secrets can also lead to issues. Using debug logging, such as the ACTIONS_STEP_DEBUG flag, can help uncover these configuration missteps.
Environment Inconsistencies
Local environments often rely on custom setups, caches, and global tools that hide potential issues. CI runners, on the other hand, are ephemeral and expose these gaps. For example, developers working on macOS or Windows may not encounter the same problems as CI runners, which typically run on Linux. This difference can result in issues like case-sensitive file system errors, inconsistent line endings, or mismatched system libraries. Even timezone differences can cause date-dependent tests to fail when running in CI.
Avoid using 'latest' tags for container images. Instead, pin your images to specific versions.- DevOps.com
Incorrect Build Commands
Outdated scripts, incorrect file paths, or permission errors can all block builds. Sometimes, commands reference tools that aren’t available in the CI environment or attempt to write to directories without the proper permissions. Authentication problems, such as issues with GITHUB_TOKEN, can also prevent builds from accessing protected resources.
Recognising these common pitfalls is the first step towards a more efficient debugging process, which we’ll explore next.
How to Debug Build Failures: A Step-by-Step Process
::: @figure 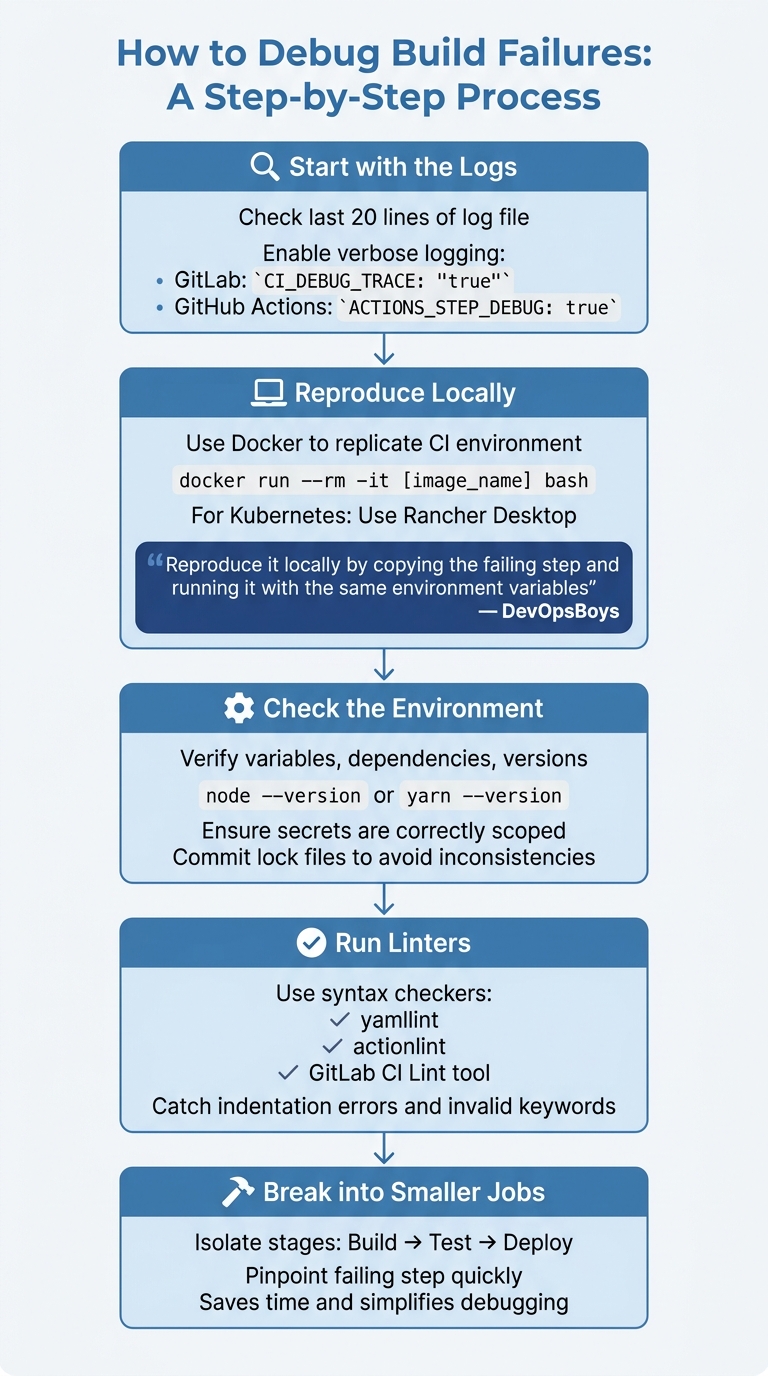 {Step-by-Step Guide to Debugging CI/CD Build Failures}
:::
{Step-by-Step Guide to Debugging CI/CD Build Failures}
:::
When tackling build failures, understanding their common causes is key to effective troubleshooting. Here's a systematic approach to guide you through the process.
Start with the logs. The last 20 lines of the log file often hold the clue to what went wrong [2]. If the issue isn't immediately clear, enable verbose logging. For instance, in GitLab, set CI_DEBUG_TRACE: "true", or in GitHub Actions, use ACTIONS_STEP_DEBUG: true [3]. This gives you a detailed view of all executed shell commands, laying the groundwork for focused debugging.
Reproduce the failure locally. This step helps rule out environment-specific issues. Using Docker, you can replicate the CI environment and manually execute build commands:
docker run --rm -it [image_name] bash
For Kubernetes-based pipelines, tools like Rancher Desktop can recreate the CI environment on your machine [3]. However, keep in mind that local setups may not always replicate issues seen on Linux CI runners [1].
As DevOpsBoys puts it:
Reproduce it locally by copying the failing step and running it with the same environment variables.- DevOpsBoys [1]
Check the environment. Verify variables, dependencies, and versions by running checks like node --version or yarn --version in the before_script section. Make sure secrets are correctly scoped to the branch or environment [1]. If you're using lock files, ensure they are committed to avoid inconsistencies [3].
Run linters to catch syntax errors. Tools like yamllint, actionlint, or GitLab's CI Lint tool can help identify issues like indentation errors or invalid keywords [3]. Even something as small as a missing colon can disrupt the entire pipeline.
If the problem persists, break the pipeline into smaller jobs. By isolating stages - such as Build, Test, or Deploy - you can pinpoint the failing step more quickly [3]. This method saves time and makes debugging far more manageable.
Tools for Debugging CI/CD Build Failures
Using the right tools can make troubleshooting CI/CD build failures much easier. While many CI/CD platforms come with built-in debugging features, third-party tools can step in to address any gaps.
Built-In CI/CD Debugging Features
GitLab includes a debug trace mode that logs every command, variable, and secret during execution. By setting CI_DEBUG_TRACE to true, you can get a detailed view of what’s happening behind the scenes [5][2]. Pairing this with detailed logging makes it even more effective. However, be cautious - this mode exposes all job secrets, so access should be tightly controlled, and debug logs should be deleted before being shared publicly [5].
GitLab also offers tools like the CI Lint and Pipeline Editor, which feature real-time syntax highlighting, code completion, and graphical visualisations of job dependencies [3]. For more complex pipelines, the Simulate pipeline creation
feature helps identify issues with keywords like needs and rules [8]. Since version 18.9, GitLab has included job log timestamps, making it easier to measure build step durations and pinpoint performance issues [6]. You can enable this feature using the FF_TIMESTAMPS variable, though it’s worth noting that this increases storage requirements by about 10% [6].
For deeper analysis, GitLab Duo Root Cause Analysis uses AI to examine failed logs and suggest fixes directly within the platform [3]. These built-in features provide a solid foundation for tackling issues, especially when failures involve multiple services.
Centralised Logging Solutions
When build failures occur across multiple environments, centralised logging tools become crucial. Grafana Loki is a lightweight choice for teams already using Grafana and working with JSON logs [7]. For those managing large volumes of logs, the ELK Stack offers advanced search and visualisation capabilities, though it requires more resources [7].
As DevOps Specialist Opaluwa Emidowojo explains:
Observability transforms troubleshooting. Instead of hunting through disconnected logs or rerunning failed builds blindly, observability gives you insight, not just data [7].
Using correlation IDs (like UUIDs) can help track a single build process across different tools and services [7]. Pair these logging tools with configuration checkers to ensure consistency across environments.
Dependency and Configuration Checkers
YAML linters such as yamllint and actionlint can catch syntax errors before execution by running pre-commit checks. These can be integrated into workflows using the pre-commit framework [1]. For Kubernetes deployments, tools like kubeval and kubectl --dry-run validate configurations before they’re applied to production [3].
Local testing tools, like gitlab-ci-local, enable developers to run GitLab CI jobs on their machines, helping debug scripts before they’re pushed [4]. These tools, combined with dependency lock files (e.g., package-lock.json, poetry.lock), ensure consistency across environments [3]. Always commit these lock files to version control to avoid unexpected issues during builds.
How to Prevent Build Failures
When it comes to build failures, prevention beats endless debugging cycles. As DevOpsBoys puts it:
The best debugging is debugging you never have to do [1].
The key lies in creating consistent environments, addressing errors early, and reducing dependence on external systems.
Standardise and Automate Build Environments
One common culprit behind build failures is environment drift - those subtle differences between development, staging, and production setups. To tackle this, adopt a build once, promote many
strategy. This ensures the same application artefact is deployed consistently across all stages [9] [10].
Tools like Terraform or Kubernetes manifests can help here. By versioning these files, you can create reproducible environments that are easy to spin up or tear down. Ephemeral testing environments and reusable pipeline templates also simplify updates and reduce errors [9] [10].
Chinmay Gaikwad from Harness highlights the importance of this approach:
Standardization is how platform teams encode the 'golden path' and keep pipelines maintainable over time [9].
Implement Pre-Commit Hooks
Pre-commit hooks are a simple yet effective way to catch issues - like YAML errors, linting problems, or formatting inconsistencies - before they even hit your pipeline. By configuring a .pre-commit-config.yaml file with tools like actionlint, you can significantly cut down on red
builds [1].
Use Mock Services for Dependency Management
External dependencies such as APIs, databases, and third-party services can introduce unpredictability into your builds. Mock services offer a solution by simulating these dependencies. This approach isolates your builds from external factors like network latency or timing issues, ensuring every run starts from a clean slate [11] [1].
Conclusion
Debugging plays a crucial role in keeping CI/CD workflows efficient. Most failures can be traced back to four main causes: infrastructure issues, configuration errors, code problems, or integration glitches [1]. Once you pinpoint the problem, the fix is often straightforward.
That said, prevention is far more impactful than reactive debugging. On average, UK businesses lose 8.2 hours per week per engineer due to CI/CD test failures [12]. This downtime slows feature rollouts and increases costs. By leveraging pre-commit hooks with tools like actionlint, standardising Docker environments, and enabling proper caching, you can significantly cut build times. For instance, optimised pipelines have shown reductions from 12 minutes to under 2 minutes [1].
As Total Shift Left aptly states:
Every failed pipeline blocks the delivery of working code, and when the failure is an environment issue rather than a real bug, that blocked deployment is pure waste [12].
For businesses operating within tight margins, eliminating this inefficiency means faster deployments and reduced infrastructure expenses. These savings highlight how proactive measures can transform CI/CD processes.
Simple steps like enabling debug logging (ACTIONS_STEP_DEBUG = true for GitHub Actions), setting timeout limits to prevent hanging jobs, and mocking external dependencies to avoid third-party disruptions can create faster feedback loops [1]. By focusing on these improvements, your team can spend more time on what truly matters: delivering high-quality, reliable code.
If pipeline failures are holding you back or you’re looking to refine your DevOps workflows, Hokstad Consulting offers tailored solutions to cut cloud costs and streamline deployment cycles.
FAQs
How do I reproduce a CI failure on my laptop?
To troubleshoot a CI failure locally, try replicating the commands or build steps in an environment that mirrors your CI setup. A common way to do this is by using a Docker container that matches your CI configuration. Start by reviewing the pipeline logs to pinpoint the specific commands that failed, then replicate them on your local machine.
For instance, if a Docker image is involved, you can launch it with:
docker run --rm -it <image-name> bash
This approach allows you to identify any environment mismatches or missing dependencies that might be causing the issue.
What should I check first when the logs are unclear?
When troubleshooting, always begin by examining the full log output, paying close attention to the last 20 lines. This is where most errors tend to surface. If the issue remains unclear, enabling debug traces or verbose logging can reveal hidden problems and give you more context to work with.
Another effective approach is to reproduce the failure locally. Use the same environment or container setup to mimic the conditions under which the error occurred. This can help you pinpoint the root cause, especially when the logs alone don't offer enough insight. These steps are essential for a thorough investigation.
How can I stop secrets leaking in debug logs?
When troubleshooting CI/CD pipelines, it's crucial to ensure sensitive secrets don't accidentally end up in debug logs. Here are some practical steps to help maintain security:
Limit Verbose Logging: Avoid enabling verbose logging that could expose all environment variables, especially sensitive ones. If debug logging is necessary, enable it temporarily and only for specific issues.
Mask Sensitive Variables: Never print or export secret variables directly into logs. Instead, use masking techniques to ensure they don't appear as plain text.
Restrict Log Access: Keep access to logs limited to authorised personnel to reduce the risk of leaks.
Secure or Delete Logs: Once logs are no longer needed, either securely store them or delete them to eliminate any lingering risks.
By following these precautions, you can troubleshoot effectively without compromising the security of your secrets.