
If I want a CI/CD pipeline to handle more work, I don’t start by adding runners. I start by measuring flow end to end. The article’s core point is simple: pipeline speed is shaped by queue wait, runner start-up, job run time, gates, and deploy limits - not just by one fast build job.
In plain terms, this means I’d focus on five things first:
- Measure the right baseline: queue depth, queue age, execution time, provisioning time, runner use, lead time, deployment frequency, and failure or retry rates.
- Map the pipeline as a DAG: run only the jobs a change needs, start jobs as soon as dependencies finish, and keep approval gates visible.
- Split runner pools and queues by job type: for example, pull requests, releases, deployments, heavy builds, image builds, and restricted jobs.
- Scale from queue signals: queue age, backlog growth, and job arrival rate tell me more than CPU charts alone.
- Tighten execution flow: shard tests by duration, build once and promote the same immutable artefact, and size CPU and memory by job class.
A simple example from the piece makes the sizing point clear: if 120 jobs arrive per hour and each job uses a runner for 10 minutes, I need about 20 concurrent runner slots just to keep up with average demand - before I add room for peaks, retries, or cold starts.
What I like about this approach is that it keeps the focus on outcomes people feel: lead time, deployment rate, failure rate, and recovery time. In other words, I’d treat CI/CD as a flow system, not just a list of build steps.
::: @figure 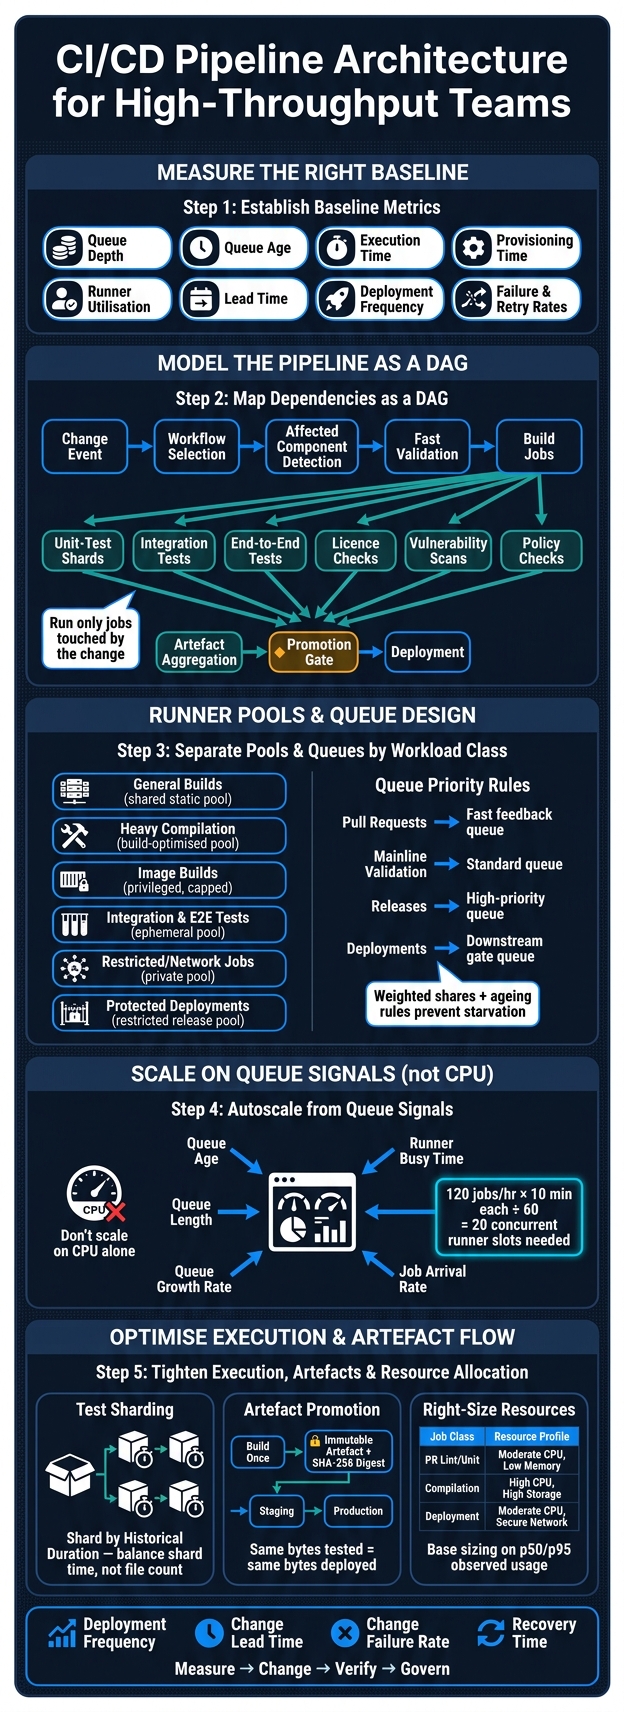 {CI/CD Pipeline Architecture: End-to-End Flow Optimization}
:::
{CI/CD Pipeline Architecture: End-to-End Flow Optimization}
:::
Building a high performant CI/CD platform through standardization - Mihir Vora & Kamlesh Vaghela
Model the pipeline as a dependency graph
Model the pipeline as a DAG, not a simple list of stages. Each job is a node. Each prerequisite is a directed edge. That means a job starts as soon as its dependencies finish, instead of waiting for an entire earlier stage to clear.
A practical flow looks like this: change event → workflow selection → affected-component detection → fast validation → build jobs → unit-test shards → integration and security checks → artefact aggregation → promotion → deployment. The key idea is simple: run only the jobs touched by the change. If a commit only affects the web application, the API and worker build jobs should stay idle unless the dependency model says they must run.
Map stages, gates and conditional paths
Running only affected jobs is the main way a graph cuts wasted work. Every job needs a clear role, plus a defined input/output contract, owner, run condition and failure outcome. Put fast, cheap checks first - formatting, linting, configuration validation and dependency checks - before anything costly starts. Build jobs come next, scoped to changed components where dependency analysis allows it.
From there, branch into parallel paths:
- unit-test shards
- integration tests
- end-to-end tests
- licence checks
- vulnerability scans
- policy checks
These paths don’t depend on one another, so they should run in parallel.
Use fan-in when one downstream job needs results from several branches. A common case is an artefact publication job waiting for all required test shards and security checks. That creates a diamond dependency: one preparation job splits into parallel work, then joins again at an aggregation or release gate. The aggregation job should show a clear pass/fail result without masking which branch or shard failed.
Conditional paths can save a lot of time, but they need to be conservative. A change to a shared API schema should trigger the schema producer, all known consumers and contract tests, even if the application files appear untouched. Keep conditional rules close to component ownership, and fall back to broader validation when dependency metadata is missing or uncertain. Manual approval gates should be explicit graph nodes with recorded owners, the approved artefact, the checked policy and a timeout, not invisible pauses in the middle of the pipeline.
That dependency map is what you use to shape runner placement and queue design.
Compare sequential, DAG and fan-out designs
The right topology depends on workload size and dependency structure.
| Topology | Dependency clarity | Latency | Failure isolation | Operational complexity | Fit for high-throughput teams |
|---|---|---|---|---|---|
| Sequential stages | High for simple workflows, but dependencies are often implicit in stage order | Highest - every stage waits for the slowest preceding stage | Low; one failure commonly blocks the entire sequence | Low initially | Suitable for small or tightly coupled pipelines, but usually inefficient at high volume |
| DAG | High when explicit job dependencies are maintained | Lower - independent jobs start as soon as prerequisites finish | Better; failures can be confined to a branch or dependency subtree | Moderate; requires graph design, observability and dependency governance | Strong default for high-throughput teams with mixed workloads |
| Fan-out/fan-in DAG | High for clearly defined parallel branches and aggregation points | Potentially lowest, limited by the slowest branch plus join overhead | Strong; individual shards or components can be retried independently | Higher; requires result aggregation, shard balancing and careful artefact naming | Best for large test suites, multi-component builds and matrix validation |
More edges and larger fan-in can create new bottlenecks. So when you change the graph, don’t judge it by job count alone. Check it against change lead time, deployment frequency, change-failure rate and failed-deployment recovery time. That’s the scorecard that matters.
Once the topology is set, the next gain usually comes from matching parallelism to runner capacity.
Separate inter-job from intra-job parallelism
These are not the same thing, and mixing them up burns capacity. Inter-job parallelism runs independent jobs across runners. Intra-job parallelism uses multiple cores or threads inside a single job. Inter-job parallelism is limited by runner capacity and queue contention. Intra-job parallelism is limited by the job’s CPU, memory and tool-level scaling.
A pipeline with ten parallel jobs may still barely improve if each job runs a single-threaded build or waits on a serial database fixture. On the other hand, increasing workers inside one job can push up memory pressure and cut total throughput if it creates runner contention. Measure job duration and utilisation before changing either layer, and identify the critical path first. Only parallelise work on the critical path. Parallelism outside the critical path doesn’t cut lead time.
This graph also shows where runner pools, queue policy and autoscaling should vary by workload class.
Design runner pools, queues and autoscaling together
Runner placement, queue design and autoscaling are one design problem. The dependency graph tells you what can run. This section is about where it runs and how fast it can grow when demand jumps.
The best way to design all three is from the same workload model. For each job class, write down its arrival rate, usual duration, CPU and memory profile, network and security needs, acceptable queue time and business priority. That gives you a working map instead of a pile of guesses.
Place runner pools by workload class and access needs
A single general-purpose pool looks simple. In practice, it often turns into a bottleneck. One long compilation or end-to-end test can sit on a runner that a short pull-request validation job needed right away.
Split pools by job type to avoid that collision. In most setups, that means separating:
- general builds
- heavy compilation
- image builds
- integration tests
- end-to-end tests
- restricted-network jobs
- protected deployments
Route jobs with explicit capability declarations such as labels, tags, node selectors, taints and tolerations. Don’t lean on implicit runner selection and hope the right job lands in the right place.
Be direct with requirements like arm64, large-memory, private-network or production-deploy. And make the default pool unable to take privileged or production-scoped work.
Data locality matters too. A runner that sits far from source mirrors, dependency caches or artefact storage may look cheaper per hour, but it can still make the pipeline slower because checkout and upload take longer.
| Runner-pool design | Startup time | Isolation | Elasticity | Maintenance burden | Best workload fit | Cost behaviour |
|---|---|---|---|---|---|---|
| Static dedicated machines | Very low when warm | High | Low | High | Predictable builds, protected deployments | Higher idle cost, predictable spend |
| Shared static pool | Very low when warm | Medium | Low to medium | Medium | General builds with steady demand | Efficient at stable utilisation; noisy-neighbour risk |
| Ephemeral cloud runners | Medium to high | High per job | High | Medium | Bursty builds, untrusted code, isolated tests | Low idle cost; startup and image-transfer costs apply |
| Kubernetes-based runners | Low to medium once nodes exist | Configurable | High | High | Large mixed fleets, containerised workloads | Efficient at scale; quota and scheduling overhead matter |
| Specialised hardware pool | Low if reserved; high if provisioned on demand | High | Low to medium | High | Arm, GPU, large-memory or platform-specific jobs | Expensive per hour; justify through utilisation or capability |
| Private or restricted-network pool | Low to medium | Very high | Medium | High | Security-sensitive builds, integration and deployment jobs | Higher baseline; often required for compliance |
Those pool boundaries shape the queue design next.
Build queues that protect critical work
Use separate queues for pull requests, mainline validation, releases and deployments. If everything shares one backlog, urgent work gets buried.
Add fair-share limits across teams and repositories so one monorepo doesn’t eat the whole fleet. Then mix priority with ageing rules. A strict priority queue can leave lower-priority work waiting forever. Plain first-in-first-out has the opposite problem: an urgent release can get stuck behind a mountain of older test jobs.
Weighted shares plus an ageing rule work better. Jobs still have priority, but waiting time slowly increases a job’s effective priority. That keeps the queue moving without letting one class dominate forever.
Treat deployment queues as downstream gates, not as a generic backlog. If a queue stays long even when runners are free, the bottleneck is often queue wait, environment wait or execution delay. Extra runners only help with the first case. They won’t fix a serial dependency, a protected environment lock or a downstream system whose throughput is below the pipeline’s arrival rate.
That queue model should drive autoscaling thresholds, not the other way round.
Scale on queue signals, not guesswork
Don’t scale on CPU alone. Low CPU use doesn’t mean there’s spare capacity. The scheduler may still have no eligible runner for the jobs that are waiting.
Scale from queue signals instead:
- queue age
- queue length
- queue growth rate
- runner busy time
- job arrival rate
Autoscaling is a resource-allocation decision, not a CPU-efficiency exercise.
Set pool and account quotas, and alert on rejected scale-up operations and quota headroom, not just average utilisation. If scale-up fails because of limits, a tidy CPU chart won’t help you.
| Capacity strategy | Responsiveness | Predictability | Idle cost | Operational complexity | Fit for bursty demand |
|---|---|---|---|---|---|
| Static capacity | Excellent while spare runners exist; poor after saturation | High | High during quiet periods | Low to medium | Poor unless heavily overprovisioned |
| Scheduled capacity | Good for known windows; weak for unexpected bursts | High for predictable demand | Medium; capacity may be idle outside windows | Medium | Medium |
| Queue-based autoscaling | Depends on startup time and thresholds | Medium; requires tuning | Low to medium | Medium to high | Strong |
| Kubernetes-based elastic capacity | Strong after node and image startup; weaker when quotas or nodes are unavailable | Medium | Low to medium | High | Strong for containerised, heterogeneous workloads |
Keep some warm capacity for short feedback targets and protected deployments. Once capacity matches demand, the next wins usually come from test sharding, artefact promotion and job sizing.
Optimise execution, artefact flow and resource allocation
Once runner pools, queues and autoscaling are set up, the next gains come from how work moves inside those pools. Three things matter most: how much work you run in parallel, how artefacts move between stages, and whether each job gets the right amount of compute.
Increase safe parallelism and shard tests by duration
After runner supply is sorted, start with the critical path. Use the DAG to run only work that is genuinely independent in parallel. Keep jobs in serial order only where order matters: migrations, shared mutable test environments, integration dependencies, approval gates and production deploys. In practice, only a small number of steps need strict sequencing.
More parallelism only helps when it shortens the critical path. So put parallel effort into stages that sit on that path, not everywhere at once. [2]
File-count sharding is the easy starting point. But duration-based sharding usually does a better job of balancing long-running tests. Historical-duration sharding takes the longest tests and assigns them to the shortest shard first, using timings from the last several successful runs. Rework shard assignments after major test additions, framework changes or steady timing drift. And for tests with no history yet, use a fallback duration.
| Sharding method | How it assigns work | Strengths | Limitations |
|---|---|---|---|
| File-based | Splits by file, directory or package | Simple and predictable | Uneven when files contain tests with very different runtimes; suitable as an initial baseline |
| Historical-duration | Uses recent execution timings to equalise expected shard duration | Better balance for stable suites | Requires reliable timing data and periodic rebalancing |
| Runtime-based | A coordinator assigns the next test to the least-loaded worker during the run | Handles unpredictable durations well | Needs coordination infrastructure and shared reporting |
| Dynamic partitioning | Generates partitions from current inventory, metadata or changed-code scope | Adapts to variable suites and monorepos | More complex; partitioning rules must be observable to stay consistent |
Sharded and matrixed suites also need separate handling for unstable tests. Put known flaky tests in a quarantine lane with their own retry budget. Retries must not bury the first failure - that first failure should still show up in the aggregated report.
Each shard should publish machine-readable results, logs, screenshots, coverage and diagnostics under names that won't clash. Then a small final aggregation job can merge everything, deduplicate retries, keep the first failure visible, and fail if any required shard failed or timed out.
Use matrix execution only when the same job actually needs checking across a bounded set of meaningful dimensions, such as supported Python versions, operating systems, database engines or CPU architectures. A smoke matrix is usually enough for pull requests. Run the full matrix on scheduled or release workflows. Before you add more cells, measure what each extra one finds against the queue delay and cost it adds.
Build once, promote the same artefact
Artefact discipline matters just as much as run speed. Build once, deploy many: use immutable artefacts, unique version IDs and externalised configuration. [9] Environment-specific configuration, credentials and endpoints should be injected at deployment time, not baked into separate builds. That way, the bytes tested in staging are the same bytes deployed to production. Rollback becomes dependable, and audit trails mean something.
Reference containers by their SHA-256 content digest instead of a mutable tag like latest. [3] When the software changes, produce a new build. Do not alter existing artefacts.
| Type | Purpose | Retention | Invalidation rule |
|---|---|---|---|
| Dependency cache | Downloaded packages and package-manager data | Short; expire aggressively | Lockfile, OS image or runtime version change |
| Build cache | Compiled intermediates and incremental build state | Short to medium | Toolchain, compiler version or build config change |
| Container-layer cache | Reusable image layers | Medium | Base image update or layer content change |
| Test-result artefact | Reports, logs, screenshots and coverage | Long enough to investigate regressions | Not invalidated; retained per run |
| Release package | Deployable binary, image, chart or bundle | Per operational, contractual or regulatory need | Not overwritten; new build produces a new version |
| Deployment manifest | Versioned instructions referencing the release digest | Tied to release package retention | Updated only when a new release is promoted |
| Provenance record | Commit, toolchain, dependency, builder and signing metadata | Same as release package | Immutable once published |
Caches stop you downloading the same things again and again. Artefacts, by contrast, are outputs produced by jobs and stored so later jobs can fetch them. [7][8]
Cache keys should include the OS, architecture, toolchain version and dependency lockfile. If a stale cache leads to a wrong build, that's both a reliability problem and a security problem. Cache correctness matters more than chasing a high hit rate. [5][6]
If network transfer is the bottleneck, store artefacts close to runners. Use encryption in transit and at rest, lock down publication and promotion permissions, and remove stale or unreferenced cache entries on their own.
Allocate CPU, memory and spend by job class
Once artefacts are stable, size each job class to fit the work it does. Right-sizing means matching resources to workload, not matching budget to guesswork. Base requests on observed p50 and p95 usage, not estimates, and set limits so one job cannot drain a whole runner.
| Workload | Latency objective | Resource profile | Runner pool | Concurrency limit | Scaling policy | Cost-control rule |
|---|---|---|---|---|---|---|
| Pull-request lint, unit and static checks | Fast feedback, typically minutes | Moderate CPU, low-to-moderate memory, fast local storage | Warm general-purpose pool | High but capped per repository | Scale on runnable queue and wait-time percentile | Keep a small warm pool; cancel superseded commits |
| Large unit or integration-test shards | Complete the validation stage quickly | High CPU, higher memory, isolated network and storage | Ephemeral test pool | Based on suite and environment capacity | Queue-based horizontal scaling | Use interruptible capacity only when retries are safe |
| Compilation and packaging | Predictable build completion | High CPU, high local or ephemeral storage, dependency-cache access | Build-optimised pool | Moderate; avoid duplicate builds | Scale on queue age and build demand | Cache dependencies and compiled intermediates |
| Container image builds | Fast publication with reproducibility | High CPU, substantial disk and network bandwidth | Image-build pool with controlled privileged access | Capped by registry and network limits | Scale cautiously on queue depth | Reuse verified layers; clean stale layers |
| Release and deployment promotion | Reliability and control over minimum latency | Moderate CPU, secure network access | Restricted release pool | Low | Keep warm capacity; do not rely solely on scale-from-zero | Prioritise reliability over lowest unit cost |
| Nightly regression, fuzzing and benchmarks | High volume, flexible completion time | Variable CPU, memory and storage | Batch or interruptible pool | High but quota-controlled | Scheduled plus queue-based scaling | Use lower-cost interruptible capacity and retry-safe jobs |
Warm capacity fits pull-request validation and release promotion, where cold-start time takes a noticeable bite out of lead time. Ephemeral capacity works well for bursty or isolated workloads. Interruptible capacity makes sense for retry-safe scheduled work - nightly regression, compatibility matrices and non-blocking benchmarks - but not for a non-retryable migration or final release promotion. [4]
Every optimisation should tie back to a measurable outcome in £. If the time saved does not justify the extra spend, use a cheaper pool or lower concurrency.
Track at least:
- Queue time by runner pool and priority
- Job and critical-path duration
- Concurrency and runner utilisation
- Cache-hit ratio and cache-transfer time
- Shard imbalance, flake rate and retry volume
- Artefact-transfer time and storage volume
- Cost per pipeline, per successful deployment and per pull request in £
- Cost of idle warm capacity versus cold-start delay
Operate, tune and govern the pipeline
Use observability to find the real bottleneck
Start with the baseline metrics from the opening section and use them to find the slowest part of the system. A pipeline can look fine at job level while the actual delay sits in queueing, provisioning or approval gates. The point here is to diagnose the graph, queue and runner setup described earlier, not just the jobs themselves.
Split all measurements by repository, branch, workload class, runner pool, priority and stage. Then break end-to-end lead time into parts:
- arrival-to-queue time
- queue wait
- runner provisioning
- execution
- artefact transfer
- approval
- deployment intervals
Track each part on its own. Watch p50 and p95 for every segment, because averages smooth over the slow runs that people feel most. Your dashboards should also let you drill down from deployment to commit, pipeline, stage, job, runner, cache and artefact events. That makes it far easier to see whether the constraint sits in the graph, the queue, the runners or the artefacts.
The table below links common symptoms to likely causes and possible fixes. Treat it as a starting point, not a final checklist.
| Symptom | Likely cause | Evidence to inspect | Architectural remedy |
|---|---|---|---|
| High queue wait but short execution time | Too few runners, poor pool separation or unfair scheduling | Queue time by pool, job-class backlog, concurrency limits and arrival rate | Add capacity to the affected pool, introduce priority-aware queues or separate critical and batch workloads |
| Long provisioning time | Slow image pulls, cold-start-heavy autoscaling or insufficient warm capacity | Provisioning duration, image size, node-start logs and scale-out events | Use leaner images, pre-pull dependencies, maintain a warm floor and scale on backlog and wait-time signals |
| High runner utilisation with rising lead time | Saturated workers and contention for CPU, memory, disk or network | Resource pressure, throttling, I/O wait and queue growth | Increase pool capacity, right-size runners or split resource-intensive jobs into a dedicated pool |
| Low utilisation but long queue wait | Incorrect labels, unavailable specialised runners or scheduling constraints | Pending-job reasons, runner labels, placement rules and idle capacity by pool | Correct routing constraints, consolidate fragmented pools or reserve capacity for specialised jobs |
| Large test-shard duration variance | Uneven test distribution, setup overhead or serial fixtures | Per-shard duration, test count, historical variance and retry data | Shard by historical duration, rebalance periodically and isolate expensive integration tests |
| Low cache hit rate | Unstable keys, broad invalidation or non-persistent cache storage | Hit/miss rate, key cardinality, cache size and restore time | Use dependency-aware keys, bounded retention and local or regional cache tiers |
| Slow artefact transfer | Oversized artefacts, repeated rebuilding or distant storage | Upload/download time, artefact size, storage location and duplicate hashes | Build once, retain immutable artefacts, compress selectively and place storage near runners |
| High cancellation or retry rate | Superseded commits, flaky tests, transient infrastructure or aggressive time-outs | Cancellation reason, retry classification, failure signature and affected job | Cancel obsolete work deliberately, quarantine flaky tests and distinguish infrastructure retries from product failures |
| Deployment lead time rises despite faster builds | Approval, environment locks or deployment capacity is the bottleneck | Time spent awaiting approval, environment locks, rollout duration and change windows | Automate low-risk approval gates, increase environment concurrency and make deployment capacity visible |
Alert on sustained trends, not one bad run. For example, if p95 queue wait breaches your service objective for several intervals in a row, that deserves attention. A single slow pipeline often does not.
Roll out changes in a practical sequence
Once you know where the bottleneck is, change one layer at a time. If you alter scheduling, caching and test topology all at once, you won't know what helped and what made things worse. Roll changes out by job class and pool, not across the whole platform in one sweep.
Begin with a baseline for throughput, lead time, reliability, resource use and cost by workload class. After that, split pools and queues where contention matters. Remove serial stages that do not need to exist. Add caching, or fix it, and check that it still behaves correctly. Apply duration-aware test sharding and watch for imbalance. Set rules for immutable artefacts. Add queue-aware autoscaling with warm capacity and spend caps. Then put dashboards, ownership and peak-demand load tests in place.
Before any broader release, verify the change under peak load. Use canary pools or roll out to a percentage of repositories for material changes. And always keep a rollback path. That one habit saves a lot of pain.
Conclusion: the design rules that keep throughput high
The right architecture is the one whose measured behaviour matches your workload, risk tolerance, latency objectives and budget. The loop is simple: measure → change → verify → govern. DORA's measures still work well as outcome indicators: deployment frequency and change lead time describe delivery throughput, while change-failure rate and failed-deployment recovery time describe delivery stability.[1]
Govern the system with the same care you use to design it. Give clear ownership to each runner pool, shared cache, artefact store and deployment environment. Keep pipeline definitions, queue policies, concurrency limits and retention rules in version control. Review performance and cost on a regular cadence, and keep a clear incident process for pipeline-wide failures. Pair every speed metric with a quality metric. A faster pipeline that skips controls or trims test coverage doesn't remove cost; it just pushes it downstream.
In practice, that means defining throughput with measurable flow and stability, modelling dependencies before adding workers, separating pools and queues by workload and trust boundary, scaling from queue signals, sharding by historical duration, promoting immutable artefacts, sizing resources to service objectives, and treating ownership, security, budgets and change control as part of the architecture itself.
FAQs
How do I find the real bottleneck in a CI/CD pipeline?
Move past guesswork and start with a baseline of at least two weeks of data. Track build duration, stage execution times, queue times, and resource use like CPU, memory, and network throughput.
Pay close attention to resource contention. This can show up when parallel jobs compete for a limited number of database connections or network ports. Also flag queue times above two minutes.
Then match those metrics with runtime telemetry and review job volume and failure-rate trends. That helps you tell the difference between a short-lived spike and a deeper efficiency problem.
When should I split runner pools and queues?
Consider splitting runner pools and queues when you need to isolate workloads, deal with specific resource needs, or stop one service from slowing everything else down.
Separate pipelines for microservices help keep one service from holding up the rest. If one service fails or suddenly gets a spike in activity, the others can keep moving.
A good rule of thumb: if jobs often wait more than two minutes for an executor, your pool is probably underpowered. At that point, you may need horizontal scaling, queue segmentation, or both.
How much warm capacity should a high-throughput team keep?
Avoid keeping too much idle capacity. Use auto-scaling runners so capacity moves with demand, and watch queue times to see whether your setup is the right size.
If jobs often wait more than two minutes for an executor, capacity is probably too low. Use baseline metrics from at least two weeks to set scaling rules. Then scale down during off-peak hours or at weekends to balance performance and cost.