
Cloud-native environments, like Kubernetes and microservices, bring unique challenges to monitoring systems due to their dynamic and distributed nature. Achieving zero downtime requires addressing issues such as overwhelming data volumes, fragmented telemetry, and alert fatigue. Here's a quick breakdown:
- Dynamic Scaling: Resources like pods and containers appear/disappear rapidly, making monitoring difficult. Autoscaling can misinterpret spikes, leading to unnecessary scaling or hidden failures.
- Excessive Data: Large clusters generate massive telemetry data, overwhelming traditional monitoring tools and increasing costs.
- Microservices Complexity: Tracing issues across interconnected services is time-consuming, slowing down problem resolution.
- Alert Fatigue: Over-alerting causes engineers to ignore critical warnings, increasing the risk of downtime.
- Data Fragmentation: Metrics, logs, and traces stored separately make unified analysis difficult, inflating costs and complicating incident resolution.
Solutions include: auto-discovery tools, AI-driven anomaly detection, distributed tracing, context-aware alerts, and centralised data standards. These strategies ensure monitoring systems do more than just track issues - they help prevent them. With downtime costs often exceeding £230,000 per hour, integrating monitoring into deployment pipelines, using tools like service meshes and OpenTelemetry, is essential for maintaining reliability.
Chronosphere | Cloud-Native Monitoring at Scale
Need help optimizing your cloud costs?
Get expert advice on how to reduce your cloud expenses without sacrificing performance.
Main Challenges in Cloud-Native Monitoring
::: @figure 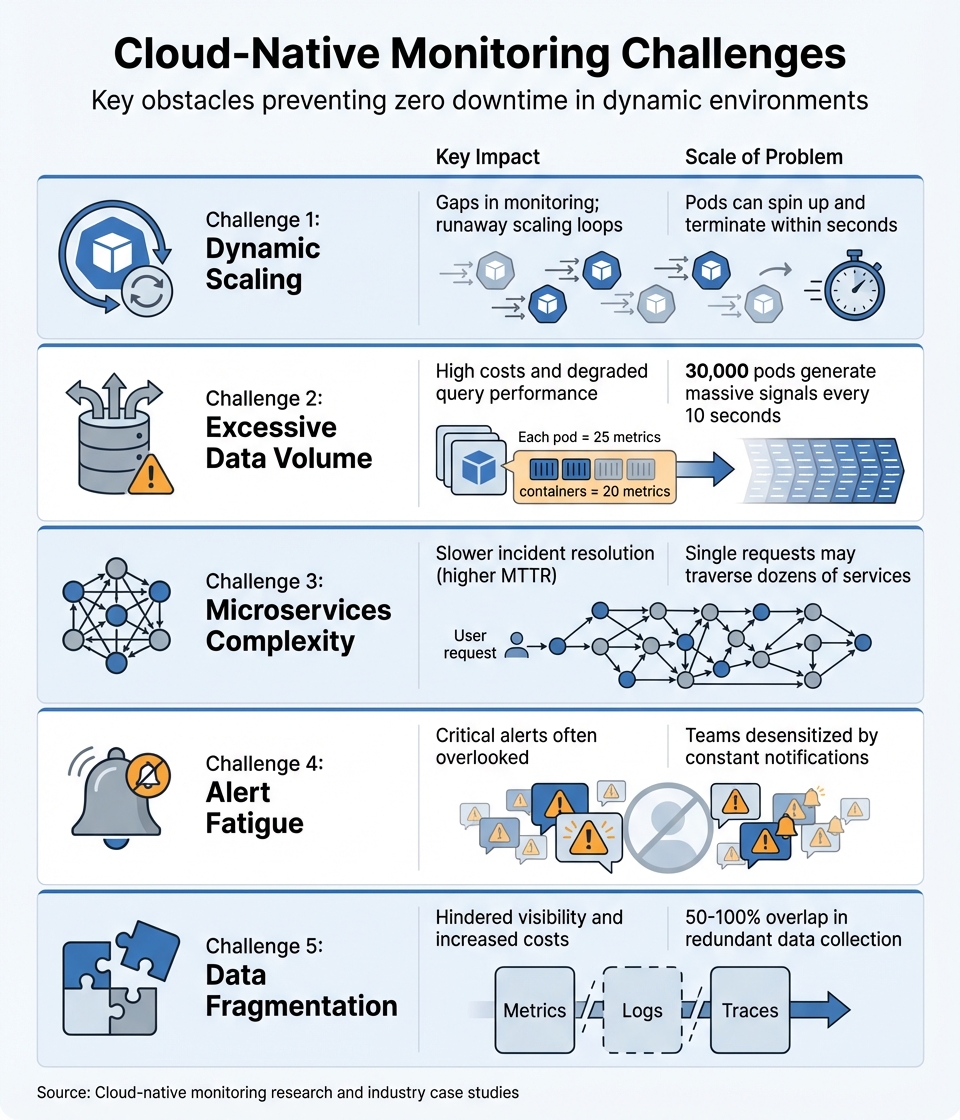 {5 Key Cloud-Native Monitoring Challenges: Impact and Scale}
:::
{5 Key Cloud-Native Monitoring Challenges: Impact and Scale}
:::
Navigating the world of cloud-native monitoring comes with its fair share of hurdles. The dynamic and distributed nature of these systems introduces both technical and systemic obstacles. Below are five key issues that make achieving zero downtime a daunting task.
Dynamic Scaling and Auto-Scaling Issues
In cloud-native environments, resources like Kubernetes pods and containers appear and disappear at lightning speed - often faster than monitoring systems can keep up. Instead of being upgraded, these resources are frequently destroyed and rebuilt. This creates a problem where the context of metrics can disappear just as quickly as the pod or container that generated them [1][3]. As Lydia Parziale and Zach Burns aptly put it:
A container that spun up just a second ago could be terminated before teams get a chance to observe it [5].
Auto-scaling can further complicate matters. For instance, Kubernetes Horizontal Pod Autoscaler (KHPA) might misread normal spikes, such as the CPU surge during the startup of Java Spring applications, as signs of overload. This can trigger a runaway scaling loop, creating unnecessary replicas [7]. Even worse, some failures can be hidden entirely - like when a front-end service catches a downstream error and returns an HTTP 200 success code, masking the problem from monitoring tools [7].
These rapid changes and misinterpretations only add to the already overwhelming data flow.
Excessive Data Volume
The sheer amount of telemetry data generated in cloud-native setups is staggering. Each pod exposes about 25 metrics, with containers adding another 20 [1]. In a cluster of 30,000 pods, data collection every 10 seconds quickly becomes a monumental task. This isn't just a storage issue - it also affects costs and performance.
Take Tesla, for example. The company struggled with Prometheus, which couldn't handle the billions of unique time series generated by high-cardinality data. After switching to a ClickHouse-based platform, Tesla managed to process over a quadrillion rows of telemetry data during an 11-day load test in 2026 [3]. Additionally, unsampled traces can be five times larger than logs [10], and transferring observability data across multi-cloud systems can inflate costs by up to 500x due to network and egress fees [6]. Traditional time-series databases often buckle under the pressure of millions of unique identifiers, leading to high memory usage, sluggish queries, and even crashes [3][4].
But data volume is just one piece of the puzzle - interconnected services bring their own set of challenges.
Microservices Complexity and Service Dependencies
Microservices add another layer of difficulty. A single request might pass through dozens of services, making it hard to trace the root cause of an issue. This often forces engineers to juggle multiple tools, increasing the time it takes to resolve problems (MTTR) [3][8]. Furthermore, the health of internal network communications - used for synchronisation and checks - becomes critical yet difficult to monitor.
In 2026, Didi, a global logistics company, tackled this issue by migrating its logging and tracing solution from Elasticsearch to a columnar database. This move cut hardware costs by over 30% and improved query speeds by four times, enabling quicker incident responses [3].
These operational challenges are further compounded by an avalanche of alerts.
Alert Fatigue and False Alarms
Too many alerts can backfire. When teams are bombarded with constant warnings, they tend to pay less attention to each one. This alert fatigue
becomes especially risky during high-stakes deployments. Rob Ewaschuk from Google SRE highlights the human toll:
Every time the pager goes off, I should be able to react with a sense of urgency. I can only react with a sense of urgency a few times a day before I become fatigued [2].
The root of the problem often lies in how alerts are triggered. Many monitoring systems rely on internal metrics, like high CPU usage on a single pod, rather than focusing on user-facing issues, such as API latency exceeding service-level objectives. As a result, even minor fluctuations can flood teams with notifications, leading them to ignore critical warnings that could signal downtime [9].
But the challenges don't stop there - how data is stored and managed also plays a big role.
Fragmented Data and Inconsistent Standards
Data fragmentation makes incident resolution even harder. Metrics, logs, and traces are often stored separately, preventing unified analysis and driving up costs through redundant data collection [3]. In fact, organisations frequently encounter a 50% to 100% overlap in data collection across different teams and tools, which inflates storage expenses [6]. Inconsistent labelling across cloud components further complicates cross-service correlation and automated root-cause analysis [9]. These issues stem from the fact that legacy storage systems weren't designed to handle the scale and complexity of modern telemetry environments [3].
| Challenge | Key Impact | Scale of Problem |
|---|---|---|
| Dynamic Scaling | Gaps in monitoring; runaway scaling loops | Pods can spin up and terminate within seconds [5] |
| Data Volume | High costs and degraded query performance | 30,000 pods generate massive signals every 10 seconds [1] |
| Microservices Complexity | Slower incident resolution (higher MTTR) | Single requests may traverse dozens of services [3][8] |
| Alert Fatigue | Critical alerts often overlooked | Teams desensitised by constant notifications [2] |
| Data Fragmentation | Hindered visibility and increased costs | 50–100% overlap in redundant data collection [6] |
Solutions for Cloud-Native Monitoring Challenges
Addressing the challenges of cloud-native monitoring involves combining automation, advanced tools, and standardised practices. These approaches are already helping organisations achieve better outcomes.
Using Auto-Discovery and Service Meshes
Auto-discovery tools can automatically detect and monitor containers as they are created or removed, keeping pace with the dynamic nature of cloud-native environments [9]. Service meshes take this a step further by using sidecar proxies to capture all traffic. As Google Cloud Service Mesh explains:
With this system [sidecar proxies], service developers don't have to instrument their code to collect telemetry data [11].
These proxies collect key metrics - like latency, traffic, and errors - without requiring changes to the application. Tools such as OpenTelemetry's k8sattributes integrate Kubernetes metadata into metrics and traces, ensuring visibility remains intact even in high-churn scenarios. Service meshes also generate automated topology graphs, making it easier to visualise microservice interactions and troubleshoot issues. Deploying the OpenTelemetry Collector as a DaemonSet ensures telemetry is collected across all nodes [12]. Once automated detection is in place, AI-driven systems can refine monitoring further.
Applying AI for Anomaly Detection
Artificial intelligence is revolutionising how teams handle large datasets and filter out irrelevant information. Modern systems use ensemble models to flag anomalies only when there's full consensus, cutting false positives by 99% [13]. This eliminates the need for manually setting countless static thresholds.
Real-world examples highlight the impact of AI-driven monitoring. Codyas reduced its monitoring team size by 67% and operational costs by 46% [13]. Similarly, the Falkland Islands Government cut website downtime by 99% and reduced cloud spending by 30% using real-time AI alerts. Nodecraft engineers slashed incident resolution times from 2–3 minutes to just 30 seconds by leveraging AI for troubleshooting [13].
AI tools, like Anomaly Advisor
, surface the most relevant metrics during incidents, helping teams pinpoint root causes without manual effort. Machine learning models can even predict failures and trigger preventive actions before downtime occurs [15]. To manage resource usage, ML training can be offloaded to specific nodes, while edge detection keeps CPU overhead minimal at under 5% [13].
Using Distributed Tracing and Service Maps
In complex environments where a single request might pass through dozens of microservices, distributed tracing is crucial for identifying failures. Tools like OpenTelemetry and Jaeger track requests across services, capturing timing and context at each step. For instance, Shopee implemented a large-scale distributed tracing system using ClickHouse, gaining real-time insights into system performance and quickly resolving bottlenecks [3].
Service maps complement tracing by visualising dependencies and traffic flows between components. Structured logging, which includes trace and span IDs, allows engineers to instantly connect events to traces [9]. Prometheus exemplars further improve this process by enabling engineers to jump directly from a metric spike to a corresponding trace, bridging the gap between symptoms and root causes [9].
Setting Up Context-Aware Alerts
Shifting alerts from internal metrics to user-facing SLOs, such as API latency thresholds, can speed up incident resolution by as much as 80% [11][13]. Combining AI anomaly detection with SLO-based thresholds ensures alerts are tied to business impact. Unsupervised machine learning models trained on normal infrastructure behaviour help ensure that only genuine deviations trigger alerts.
Centralising Data with Open Standards
Centralising telemetry simplifies analysis and enhances the benefits of automated discovery, AI detection, and distributed tracing. Fragmented data - where metrics, logs, and traces are scattered across systems - can make incident resolution more difficult. Adopting OpenTelemetry (OTel), a vendor-neutral standard, helps unify telemetry and avoids vendor lock-in [14]. Arup Malakar from Sierra explains:
It would be really cool if we no longer thought of observability and analytics as two different islands, but just one data problem, powered by a really good compute engine [3].
Tesla used ClickHouse to build its monitoring platform, processing over a quadrillion rows in just 11 days [3]. Similarly, Didi's migration from Elasticsearch to ClickHouse reduced hardware costs by over 30% and improved query speeds by four times [3].
Standardised labels - such as service, environment, region, version, and team - make cross-service analysis more effective. Deploying the OpenTelemetry Collector as a central gateway streamlines data collection, while storing monitoring configurations in Git and managing alert rules via CI/CD pipelines ensures consistency. Managing high-cardinality labels by aggregating or dropping unnecessary ones helps maintain system performance.
For organisations struggling with fragmented data and inconsistent visibility, Hokstad Consulting offers custom solutions to consolidate telemetry and implement OpenTelemetry standards across infrastructures.
Connecting Monitoring with Zero Downtime Deployments
Monitoring plays a crucial role in avoiding downtime during deployments by validating new code in real time. Techniques like blue-green and canary deployments rely on real-time health signals to ensure code changes are safe. Tools such as Istio and Consul, which manage service meshes, help direct traffic flow and capture distributed traces. This allows teams to see how new versions behave under actual conditions [16][17]. By combining these tools with monitoring, teams can set the stage for automation that keeps downtime at bay.
Downtime can be incredibly expensive - companies report losses reaching several million pounds per hour. A staggering 90% of businesses cite costs exceeding £230,000 per hour, with 41% estimating losses between £770,000 and £3.8 million [18]. To minimise this risk, automated rollbacks and intelligent testing are indispensable during deployments. Automated rollbacks monitor metrics like error rates, latency, and throughput. If these metrics cross predefined thresholds, the CI/CD pipeline can instantly redirect traffic - such as reverting a Kubernetes Service selector to the previous version - without requiring manual intervention [18][19].
Pre-stop hooks are another useful feature, delaying shutdowns to give service meshes time to drain traffic and avoid 503 errors during updates [17]. Before completing a blue-green traffic switch, teams can use kubectl port-forward to run smoke tests directly on the new deployment. This ensures everything works as expected before users are impacted [19]. For database updates, the expand/contract pattern ensures that schemas remain compatible with both old and new application versions, reducing the risk of deployment failures [18].
Monitoring systems can also trigger automated rollbacks based on error rates, latency, or throughput. Additionally, REST APIs enable maintenance mode during updates, which suppresses unnecessary alerts while still gathering performance data. This ensures monitoring systems remain accurate without overwhelming teams with irrelevant notifications [20].
Custom Automation for Integrated Monitoring in Deployments
While standard deployment tools offer basic health checks, many organisations need customised solutions to fully integrate monitoring into their deployment pipelines. For example, Hokstad Consulting creates bespoke automation that validates system health at every stage of deployment. This includes configuring service mesh observability, setting up rollback triggers based on Service Level Objective (SLO) violations, and ensuring monitoring data actively informs deployment decisions. These tailored approaches help maintain zero downtime, even during complex updates involving multiple services.
Conclusion
Achieving zero downtime in cloud-native environments hinges on tackling some tough monitoring challenges: dynamic infrastructures, overwhelming data volumes, fragmented information, and alert fatigue. To address these, organisations need proactive and integrated monitoring solutions. The strategies discussed earlier - such as auto-discovery, AI-powered anomaly detection, distributed tracing, context-aware alerts, and centralised data standards - are designed to meet these needs. Pairing these with deployment methods like blue-green and canary releases helps monitoring systems shift from merely reporting problems to actively preventing them.
The stakes are high - 90% of companies report losses exceeding £230,000 per hour during downtime, and 41% face losses surpassing £770,000 per hour [18]. This makes effective monitoring a business-critical priority. While standard tools are helpful, tailored solutions go a step further. For example, Hokstad Consulting creates bespoke systems that integrate monitoring into every stage of deployment. Their automation processes validate system health during updates, enable service mesh observability, and trigger intelligent rollbacks when SLOs are breached. These measures ensure that monitoring not only tracks system performance but also actively supports decision-making, keeping downtime at bay - even during complex, multi-service rollouts.
FAQs
What should I monitor to achieve zero downtime?
To maintain zero downtime, keep a close eye on real-time performance metrics such as response times, error rates, CPU usage, and throughput. Use synthetic transactions and regular health checks to monitor system health, while also considering business metrics and user experience data for a broader perspective. Make sure your alert systems are reliable and prompt, enabling swift action when incidents occur.
How can we reduce observability data costs without losing visibility?
Reducing the costs of observability data while keeping visibility intact means focusing on smarter ways to handle data collection, storage, and analysis. Start by filtering telemetry data right at the source - this ensures you’re only ingesting logs, metrics, and traces that actually matter. Clear alert thresholds can also prevent unnecessary data collection.
For storage, consider a tiered approach. This allows you to store high-priority data in faster, more expensive systems, while less critical data can sit in cost-effective, slower storage. Finally, automate cost monitoring to quickly spot and address inefficiencies. These steps make it possible to maintain vital insights without overspending.
How can we prevent alert fatigue while still identifying real incidents?
Reducing alert fatigue while ensuring genuine incidents are caught requires a focus on cutting down unnecessary noise and improving the relevance of alerts. Start by using historical data to establish precise thresholds, which can help avoid triggering alerts for minor fluctuations. Prioritising alerts through proper tiering ensures that the most critical issues are addressed first. Adding context to alerts can further highlight their importance, making it easier for teams to assess the situation quickly.
Leveraging automation and AI-driven tools can also play a key role. These technologies help filter out false positives, ensuring teams only see alerts that require action. This streamlined approach allows for faster and more effective responses to real incidents.