
Cloud cost management is all about making your spending work smarter, not harder. By using Key Performance Indicators (KPIs), businesses can track costs effectively, link them to actual business value, and identify wasteful spending. Here’s the gist:
- Focus on Business Value: Instead of just tracking total spend, monitor metrics like cost per subscriber or transaction to tie expenses to outcomes.
- Efficiency is Key: Identify underused resources (e.g., idle servers or unnecessary storage) and optimise them to cut waste - up to 30% of cloud spend is typically wasted.
- Accountability Through Metrics: Assign cost-related KPIs to teams (e.g., tagging coverage or cost allocation) to drive ownership and improve decision-making.
- Forecast and Budget Accurately: Aim for a budget variance of under 10% by combining historical data with predictive models.
- Automate Tracking: Use tools like AWS Cost and Usage Reports, tagging policies, and dashboards to monitor and enforce KPIs in real time.
The key takeaway? Start small with a few actionable KPIs, align them with your business goals, and refine them as your organisation evolves. This approach can reduce cloud costs by 15–30% while improving financial clarity.
::: @figure 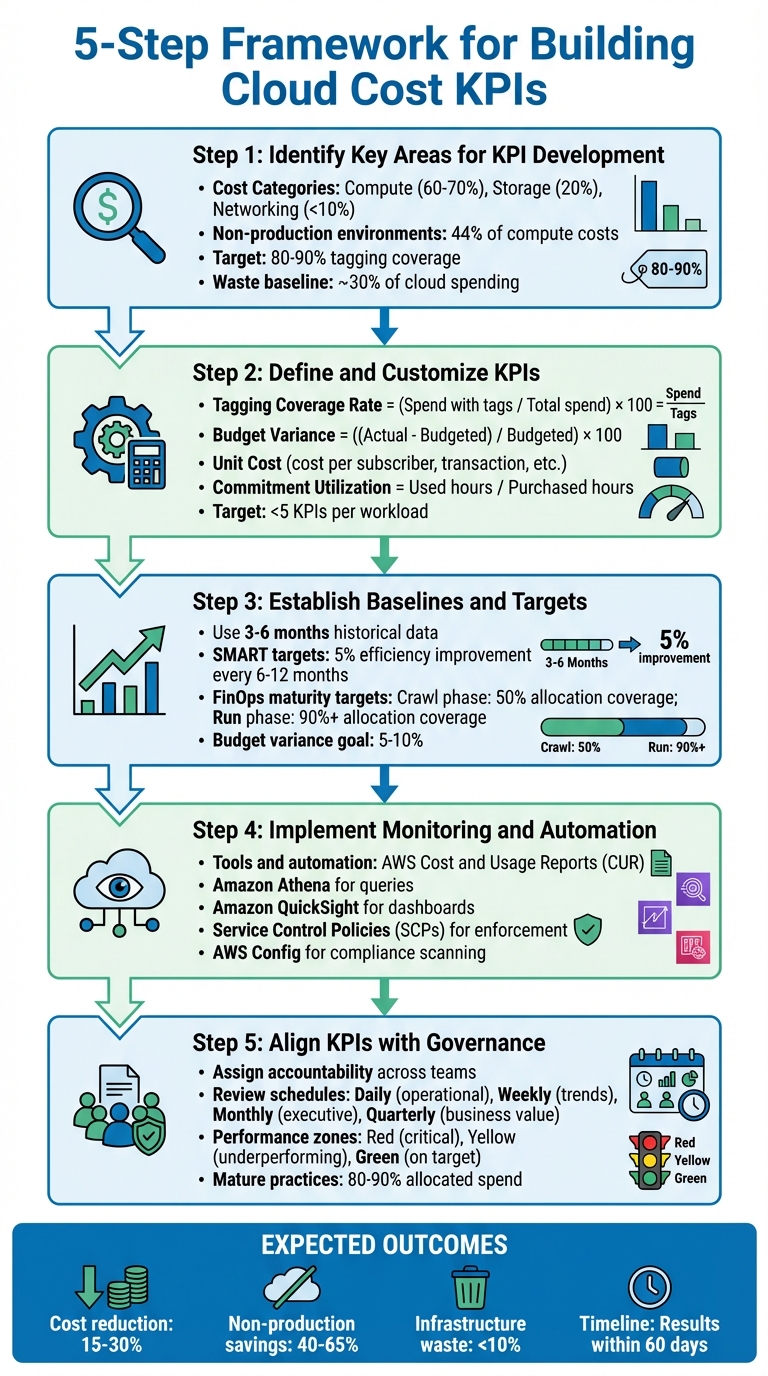 {5-Step Framework for Building Cloud Cost KPIs}
:::
{5-Step Framework for Building Cloud Cost KPIs}
:::
Unit Economics: Cloud Cost Metrics that Matter to the Business
Step 1: Identify Key Areas for KPI Development
To create meaningful KPIs for cloud spending, start by pinpointing the critical areas that influence your costs. Organisations that establish formal KPIs for cloud expenditure often achieve cost savings of 15–30% [4].
Cost Categories to Monitor
Break down your spending across key service categories - compute, storage, networking, and managed databases. These areas provide a clear picture of how your budget is distributed. For example, IaaS revenue typically leans heavily towards compute (60–70%), with storage taking up around 20% and networking under 10% [4]. Focus on the top 10–20 services, as they usually represent the bulk of your expenditure.
It’s also important to differentiate between production and non-production environments. Non-production environments, such as development and testing, can make up 44% of compute costs, even though they’re often required only during working hours [4]. Identifying these areas can help uncover wastage, like resources running unnecessarily outside business hours.
Keep track of how much of your spending is allocated to specific owners versus unidentified or mystery
costs. Advanced FinOps practices typically achieve over 90% allocation coverage, while newer efforts may only reach around 50% [5].
As Cloudaware puts it,
If it's not tagged, it's invisible. And if it's invisible, your cloud financial management turns into guesswork[5].
Strive for tagging coverage of 80–90% to ensure accountability and transparency in your cloud spend [4][5].
Once these areas are identified, the next step is to assess how efficiently your resources are being used.
Efficiency Metrics
Efficiency KPIs help measure whether you’re getting the most out of your cloud resources. Research shows that approximately 30% of cloud spending is wasted on idle or oversized resources [4]. To address this, establish a Total Optimisable Spend
baseline by identifying services like EC2 or RDS, where rightsizing or other recommendations can reduce costs [8].
Define thresholds for under-utilised resources - such as instances with CPU and memory usage consistently below 40% over a four-week period [4]. Pay attention to idle artefacts like unattached EBS volumes, unused load balancers, and orphaned snapshots. For non-production environments, consider implementing power scheduling to shut down resources during off-hours, which can cut costs in these areas by 40–65% [9][4].
To connect spending with business outcomes, combine these metrics with unit economics, such as cost per transaction, API request, or customer order [7][9]. This approach ensures that your spending aligns with tangible business objectives rather than merely tracking overall expenditure.
Forecast Accuracy and Budget Alignment
After analysing spending patterns and efficiency, the next step is refining your forecast accuracy. Cloud costs are unpredictable, so accurate forecasting is essential for financial stability [10]. Monitor the variance between your budgeted and actual spend. A variance of 5–10% is considered healthy for mid-stage FinOps practices, while achieving 90% accuracy or better in production environments signals mature forecasting [5].
Cloudaware notes,
High variance erodes credibility with finance. Low variance builds it[5].
Set up alerts for forecasted costs to address potential overspending before it happens [10]. Use dual forecasting methods - trend-based projections from historical data combined with driver-based models that account for changes like new product launches or geographic expansions [10]. Regularly compare actual spending against forecasts to refine your models, turning forecasting into an ongoing process of learning and improvement [10][5].
Step 2: Define and Customise KPIs
To effectively manage cloud costs, it's crucial to define key performance indicators (KPIs) that provide clear insights into efficiency and value. By focusing on specific cost drivers, you can tailor KPIs to directly measure performance and align them with your organisational goals.
Examples of Useful KPIs
When selecting KPIs, focus on those that address key areas of cloud cost management. For instance, Tagging Coverage Rate measures the quality of your data tagging by calculating the percentage of spend with the required tags. To find this, divide the spend with the correct tags by the total spend, then multiply by 100 [4]. This metric ensures you can accurately allocate costs to teams and projects. Another key metric, Allocated Spend Percentage, tracks how much of your cloud spend is assigned to specific teams or applications [4].
For financial planning, Budget Variance Percentage is invaluable. It highlights how closely your actual spending matches your forecasts. Calculate it by subtracting the budgeted spend from the actual spend, dividing by the budgeted spend, and multiplying by 100 [5]. To identify waste, the Non-Production Spend Ratio compares non-production costs with total costs [4].
Unit Cost metrics, like cost per active subscriber or cost per transaction, establish a shared understanding between technology teams and business stakeholders. AWS refers to this as creating a common language
for collaboration [11]. Lastly, Commitment Utilisation measures the value derived from Reserved Instances and Savings Plans. You can calculate this by dividing the used commitment hours by the total purchased hours [4].
According to VMware,
KPIs should be based on efficiency, not only cost. You might be spending more money, but you're also planning on accomplishing more with what you spend[12].
Tailoring KPIs to Your Business
To ensure KPIs are relevant, start by choosing a cost allocation model that suits your organisation's structure. Account-based allocation is the simplest and works well for organisations with clear boundaries. Business unit or team-based allocation requires moderate effort and can utilise tools like AWS Cost Categories to logically group costs. For maximum granularity, tag-based allocation is the most detailed but demands significant effort [11].
It's essential to align KPIs with business outcomes rather than just technical metrics. For example, instead of monitoring server uptime, focus on results like the number of customer reports generated or web pages served [1][13]. This approach connects your workload's performance to business success. Avoid overloading stakeholders with too many metrics - stick to fewer than five high-level KPIs per workload [1][13].
Your FinOps maturity stage should also guide your targets. Organisations in the early Crawl
phase might aim for 50% allocation coverage, while those in the more advanced Run
phase should target 90% or higher [5]. Similarly, a budget variance of 5–10% is a healthy goal for mid-level practices, while top-tier organisations aim for even tighter control [5]. Finally, adjust shared cost allocation logic to suit your environment. For instance, you could distribute costs for NAT gateways or support fees using metrics like usage hours, API calls, or data transferred [5].
Hokstad Consulting offers expert advice on aligning KPIs with your business objectives.
Step 3: Establish Baselines and Targets
Using Historical Data for Baselines
To get started, use AWS Cost and Usage Reports (CUR) as your foundation. These reports provide detailed insights, such as Resource IDs and hourly data, which help track spending trends and set benchmarks effectively [2]. For example, the AWS KPI Dashboard uses historical CUR data to monitor 18 standard cost optimisation KPIs [2].
When analysing historical data, focus on a timeframe of 3–6 months. This period is long enough to capture seasonal trends and exclude any one-off anomalies [3]. Baselines should be established at multiple levels, such as management accounts, member accounts, environments, projects, or even custom groupings like business units and cost centres [10]. For instance, AWS suggests that 10% or less of EC2 instance spending should go toward older-generation instances - a practical benchmark to aim for [2].
Historical data also plays a key role in forecasting future spending trends. By examining charge types like Reserved Instances, organisations can set realistic targets. A common goal is to achieve 50% coverage for Reserved Instances and Savings Plans, based on past usage patterns [3].
Once you’ve established reliable baselines, the next step is to define clear, measurable targets that align with your organisation's goals.
Setting SMART Targets
With baselines in place, it’s time to create SMART targets - those that are Specific, Measurable, Achievable, Relevant, and Time-bound. According to the AWS Well-Architected Framework:
Goals provide direction to your organisation on expected outcomes, and targets provide specific measurable outcomes to be achieved for your workloads [14].
For example, you could aim for a 5% improvement in workload efficiency every 6–12 months [14]. In terms of storage, a target might involve ensuring that all buckets within a specific project adhere to cost-saving lifecycle policies [3]. When it comes to waste limits, production workloads should ideally keep compute costs under 10% of the tier's total [15].
Your targets should also reflect your organisation's FinOps maturity. Advanced FinOps practices often achieve allocation coverage of 80–90%, ensuring that cloud spending can be confidently attributed to specific teams or products [4]. Before finalising targets, consult with relevant teams to account for any anticipated changes in usage [15].
Finally, remember to review and adjust both baselines and targets at least every 6–12 months as your cloud environment and business needs evolve [15].
Step 4: Implement Monitoring and Automation
Tools for Tracking KPIs
Once you've set your baselines and targets, it's time to put systems in place for ongoing tracking. Tools like Amazon Athena can help you query your Cost and Usage Reports (CUR) stored in S3, while Amazon QuickSight enables you to visualise this data through real-time dashboards [16]. By connecting Amazon Athena queries directly to QuickSight dashboards, you can automate reporting pipelines to keep an eye on key metrics like Tag Coverage Rate, Percent of Total Spend Tagged, and Percent Non-allocable Spend [16]. This approach ensures you have accurate, up-to-date data to enforce tagging accuracy.
Automating Tagging and Reporting
Automation plays a crucial role in ensuring accurate tagging and reporting. With Service Control Policies (SCPs) and Tag Policies in AWS Organisations, you can prevent resources from being launched without the necessary tags [16]. For existing resources, AWS Config offers a managed rule called required-tags, which scans your environment and flags resources that don't meet tagging requirements [16]. Additionally, the Resource Groups Tagging API can help identify untagged assets that need attention [16]. You can also take automation further by implementing cost-saving measures, such as using S3 lifecycle policies to automatically move data into lower-cost storage tiers [3].
Step 5: Align KPIs with Governance and Review Processes
Governance Frameworks for Cost Management
Integrating KPIs into your governance framework transforms cost management from a reactive task into a strategic initiative. To start, assign clear accountability for each metric: engineering teams should handle efficiency KPIs, finance teams should oversee budget alignment, and business units should focus on value-driven metrics [6]. This approach fosters collaboration across departments, preventing cloud cost management from becoming isolated within a single team. Such cross-functional ownership lays the groundwork for continuous improvement in cost governance.
To ensure compliance, use automated guardrails like SCPs, tag policies, and CI/CD pipeline checks. For example, if a KPI breaches its defined threshold, you could temporarily halt CI/CD pipelines until the issue is resolved [17][4][6]. Mature FinOps practices aim for 80–90% of spend to be properly allocated, treating any unallocated spend exceeding 5% as an incident requiring immediate attention [4].
Refining KPIs Over Time
Once your governance framework is in place, it’s essential to keep your KPIs relevant by refining them regularly. As your organisation matures, your metrics should evolve too. Initially, focus on basic metrics like total spend and allocation. Over time, transition to more advanced indicators like utilisation rates, and eventually to strategic measures such as Return on Cloud Investment (ROCI) [6]. Periodically review your KPIs, retiring those that no longer drive actionable insights. Organisations that formalise KPIs for cloud spending often achieve cost reductions of 15–30% [4].
Introduce tiered review schedules to maintain KPI relevance and oversight. Operational metrics might need daily reviews, while trend analysis can be tackled weekly. Monthly executive summaries can provide strategic insights, and quarterly business reviews can assess overall value delivery [6]. Use performance zones - Red for critical issues requiring immediate action, Yellow for underperformance, and Green for metrics meeting or exceeding targets - to give a clear snapshot of progress [6]. As you adopt new technologies or services, update your baselines and targets to reflect fresh opportunities for efficiency.
Conclusion
To wrap up, creating effective KPIs for cost reporting involves pinpointing key cost drivers, establishing clear benchmarks, automating tracking processes, and embedding these metrics into your governance framework. The real payoff comes when you shift from basic spend tracking to unit economics - like cost per subscriber, transaction, or report - ensuring your cloud investments directly support revenue growth [3][13].
Automation plays a crucial role in achieving sustainable cost optimisation. Mature practices can lower expenses by 15–30%, cut non-production costs by up to 65%, and reduce infrastructure waste to under 10% - all within just 60 days [4][5]. As AWS highlights:
Recommending goals, taking action, and seeing impact becomes a virtuous cycle your organisation can use to grow and innovate faster [2].
It's essential to revisit and refine your approach regularly. As your environment evolves, upgrading from basic allocation metrics to more advanced measures ensures your strategies remain aligned with your business goals [5].
For organisations that lack internal resources or want to fast-track their FinOps maturity, external expertise can be invaluable. Hokstad Consulting offers tailored strategies, automated solutions, and ongoing optimisation to help businesses reduce cloud costs by 30–50%. Their No Savings, No Fee
model removes upfront risk, making expert guidance both practical and accessible.
Ultimately, successful cost reporting hinges on choosing the right KPIs, automating their tracking, and ensuring they stay aligned with your organisation's objectives. For many organisations, the potential for improvement remains significant [4].
FAQs
How can businesses connect cloud costs to measurable business value using KPIs?
To link cloud expenses to business impact, companies should establish key performance indicators (KPIs) that connect spending to revenue-focused metrics. Examples might include cost per product, cost per customer, or cost per transaction. By examining these figures, businesses can gain a clearer picture of the return on investment (ROI) from their cloud usage.
To track this effectively, consider tools like tagging, FinOps dashboards, and unit economics analysis. These methods promote transparency, support informed budgeting decisions, and help ensure cloud spending aligns with overarching business objectives. Regularly updating and reviewing KPIs is essential to keep them aligned with shifting goals and market trends.
What are the best practices for automating cloud cost tracking in the UK?
To keep cloud cost tracking on point, start by rolling out a well-planned tagging strategy. Make sure all resources - like workloads, storage buckets, and network interfaces - are tagged with meaningful labels, such as project names, environments, or cost centres. This makes it easier to generate detailed, real-time cost reports and ensures you have clear visibility over your spending.
Next, use your cloud provider's console to establish budget thresholds and automated alerts. These alerts can notify you instantly if spending starts to go off track. For a deeper dive into your costs, export detailed data, like the AWS Cost and Usage Report, and feed it into a central analytics platform. This setup allows you to track costs down to specifics, like hourly spikes, and even enables AI-powered forecasting for better planning.
To take things further, automate cost-saving measures by integrating cost checks into your CI/CD pipelines. For instance, verify that new resources are properly sized, tied to cost-effective purchasing models - like spot or reserved instances - or managed by auto-scaling policies that take cost metrics into account. In Kubernetes environments, leverage tools that convert resource usage into GBP-based costs per pod or namespace. Combining regular audits with automation ensures you stay ahead of cloud costs while keeping spending aligned with your business goals.
How should organisations evolve their KPIs as their FinOps practices mature?
As organisations move forward in their FinOps journey, the focus of their KPIs should evolve from simple cost tracking to more strategic, value-oriented metrics. Here's how these metrics typically develop across different stages:
In the early stages, the emphasis is on visibility. Track metrics like total monthly cloud spend, budget versus actual variance, and basic utilisation ratios (e.g. the proportion of spend on on-demand versus reserved instances). These indicators help teams spot waste and take control of their budgets.
As organisations reach the intermediate stage, the focus shifts to efficiency and allocation. Metrics such as cost-per-service, the percentage of spend covered by savings plans, tagging compliance rates, and forecast accuracy become essential. These measures encourage actions like right-sizing resources, improving tagging practices, and implementing cost-saving strategies.
At the advanced stage, KPIs should tie directly to business outcomes. Metrics might include the cloud-cost-to-revenue ratio, ROI of migration projects, and cost-per-GPU-hour. Automation becomes a critical focus, with indicators such as the percentage of cost anomalies resolved within 24 hours reflecting a proactive FinOps culture. Hokstad Consulting can support organisations in crafting and automating these advanced KPIs, ensuring they are tailored to UK-specific formats (e.g. £ for currency, dd/mm/yyyy for dates) and aligned with broader strategic objectives.