
CDN traffic monitoring is all about staying on top of performance, costs, and security in real time. Without it, issues like misconfigurations, regional outages, or inefficient caching can lead to slow websites, lost revenue, and frustrated users. For example, Amazon estimated that a one-second page delay could cost £1.2 billion annually. Here's what you need to know:
- Why it matters: Faster issue detection improves user experience, reduces costs, and enhances security by catching threats like DDoS attacks early.
- Key metrics to track: Focus on cache hit ratio, Time to First Byte (TTFB), and geographic performance to optimise CDN efficiency and identify bottlenecks.
- Real-time tools: Use edge logs, Real User Monitoring (RUM), and synthetic testing to get a complete view of performance.
- Actionable insights: Segment data by region and device, set up dynamic alerts, and use percentile-based monitoring (e.g., p95 latency) to avoid averages masking issues.
Real-time monitoring isn't just about fixing problems - it’s about preventing them. By using tools like CloudFront Real-Time Logs or Fastly Log Streaming, you can process terabytes of data in seconds, ensuring smooth delivery and better cost management. Start tracking today to keep your CDN running smoothly and efficiently.
Monitor CDN performance with Cloudflare Logpush

Need help optimizing your cloud costs?
Get expert advice on how to reduce your cloud expenses without sacrificing performance.
Key Metrics to Track for CDN Performance
Tracking the right metrics is the key to moving from reacting to problems to actively improving your CDN setup. Three key indicators - cache hit ratio, Time to First Byte (TTFB), and geographic performance - form the backbone of effective CDN monitoring. These metrics cover everything from edge cache efficiency to routing quality across regions, enabling real-time insights and ensuring optimal performance across all nodes.
Cache Hit Ratio
The cache hit ratio tells you how many requests are served directly from edge caches instead of the origin server. It's calculated as:
Cache Hit Ratio = Cache Hits / (Cache Hits + Cache Misses) [9].
A higher ratio means faster delivery to users and reduced load on your origin server. For instance, improving the cache hit ratio by just 1% can save petabytes of traffic and cut backend costs by up to 85% [3]. Shopify data highlights that e-commerce platforms with cache hit ratios over 95% enjoy 20% lower bounce rates and 35% higher conversion rates compared to those under 75% [9].
To get the most out of this metric, monitor both Request Hit Ratio (focused on user experience) and Byte Hit Ratio (focused on cost savings and bandwidth reduction) [7][5]. Instead of relying on aggregated dashboards, stream raw logs - like CloudFront Real-Time Logs or Fastly Log Streaming - into specialised data platforms to avoid losing critical details [7][2].
A 1% increase in cache hit ratio saves petabytes of origin traffic annually.
Netflix, for example, achieved a 99%+ cache hit ratio for its popular video content by leveraging localised edge nodes and tiered caches, improving video start times by 20% [9]. Similarly, Atlassian saved over £800,000 annually in egress costs by separating user-specific content from static attachments, achieving an 88% cache efficiency [9].
Practical steps to optimise your cache hit ratio include:
- Normalising URLs: Remove or whitelist parameters like
?utm_source=to avoid cache fragmentation [9]. - Setting TTLs: Use long TTLs (e.g., 365 days) for static files and shorter ones (5–10 minutes) for dynamic content [9].
- Stale-while-revalidate: Serve slightly outdated content while revalidating in the background for instant responses [9][7].
Segment your metrics by region, device, and resource type to uncover localised issues that global averages might mask [9][7].
Time to First Byte (TTFB)
TTFB measures the time from the moment a request is sent to when the first byte of the response is received. It helps identify bottlenecks in the network, CDN, or origin server [10][7][5][3].
Google recommends keeping the median TTFB below 800 milliseconds for a good user experience, with the 95th percentile ideally under 1,800 milliseconds [6]. A high TTFB often points to cache misses, poor routing, DNS delays, or slow origin responses [5][3]. Delays as small as 100 milliseconds in page load time can reduce conversion rates by 7% [3].
TTFB is a widely-used metric because it is easy-to-understand and it is a great signal for connection setup time, server time and network latency.
- Sam Marsh, Cloudflare [10]
For accurate analysis, break TTFB into components:
- Connect Time: Includes DNS, TCP, and TLS handshakes.
- Server Time: Covers CDN processing and origin fetch times [6].
Monitor TTFB using the 95th or 99th percentiles instead of averages, as averages can hide regional issues and poor experiences for users in challenging network conditions [7][2]. Compare TTFB for cache hits versus misses to pinpoint whether latency stems from the CDN edge or the origin server [5][6].
To capture precise Real User Monitoring (RUM) data, enable Timing-Allow-Origin (TAO) headers, which allow browsers to report detailed timing metrics [2]. Use a mix of real user and server-side data sources for a complete picture [2][6].
Geographic Performance and Traffic Distribution
Beyond cache and latency metrics, geographic data highlights regional variations in CDN effectiveness. Global averages can often mask regional issues - for example, a healthy
worldwide average might still hide underperforming Points of Presence (PoPs) in specific areas [7][8]. Performance can vary across ISPs and access networks, so tracking geographic data is essential for identifying routing or peering issues with certain networks [6].
A generic '99% uptime' status or a flat average latency graph often hides regional outages, errors affecting specific user devices, and inefficient caching policies.
FOX demonstrated the importance of geographic monitoring during the February 2025 Super Bowl broadcast. By processing 1.4 petabytes of log data daily, they maintained full visibility and resolved regional issues in real time [8]. Similarly, Paramount used a multi-CDN strategy with real-time latency metrics to dynamically route video streams, cutting infrastructure costs by 50% while improving user experience globally [8].
The Asia-Pacific (APAC) region accounts for roughly 45% of global internet traffic [8][3], yet first-byte times here can be up to twice as long as in Western Europe [11]. Notably, 60% of video streaming issues in APAC are linked to missed local cache optimisations [11].
To monitor regional performance effectively:
- Focus on tail latency using the 95th and 99th percentiles rather than averages [7][8][11].
- Analyse traffic by Autonomous System Number (ASN) to identify ISP-specific issues or bot traffic from cloud providers [7][11].
- Break down TTFB into connect time (network/peering issues) and server time (CDN/origin issues) to pinpoint regional slowdowns [6].
- Set up custom alerts for 5xx error spikes or unusual traffic patterns in high-priority markets [11][6].
Implementing Real-Time Data Collection and Monitoring
::: @figure 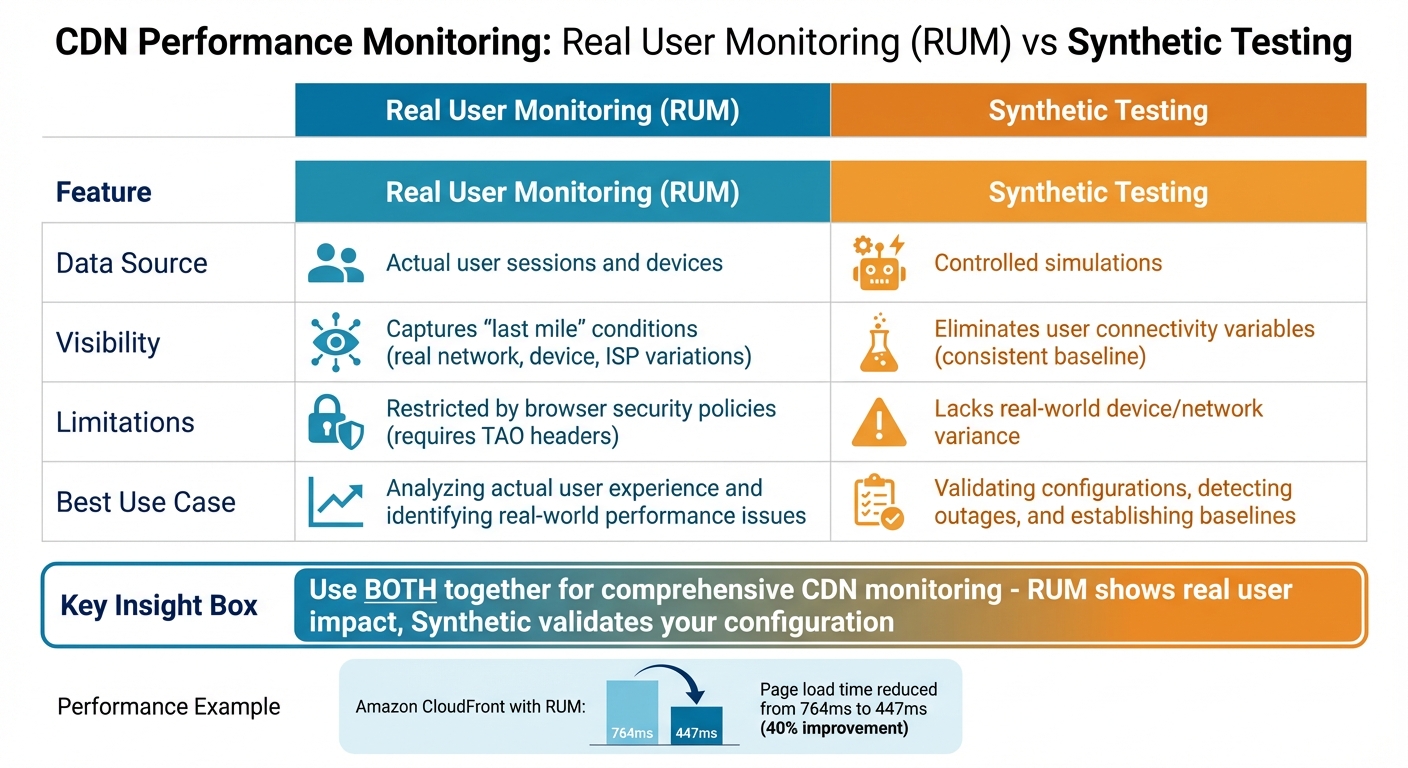 {Real User Monitoring vs Synthetic Testing for CDN Performance}
:::
{Real User Monitoring vs Synthetic Testing for CDN Performance}
:::
Effective CDN monitoring relies on three key data sources: edge logs, Real User Monitoring (RUM), and synthetic testing [2]. Each plays a distinct role. Edge logs provide details about how requests are processed, such as whether a request was missed because it was dynamic
or expired.
RUM focuses on the last mile
, capturing browser-level experiences that might not be visible in logs. Synthetic testing offers controlled baselines, helping to identify issues like regional outages or misconfigured cache headers impacting specific user groups. By combining these data sources, you can minimise blind spots and ensure comprehensive real-time monitoring to improve CDN performance.
In high-traffic scenarios, traditional databases often can't keep up. Streaming platforms, however, can process millions of log lines per second and make the data usable in under ten seconds [1]. This quick turnaround enables immediate detection of issues like a sudden increase in 5xx errors or a drop in cache hit ratios - critical for addressing problems before they affect users.
Network latency is a physics problem, but user experience is an engineering problem.- Hydrolix Team [2]
For multi-CDN setups, log normalisation is crucial. Different providers use varying terminologies - for instance, CloudFront's x-edge-result-type versus Cloudflare's CacheCacheStatus [2]. By mapping these to a standard schema (e.g., Hit, Miss, Bypass, Revalidated), you can make accurate comparisons across CDNs. Tools like OpenTelemetry Collector help by aggregating real-time log streams from multiple providers into a single observability platform [12]. Adding custom metadata - such as CDN source, region, or ingestion latency - during this process further supports troubleshooting [4].
Real User Monitoring (RUM) and Synthetic Testing
RUM uses a JavaScript snippet to collect data directly from user browsers [14]. This approach reveals how real devices and networks influence performance, uncovering issues like slow mobile networks or poor ISP peering. For example, monitoring Amazon CloudFront with RUM helped reduce page load times from 764 milliseconds to 447 milliseconds - a nearly 40% improvement [14].
However, RUM has its limitations. Browser security policies restrict visibility into cross-origin resources unless the Timing-Allow-Origin (TAO) headers are properly configured [2][12]. Google also advises using the 75th percentile (p75) for evaluating user experience metrics instead of averages, as averages can hide performance issues. For instance, websites with poor Largest Contentful Paint (LCP) often show a median p75 Time to First Byte (TTFB) of around 2,270 milliseconds [2].
Synthetic testing complements RUM by providing a consistent baseline. Probes deployed from fixed locations (e.g., using OpenTelemetry) can validate configuration changes and isolate connectivity issues [12][13]. Custom Python-based probes can even measure specific timings, such as TLS handshake or TTFB, while examining CDN-specific headers like X-Cache or CF-Cache-Status [13].
CDN monitoring requires active probing because passive metrics from your origin servers do not tell you what end users actually experience.- Nawaz Dhandala, OneUptime [13]
When running synthetic tests, it’s important to separate cold cache
and warm cache
runs to maintain data accuracy. Tracking the percentage of uncacheable traffic is also essential - roughly 21% of websites mistakenly use the Cache-Control: no-store directive on cacheable resources, which undermines CDN efficiency [2].
| Feature | Real User Monitoring (RUM) | Synthetic Testing |
|---|---|---|
| Data Source | Actual user sessions and devices [14][15] | Controlled simulations [12][13] |
| Visibility | Captures last mileconditions [2][15] |
Eliminates user connectivity variables [2] |
| Limitations | Restricted by browser policies [2][15] | Lacks real-world device/network variance [14][15] |
| Best Use Case | Analysing actual user experience [14] | Validating configurations and outages [2][13] |
While RUM focuses on user experience and synthetic tests validate configurations, real-time log streaming ensures detailed, immediate insights into CDN operations.
CDN Log Streaming and Integration
Edge logs offer a wealth of information, but their utility depends on rapid ingestion and querying. Real-time log streaming - through tools like CloudFront Real-Time Logs or Fastly Log Streaming - delivers data to analytics platforms within seconds, enabling quick identification of anomalies [2]. In multi-CDN setups, standardising log schemas is key. Mapping vendor-specific fields (e.g., Akamai's statusCode, Edgio's sc-status, or Fastly's status) to a unified schema like status_code ensures consistency. Adding metadata such as CDN source, region, or ingestion latency further aids in troubleshooting [2][4].
The OpenTelemetry Protocol (OTLP) simplifies integration by allowing metrics from probes or log parsers to be sent to a central collector for enrichment [13]. This unified approach links CDN performance with origin server health and application metrics [12][13]. For high-cardinality data like IP addresses or request paths, using summary tables to precompute intermediate states can reduce query times from seconds to milliseconds [1][4].
Breaking down latency into three parts - Client RTT (handshake time), Edge Processing (WAF/cache lookup), and Origin Latency (fetch time) - helps pinpoint the source of delays, whether it’s network peering issues, CDN logic, or backend inefficiencies [2]. Additionally, retaining raw logs for extended periods is crucial for forensic analysis. Given that the average time to detect a security breach is 272 days, long-term log retention is an essential practice [4].
Setting Up Dashboards and Alerts
After establishing real-time data collection, the next step is turning that data into actionable insights. This involves creating clear dashboards and setting up dynamic alerts. The aim? To detect performance issues in seconds - long before users even notice. By translating raw data into visual dashboards, you can act immediately when problems arise.
Real-Time Dashboards for Monitoring Key Metrics
A well-designed CDN dashboard should provide an integrated view of critical metrics like live geographic maps, traffic trends, and error rate trackers. These tools allow you to quickly identify performance bottlenecks [16][7].
- Geographic maps: Show traffic origins and help pinpoint regional latency problems.
- Traffic trends: Monitor throughput, bandwidth, and total requests over time.
- Error trackers: Break down issues by status codes, distinguishing between client-side 4xx errors (e.g., broken links) and server-side 5xx errors (e.g., server failures) [19][16].
For visualisation, Grafana is a go-to tool, often paired with data sources like Prometheus or Hydrolix [19][16][20]. When dealing with high-cardinality data (e.g., individual IPs or request paths), summary tables can be used to precalculate metrics, cutting query times from seconds to milliseconds - even for datasets with billions of rows [1][16]. To identify slowdowns, break latency into its core components [2][7].
Monitoring isn't just about troubleshooting; it's about resilience.- BlazingCDN [20]
Key metrics to track include Request Hit Ratio and Byte Hit Ratio, which are crucial for assessing performance and cost efficiency [7][5]. Organisations leveraging real-time analytics across their edge delivery chains report 33% faster incident resolution times and up to 60% fewer major outages [20].
While dashboards provide a broad overview, dynamic alerts ensure you can respond to anomalies as they happen.
Configuring Alert Thresholds and Anomaly Detection
Static alert thresholds often struggle during peak traffic times, leading to false positives. For instance, a 20% traffic surge might be normal at 8 PM but could indicate a DDoS attack at 3 AM [1]. To address this, use dynamic baselining, which compares current data to the same period from the previous week, and apply Exponentially Weighted Moving Averages (EWMAs) to filter out noise [18].
Instead of relying on averages, focus on percentiles like the 95th or 99th percentile (p95/p99) for latency and time-to-first-byte (TTFB). Averages can mask performance issues affecting a minority of users. For example, you might set an alert if p95 latency exceeds 250 milliseconds for two consecutive minutes [17]. Similarly, configure specific thresholds for:
- Edge 5xx error rates: Alert if more than 0.25% of requests fail within a five-minute window.
- Cache hit ratio: Alert if it falls below 85% [18].
Incorporating machine learning for anomaly detection can reduce the volume of alerts by 43% while identifying genuine issues more quickly [18]. Ensure that breached thresholds trigger notifications via tools like PagerDuty, Slack, or SMS within 30 seconds [18]. Segment alerts by region, point of presence (PoP), and host to distinguish between localised and global problems [2].
Improving Traffic Routing and Load Balancing
Building on real-time monitoring techniques, fine-tuning traffic routing plays a key role in boosting CDN performance while keeping costs in check.
Real-time monitoring feeds directly into routing strategies, instantly diverting traffic from overloaded nodes to healthier alternatives. This dynamic adjustment ensures performance remains optimised at all times.
Using Global Server Load Balancing (GSLB)
GSLB works at the DNS level, acting as a global traffic manager that routes users based on factors like server health, proximity, and available capacity [21][23]. Unlike basic geographic routing, Smart GSLB takes things further by understanding the internal network structure. It uses real-time data from feedback agents to avoid the hot node
issue, where traffic overwhelms a nearby but already busy server [21][22].
GSLB isn't about geography. It's about locality, health, and app awareness. So if your load balancer doesn't know what your application is doing, it's not smart load balancing - it's just hoping.- Loadbalancer.org [22]
The secret lies in moving beyond basic up/down
health checks. Instead, employ TCP, HTTP, or even custom health checks to assess actual application load [21]. This ensures traffic only goes to nodes that can handle it. For immediate adjustments, configure GSLB with a zero TTL, enabling instant traffic redirection [21].
One example of this approach in action is Paramount, which achieved a 50% reduction in infrastructure costs by dynamically routing video streams between CDN providers using real-time latency metrics. This not only saved money but also improved the Quality of Experience for users [8].
Similarly, anycast routing benefits from performance monitoring to ensure packets are delivered as efficiently as possible.
Monitoring Anycast Routing for Performance
Anycast routing uses BGP to advertise a single IP address across multiple Points of Presence (PoPs). This setup allows the global routing system to send packets to the closest
node based on network topology [24]. However, proximity alone doesn’t guarantee performance, as BGP lacks application awareness. This is why monitoring is essential to ensure users are reaching the most optimal endpoints.
To identify and fix routing issues, track tail latencies (such as p95 and p99) using synthetic probes from various global locations [7][8][5]. For example, during a Cloudflare incident in June 2024, the 99th-percentile Time to First Byte (TTFB) spiked to three times its usual level, even though average performance only showed minor degradation. This highlights the importance of focusing on tail latency metrics [8].
Analysing TTFB can also help pinpoint whether delays stem from Anycast routing or origin server performance [2][8]. When a PoP underperforms, withdrawing its BGP announcements can automatically redirect traffic to a better-performing location - provided the right metrics trigger this action [24].
Conclusion
Real-time CDN monitoring transforms content delivery by moving away from reactive troubleshooting and focusing on proactive performance management. By tracking percentiles like p95 and p99, teams can identify tail latency issues that average metrics often fail to reveal [2][7]. As the Hydrolix Team aptly puts it:
Network latency is a physics problem, but user experience is an engineering problem.
- Hydrolix Team [2]
Effective monitoring combines edge logs, real user data, and synthetic tests to pinpoint the root causes of slowdowns. This approach helps distinguish whether delays stem from CDN misconfigurations, origin server performance, or network routing issues, reducing the mean time to resolve by as much as 30% [2][6][25][11].
Beyond improving operational efficiency, real-time monitoring also helps cut costs. For instance, differentiating between request hit ratio (a performance metric) and byte hit ratio (a cost metric) ensures that both user experience and infrastructure spending are optimised [7]. A major broadcaster exemplified this by slashing its mean time to detect from 7 minutes to just 45 seconds and its mean time to resolve from 33 minutes to 8 minutes, thanks to real-time edge logs and anomaly detection [18]. Similarly, Nordic retailer Elkjøp successfully mitigated a DDoS attack during its busiest shopping event by using real-time traffic monitoring, ensuring uninterrupted availability when it mattered most [4][26].
Standardising logs across multiple CDNs is another essential practice. By mapping different field names - such as Akamai's statusCode and Fastly's status - into unified schemas, teams can perform accurate comparisons across platforms [1][4]. Configuring precise alert thresholds, such as investigating error rates above 0.1% over a five-minute period or cache hit ratios dropping below 90%, further enhances responsiveness [11].
Shifting to a streaming architecture enables the ingestion and querying of terabytes of logs in under ten seconds, providing instant insights that support dynamic routing and load balancing [1]. Real-time monitoring not only ensures CDN infrastructures remain agile but also keeps operational costs in check with precise metrics and alerts.
For tailored advice on optimising real-time CDN monitoring, consider reaching out to Hokstad Consulting to guide your next steps.
FAQs
What’s the quickest way to pinpoint whether latency is edge, network, or origin?
To pinpoint if latency issues originate from the edge, the network, or the origin, it's essential to categorise latency metrics into edge latency, origin latency, and network latency. Leveraging tools such as real-user monitoring, synthetic testing, and log analysis can provide valuable insights. These techniques are fundamental for keeping a close eye on CDN performance.
How do I set alert thresholds that avoid false alarms during peak traffic?
To cut down on false alarms during busy traffic periods, align your alert thresholds with typical traffic patterns and business objectives. Leverage real-time analytics to keep an eye on regional performance, compare error rates, and set anomaly triggers effectively. By normalising metrics and establishing baseline trends, you can separate regular fluctuations from actual issues. Using thresholds that adjust based on historical data ensures you stay responsive to genuine problems while reducing the noise of unnecessary alerts.
What’s the minimum setup for real-time monitoring in a multi-CDN environment?
To get started, you'll need to focus on a few basics: standardising logs across providers, setting up real-time alerts, and building dashboards that clearly connect routing decisions to performance results. These steps make it easier to spot problems early and fine-tune traffic routing for better efficiency.