
Efficient data access is critical for DevOps success. Poorly managed data slows down deployments, increases costs, and impacts reliability. This guide explains how to optimise data retrieval, processing, and storage to improve performance and reduce expenses.
Key Takeaways:
- Common Challenges: Query latency, read amplification, and infrastructure overuse are frequent issues.
- Solutions: Use analytics tools to identify inefficiencies, optimise queries, monitor cache performance, and implement storage strategies like partitioning and tiered storage.
- Metrics to Track: Latency, throughput, cache hit rates, and replication lag are vital for performance monitoring.
- CI/CD Integration: Enforce data access checks at every pipeline stage to maintain quality and performance.
- Advanced Techniques: AI-driven anomaly detection and capacity forecasting can further refine optimisation efforts.
Quick Example:
A retail platform cut dashboard load times by 97% and saved £820,000 annually by optimising queries and storage strategies.
By embedding observability, leveraging analytics, and aligning performance improvements with cost savings, you can streamline DevOps workflows and achieve better outcomes.
Data Access Patterns in DevOps: The Basics
Common Data Access Patterns Explained
Understanding your application's read and write behaviours is key to improving performance. Many production systems, like social media feeds, product catalogues, or news websites, are typically read-heavy, with read-to-write ratios often hitting 100:1 or even 1,000:1 [11]. On the other hand, write-heavy workloads are more common in areas like event streaming, logging, or financial transactions, where the focus is on handling high-throughput data ingestion [12].
Another important factor is access timing. Some workloads maintain steady traffic throughout the day, while others experience spiky traffic, with sudden surges that can overwhelm infrastructure if scaling isn’t managed properly [9]. Designing systems for peak loads without scaling mechanisms can lead to unnecessary costs from idle resources [8].
It’s also important to differentiate between OLTP (Online Transaction Processing) and OLAP (Online Analytical Processing) workloads. OLTP focuses on real-time, row-level operations, such as banking transactions or order processing, where speed and consistency are crucial. OLAP, on the other hand, handles large-scale aggregations, often used for business intelligence and reporting purposes [10][12].
When it comes to access methods, synchronous patterns require each operation to complete before moving to the next, which can directly impact user-perceived latency. In contrast, asynchronous patterns, such as those using queues or event streams, allow for higher throughput by decoupling processing steps [13]. Additionally, tiered storage solutions - for example, storing active data on Amazon S3 and archiving older data to S3 Glacier - help balance storage costs with access frequency [9][12].
These patterns provide the foundation for selecting the right metrics to monitor and optimise performance.
Key Metrics for Measuring Data Access Performance
Here are some essential metrics to keep an eye on:
| Metric | What It Measures | Why It Matters |
|---|---|---|
| Latency | Time taken for a single data request to complete | Directly impacts user experience and SLA compliance [10] |
| Throughput (TPS/QPS) | Transactions or queries processed per second | Reflects the system’s ability to manage concurrent loads [8][10] |
| IOPS | Input/output operations per second on storage | Essential for storage-heavy databases and block storage performance [12] |
| Cache Hit Rate | Percentage of requests served from cache | An 80% or higher rate is ideal; lower rates suggest inefficiencies [2] |
| Replication Lag | Delay between a write on the primary database and its replication | Affects how fresh data is on read replicas [11] |
Monitor cache hit rate with a goal of 80% or higher. Lower values may indicate insufficient cache size or an access pattern that does not benefit from caching.- AWS Documentation [2]
One often-overlooked metric is read amplification - the ratio of data read from storage compared to what the query actually required. High read amplification often points to issues like inefficient data organisation or missing partitions. When unexplained latency arises, this is one of the first areas to investigate. In general, tackling I/O bottlenecks tends to deliver quicker performance improvements than focusing on network or CPU issues [5].
Need help optimizing your cloud costs?
Get expert advice on how to reduce your cloud expenses without sacrificing performance.
Adding Data Access Analytics to DevOps Workflows
Building Observability into Your Systems from the Start
To truly optimise data access, you need to integrate analytics early on. Start by embedding observability into your systems from the beginning. One effective method is Observability-Driven Development (ODD), where instrumentation becomes a non-negotiable part of your Definition of Done.
In other words, your code isn’t complete until it includes proper logging, metrics, and tracing [15].
Observability rests on three key pillars: metrics, logs, and traces [17][18]. For databases, focus on specific metrics like query execution data, connection pool usage, cache hit ratios, and schema change audits [19][7]. For instance, PostgreSQL users can enable the pg_stat_statements extension to capture query call counts and average latency with minimal performance impact. Similarly, MySQL users can rely on the Performance Schema for equivalent insights [7].
To avoid data silos and streamline troubleshooting, use a single platform to centralise these metrics, logs, and traces. This approach not only simplifies cross-service correlations but also improves collaboration between Dev and Ops teams. In fact, 79% of organisations with centralised observability report saving both time and money [17][18].
Adding Data Access Checks to CI/CD Pipelines
Once observability is set up, the next step is to enforce data access quality at every stage of your CI/CD pipeline.
The further left you push a check, the cheaper it is to fix what it finds.- Fabiana Ferraz, Technical Writer, Soda [14]
Here’s how you can integrate checks at different pipeline stages:
| Gate | When It Runs | Checks |
|---|---|---|
| Pre-commit | Local, before push | Contract file syntax and linting |
| PR check | On pull request | Schema and structural contract tests |
| Post-merge | After merge to main | Full quality and freshness checks |
| Post-ingest | After data lands | Row-level quality, nulls, ranges |
To support these checks, use data contracts - YAML files that define schema rules, null rate thresholds, and freshness SLAs. These contracts should live alongside your application code in version control [14].
When it comes to database migrations, every change must include a tested forward and rollback path within the CI pipeline [16]. Tools like ephemeral database containers (e.g., Testcontainers) can validate migrations and performance for every pull request [16].
A practical way to enforce performance standards is by identifying your top 20–50 critical queries. Establish baseline execution times and flag any pull request that causes a regression of more than 10–15% [16]. This ensures performance remains a measurable and enforceable aspect of your workflow.
Creating Feedback Loops Between Dev and Ops Teams
A unified view of data between development and operations teams is crucial for fast and effective root cause analysis. Without this, teams may end up monitoring different signals - one focusing on application logs while the other tracks infrastructure metrics - leading to delays and fragmented troubleshooting.
A well-designed feedback loop changes this dynamic. For example, configure alerting webhooks from tools like Datadog or Splunk to trigger automated investigation workflows whenever an SLO is breached [21][22]. A real-world example from March 2026 shows how an AWS DevOps Agent identified a message processing failure within 6 minutes of a Datadog alert. The root cause? An incomplete container image push that resulted in 404 errors [21].
Database optimisation is not a one-time project. It's a feedback loop. The teams that maintain fast, reliable databases over time are... the ones whose instrumentation tells them where to look next.- Damaso Sanoja, DEV Community [7]
Advanced AIOps systems can take this even further. By correlating thousands of raw events into a handful of actionable insights, these systems reduce alert noise by 90–99% [20]. This is becoming increasingly important as log volumes grow. Analysing 50–500 GB of logs daily using traditional methods leads to unsustainable staffing costs [20]. These practices are essential for maintaining the continuous improvement cycle needed to optimise data access within DevOps workflows.
DevOps meets DataOps
Best Practices for Using Analytics to Optimise Data Access
::: @figure 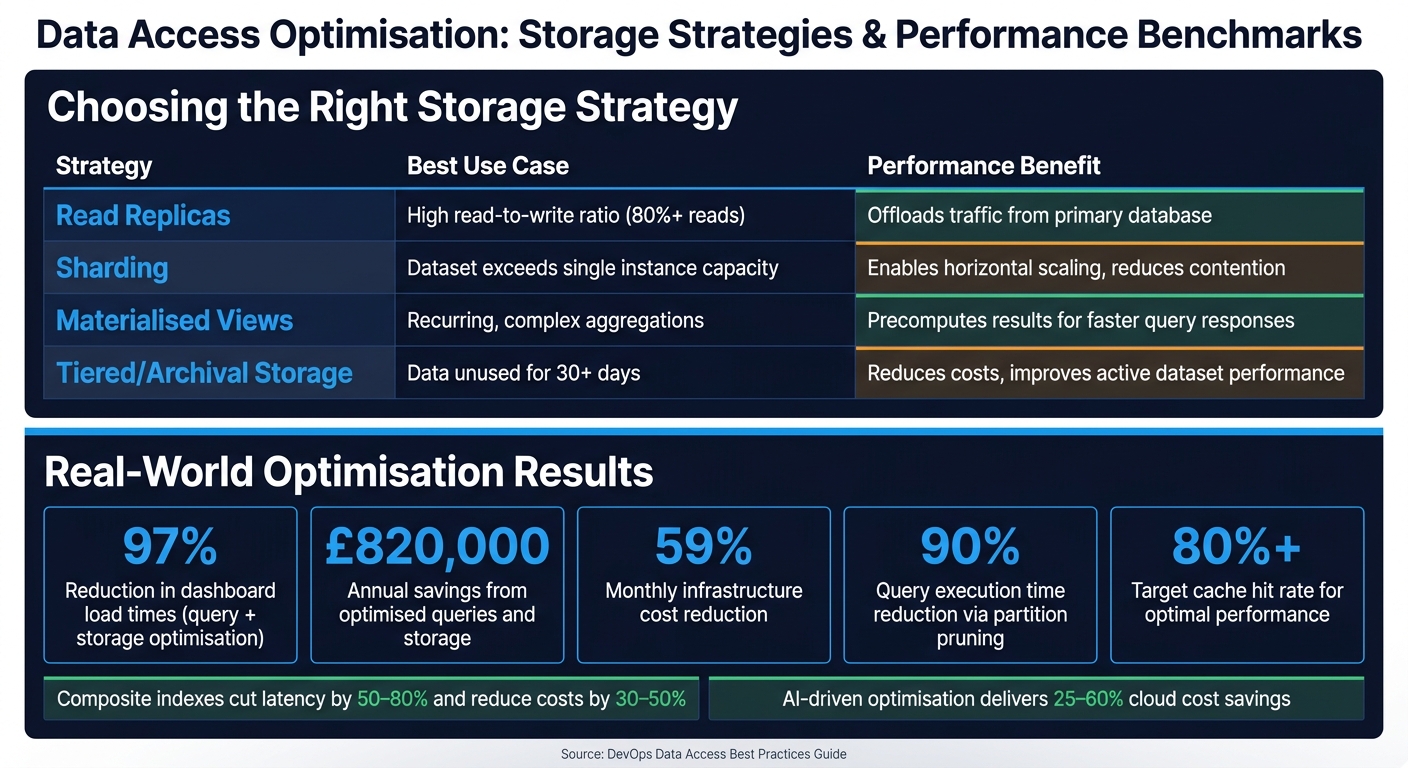 {Data Access Optimisation: Key Storage Strategies & Performance Metrics}
:::
{Data Access Optimisation: Key Storage Strategies & Performance Metrics}
:::
Improving Database Queries with Analytics Tools
Analytics tools can help pinpoint which database queries are causing the most strain. For example, a query that takes 20 milliseconds but runs 50,000 times creates a much heavier load than a 5-second query executed only twice [7]. Focusing on these high-impact queries can help prioritise optimisation.
Once you've identified problem queries, use execution plan analysis to uncover persistent bottlenecks [6][23][25]. Tools like auto_explain can automatically log plans for queries exceeding a set threshold (e.g., 250ms), giving you a continuous record of problematic queries without needing manual checks [24].
Stop tuning blind: Query observability is the foundation for database optimisation.- Damaso Sanoja, DevOps Specialist [7]
To improve query performance, consider adding covering indexes using the INCLUDE clause. This approach allows the database to fulfil queries directly from the index, bypassing costly heap fetches. Also, ensure your WHERE clauses are index-friendly. For instance, use WHERE created_at >= '2024-01-01' instead of WHERE YEAR(created_at) = 2024, as the latter forces a full table scan [6][7][25]. Analytics can reveal where these adjustments will have the most impact. In many cases, composite indexes can cut latency by 50–80% and reduce costs by 30–50% [6].
One real-world example highlights the power of targeted fixes. By using analytics to identify inefficiencies, a team partitioned fact tables, replaced SELECT * with specific column projections, and enabled Adaptive Query Execution (AQE). These changes reduced dashboard load times by 97% and slashed monthly infrastructure costs by 59% [6].
Using Cache Monitoring to Cut Read Traffic
Optimising cache performance is just as important as tuning queries. The hit/miss ratio is a key metric here: a drop from 90% to 70% can triple the load on your database [26]. Keep an eye on eviction rates too - if both metrics worsen simultaneously, your cache might be too small for its workload [26][27].
Analytics can also help identify hot keys (frequently accessed items) and oversized keys that consume excessive resources [27][28]. For example, Salesforce Marketing Cloud used a Count-Min Sketch
algorithm to detect hot keys and reroute them to a near-cache. This strategy prevented shard saturation while handling 1.5 million requests per second [28][30].
Other techniques include adding TTL jitter (randomising expiration times by 10–20%) to avoid cache stampedes, where mass expirations overwhelm the database [28][30]. Implementing stale-while-revalidate allows slightly outdated data to be served instantly while a background refresh updates the cache. This approach eliminates the penalty of cold misses and helps maintain a hit ratio above the recommended 85% for distributed systems like Redis [26][28][29].
Choosing Storage Strategies Based on Access Patterns
Analytics insights can also guide your storage decisions. Metrics such as scan costs and join efficiency are invaluable when designing partitioning and materialised view strategies [4].
Partitioning is particularly impactful. The key is to design partitions based on how data is queried, not just how it’s ingested. For instance, date-range partitioning works well for time-series data, while business-unit partitioning suits multi-tenant systems. Partition pruning can reduce query execution time by up to 90% [6]. Minimising cross-partition joins is equally important, as moving large datasets between nodes (the shuffle tax
) can be a hidden cost [5].
For complex, recurring aggregations, materialised views are worth exploring. A German retailer, Home24, used Amazon Redshift materialised views to unify analytics across their data. This reduced dashboard load times from 8 minutes to just 500 milliseconds [4]. For older, less frequently accessed data, regularly audit access logs. Archiving datasets unused for over 30 days can lower costs and improve performance for active data [1][3].
| Storage Strategy | Best Use Case | Performance Benefit |
|---|---|---|
| Read Replicas | High read-to-write ratio (80%+ reads) | Offloads traffic from the primary database [3] |
| Sharding | Dataset exceeds single instance capacity | Enables horizontal scaling and reduces contention [31][3] |
| Materialised Views | Recurring, complex aggregations | Precomputes results for faster responses [6][4] |
| Tiered/Archival Storage | Data unused for 30+ days | Reduces costs and improves active dataset performance [1][3] |
Query performance is no longer a purely technical concern - it is a business-critical capability.- Assim Gupta, CEO, Closeloop [6]
Getting Expert Help for Advanced Optimisation
Using AI and Machine Learning for Data Access Optimisation
When systems grow in complexity, manual tuning often falls short. This is where AI and machine learning step in, offering tools to spot anomalies and predict capacity needs with far greater precision.
Two of the most effective uses are anomaly detection and capacity forecasting. Unsupervised models like isolation forests or autoencoders can continuously monitor metrics such as query latency, cache hit ratios, and error rates. These models excel at identifying unusual patterns long before a human scanning dashboards might notice. Meanwhile, time-series forecasting models - think ARIMA, Prophet, or LSTM - can anticipate storage growth and peak loads. This allows for proactive scaling decisions, ensuring consistent performance without users ever experiencing a slowdown. A great example is Oracle's Autonomous Database, which uses machine learning to adjust indexes, memory allocation, and execution plans automatically, balancing performance and cost.
When implemented effectively, AI can deliver impressive results: p95/p99 query latency reductions of 20–50%, cloud cost savings of 25–60%, and faster recovery times (MTTR). However, these models depend heavily on detailed and accurate observability data to separate meaningful insights from noise. As highlighted earlier, robust observability is the backbone of these AI-driven techniques, enabling measurable improvements and cost savings.
These advanced capabilities also provide a strong foundation for involving external experts to fast-track optimisation efforts.
How Hokstad Consulting Helps with DevOps Data Optimisation
While AI-driven tools can transform data access optimisation, expert guidance can take your efforts even further. Tackling complex challenges, particularly in distributed or multi-cloud setups, often requires specialised expertise - something not always available in-house, especially for already overstretched teams.
Hokstad Consulting specialises in helping businesses refine their DevOps processes and cut cloud costs, with a focus on improving data access performance. Their approach begins with an in-depth assessment of observability and data access. This involves analysing query patterns, database schemas, and microservices to create a prioritised KPI roadmap. From there, they implement solutions like CI/CD performance gates, infrastructure-as-code templates for databases and caches, and automated regression checks to catch performance issues before they hit production.
Their cloud cost engineering services directly connect performance improvements to financial savings. By analysing expenses on managed databases, object storage, and analytics tools, they provide recommendations on right-sizing, storage tiering, and committed-use options. These efforts typically yield savings of 20–40%. For organisations looking to adopt AI-driven optimisation, Hokstad Consulting designs AI agents that detect data-access anomalies, suggest query and index improvements, and forecast capacity needs. These tools integrate seamlessly with the chat and pipeline systems UK teams already rely on, all while adhering to UK GDPR and data residency requirements.
By partnering with experts, businesses can cut implementation time from months to weeks, avoiding common missteps like over-provisioning.
Building a Long-Term Data Access Optimisation Practice
Achieving lasting results in data access optimisation requires a well-defined, ongoing strategy.
Start by assigning clear ownership. Designate a performance lead or establish a dedicated team to oversee optimisation efforts. Define specific SLOs (Service Level Objectives) for critical metrics like p95 latency, cache hit ratios, and error budgets. Incorporate automated checks into your CI pipelines to make optimisation a routine part of development. This aligns with the continuous improvement practices discussed earlier.
To secure stakeholder support, tie optimisation work directly to business outcomes. Framing improvements as £ savings in cloud spend or revenue gains from reduced latency is far more compelling than simply reporting technical metrics like milliseconds saved. Automated performance testing in CI pipelines, combined with regression thresholds - for instance, flagging builds where p95 latency worsens by more than 10% compared to the previous release - shifts optimisation from being reactive to a proactive, integral part of software development.
Conclusion
This guide has explored how refining data access can boost both performance and cost efficiency. Missteps like unnecessary scans, excessive data shuffling, and oversized queries can drain resources, with estimates suggesting that 25–50% of Data Cloud costs stem from inefficient designs and poorly optimised queries [32].
Techniques such as embedded observability, CI/CD performance gates, and tiered storage demonstrate how small, targeted adjustments can lead to meaningful gains. Regularly fine-tuning queries has been shown to significantly cut execution times and reduce compute expenses [6].
A shift is also taking place as DevOps and FinOps increasingly overlap. Cost considerations are now being addressed earlier - during pull requests and infrastructure planning - rather than surfacing later in monthly invoices. Framing optimisation efforts in terms of £ savings and measurable business outcomes can help secure ongoing support from stakeholders, making performance improvements a consistent focus.
Whether you're beginning with basic observability or moving towards AI-driven anomaly detection, having clear benchmarks and defined ownership is key to achieving sustainable progress rather than constantly reacting to issues.
FAQs
Which 3–5 data access metrics should we track first?
To maintain reliable data and reduce disruptions, begin by monitoring data downtime, freshness, and anomaly detection for changes in volume and schema. These metrics play a crucial role in spotting and resolving issues that might affect workflows or compromise the quality of your data. Focusing on these areas ensures smoother operations and better decision-making.
How can we add query performance checks to CI/CD without delaying releases?
To keep query performance in check without slowing down releases, consider using automated performance baseline testing. This method lets you compare execution times for critical queries before and after changes, ensuring efficiency is maintained. Incorporating tools like EXPLAIN or ANALYSE helps analyse execution plans and catch performance dips early.
For faster testing, you can rely on ephemeral test databases (such as those created with Docker), which allow quick and isolated checks. Additionally, AI-powered systems can proactively highlight potential issues, giving you an extra layer of assurance. These approaches let you prioritise performance monitoring while keeping deployment schedules on track.
When should we use caching vs partitioning vs read replicas?
The decision hinges on your specific workload and performance objectives. Caching is a go-to for cutting down latency when dealing with frequently accessed data. Partitioning, on the other hand, helps improve query efficiency by breaking up large datasets into smaller, more manageable chunks. Meanwhile, read replicas come into play when scaling read workloads, as they distribute queries across multiple instances.
Often, these methods are used together, depending on factors like the balance of read and write operations, the size of the data, and how quickly responses are needed. For instance, caching is ideal for boosting speed, partitioning works well for handling large tables, and replicas are perfect for managing high volumes of read requests.