If you need to track SLA uptime, latency, alerts, and incident response, I’d split these 10 tools into three simple groups: low-cost external monitoring, full-stack observability, and cloud-native platform tools.
In plain terms, here’s the shortlist:
- For start-ups: Better Stack, Pingdom, and Checkly keep setup light and pricing easier to follow.
- For growing teams: Datadog, New Relic, and Grafana Cloud give you uptime checks, APM, traces, logs, and SLO views in one stack.
- For cloud-first estates: AWS CloudWatch, Azure Monitor, and Google Cloud Operations Suite work best when most of your services already sit on one cloud.
- For large mixed estates: Dynatrace stands out when you need root-cause context, tracing, and incident grouping across lots of services.
The article compares each tool on the same four points:
- Uptime checks - API, browser, and endpoint probes
- Alerting - thresholds, routing, and incident links
- Latency views - p95/p99 charts, traces, and dashboards
- Pricing fit - per-host, per-user, per-check, or per-GB cost
What this means for you is simple: if your SLA is mostly about external uptime proof, tools like Pingdom or Better Stack may be enough. If you also need p95 latency, error budgets, and service-level dashboards, you’ll likely look at Datadog, New Relic, Grafana Cloud, or Dynatrace. And if you already live inside AWS, Azure, or GCP, the native suites can keep cost and setup simpler at first.
::: @figure 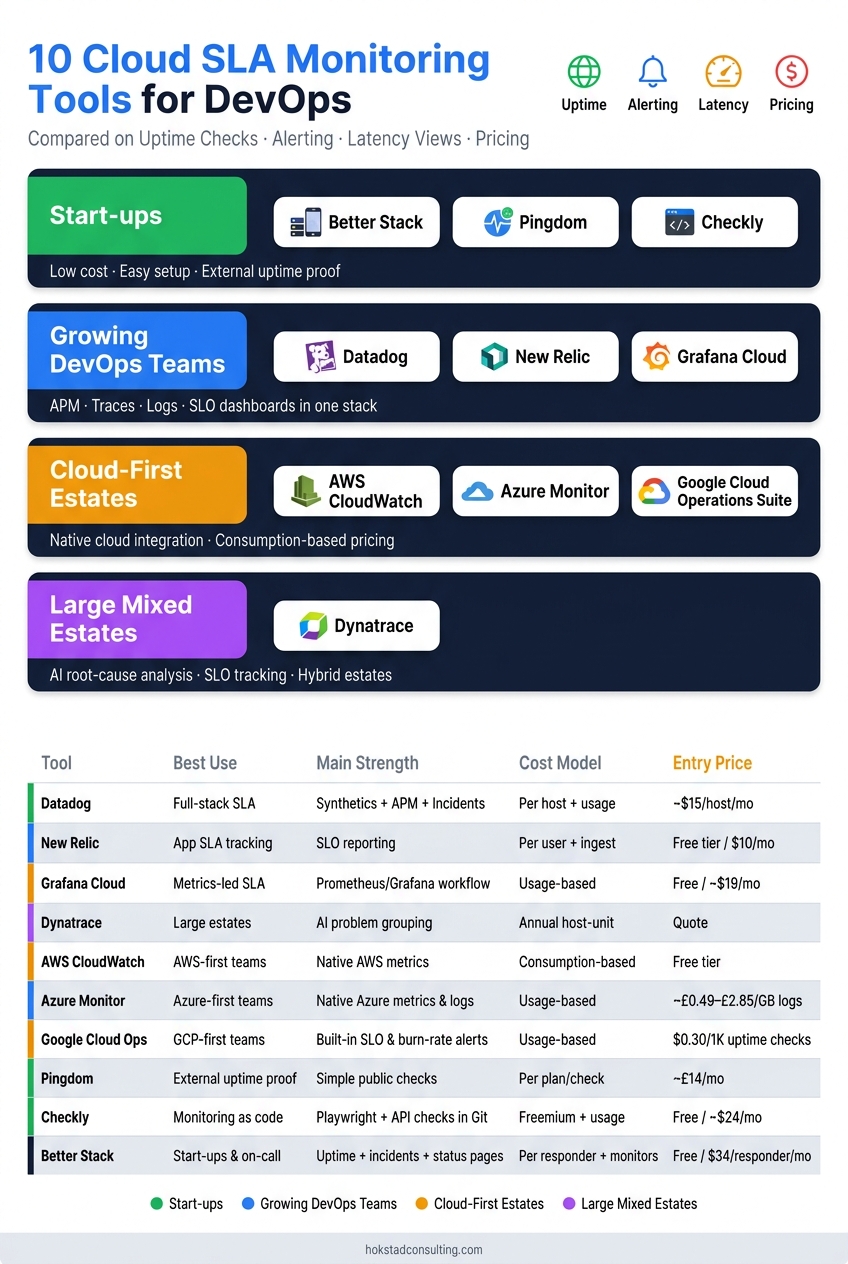 {10 Cloud SLA Monitoring Tools Compared: Features, Pricing & Best Fit}
:::
{10 Cloud SLA Monitoring Tools Compared: Features, Pricing & Best Fit}
:::
Episode 122 - SLA Compliance - Availability Tracking and Guarantees
Quick Comparison
| Tool | Best use | Main strength | Main cost pattern |
|---|---|---|---|
| Datadog | Full-stack SLA monitoring | Synthetics + APM + incidents in one place | Per host + usage |
| New Relic | App SLA tracking | SLO reporting + usage-based entry | Per user + ingest |
| Grafana Cloud | Metrics-led SLA dashboards | Strong Prometheus/Grafana workflow | Usage-based |
| Dynatrace | Large estates | AI-led problem grouping and tracing | Annual / host-unit style |
| AWS CloudWatch | AWS-first teams | Native AWS metrics and canaries | Consumption-based |
| Azure Monitor | Azure-first teams | Native Azure metrics, logs, and workbooks | Usage-based, logs-led |
| Google Cloud Operations Suite | GCP-first teams | Built-in SLO and burn-rate alerts | Usage-based |
| Pingdom | External uptime proof | Simple public checks and reports | Per plan / per check |
| Checkly | Monitoring as code | Playwright and API checks in Git workflows | Freemium + usage |
| Better Stack | Start-ups and on-call workflows | Uptime + incidents + status pages | Per responder + monitors |
My quick take: if you want the shortest path to broad SLA coverage, start with Datadog or New Relic. If you want lower entry cost and more control, look at Grafana Cloud or Checkly. If your need is mostly public uptime proof, Pingdom and Better Stack are often enough.
That gives you the full picture up front before you go tool by tool.
1. Datadog
Datadog is a unified observability platform with strong SLA monitoring features. It brings together synthetic monitoring, APM, infrastructure metrics, logs, and incident workflows in one place. For DevOps and SRE teams, that means better SLA visibility without having to bounce between several tools.
Uptime checks
Datadog's Synthetic Monitoring runs API, multistep, and browser checks against key endpoints and user journeys, such as login or checkout, from multiple global locations. So instead of relying only on internal health checks, teams get availability data based on actual service paths.
For SLA tracking, Datadog includes uptime and SLO widgets that show how often targets have been missed over periods such as a week, month, year, or month-to-date.
Alerting and incidents
Datadog supports a wide range of monitor types, including metric, anomaly, forecast, and SLO monitors. These can alert teams when error budgets are being used up too fast.
When a monitor fires, teams can open an incident straight from the alert. From there, they can assign an owner, start a timeline, and notify responders inside Datadog's incident management workflow. Alerts can be routed to Slack, PagerDuty, email, or webhooks, which works well for UK teams running 24/7 on-call rotations.
Datadog's Watchdog AI also helps spot performance anomalies automatically.
Latency and dashboards
APM adds per-service dashboards for throughput, errors, and p95/p99 latency charts. Flame graphs break down request latency across services, databases, and caches, which makes it easier to pinpoint where time is being lost.
Pricing and team fit
Datadog's pricing is modular and usage-based. That's a big part of its appeal, but it's also where things can get expensive.
Infrastructure monitoring starts at $15 per host per month billed annually ($18 month-to-month and on-demand).[7][1] Synthetic API tests cost about $5 per 10,000 runs, and browser tests cost around $12 per 1,000 runs on annual commitment.[8][9][10] Once you add APM, logs, and synthetic checks across several environments, the bill can climb fast.
For start-ups, Datadog works well when fast setup and broad coverage matter more than keeping monthly costs flat. A sensible approach is to focus on a small set of business-critical services and keep synthetic coverage limited to the most important locations.
For larger enterprises, Datadog suits multi-cloud and hybrid setups well. Still, teams need to keep a close eye on telemetry volume and synthetic test frequency if they want spend to stay predictable. That broad platform appeal is a big draw, though the next tools make different trade-offs on scope and cost.
2. New Relic
New Relic brings together synthetic monitoring, SLI/SLO reporting, and usage-based pricing in a single observability platform. For teams that want SLA reporting, alerting, and dashboards in one place, that’s a strong setup.
Uptime checks
New Relic’s synthetic monitoring covers four monitor types: ping monitors, scripted API tests, scripted browser tests, and step monitors.[11][19] Checks can run from multiple global locations, including European regions, and from private locations for internal services behind VPNs or inside VPCs.[20]
Synthetic SLA reports work out uptime as the percentage of successful monitor results. You can view this daily, weekly, or monthly, which makes SLA reporting much easier over set reporting periods.[16][20] Achievers, a global employee experience platform, used New Relic’s service level management to standardise SLIs and SLOs and reached 99.95% SLA uptime.[25]
Alerting and incidents
Alert conditions can be written in NRQL, New Relic’s query language, so teams can trigger alerts based on uptime percentages, error rates, or latency percentiles linked to SLO thresholds.[13] Incidents can be grouped by policy, condition or entity, which helps when you’re dealing with microservices and service-specific SLAs.[15] Notifications integrate with Slack, PagerDuty, and email.[14]
Latency and dashboards
APM shows p50, p95, and p99 latency for each route or endpoint, while distributed tracing helps teams spot where time is being spent across service calls.[14][18] Teams can build service-level dashboards to track SLIs and SLO attainment by service, along with executive dashboards that sum up uptime and performance across customer-facing services.[17]
Pricing and team fit
New Relic uses a usage-based pricing model, with data ingest and user counts as the main cost drivers.[12][23] The free tier includes 100 GB a month of ingest and one full-platform user, which is enough for a small start-up tracking a handful of SLA-critical services.[12]
Pricing then steps up from there:
- Standard starts at US$10/month for the first full user, with extra full users at US$99/month.[21]
- Pro is US$349 per user per month on an annual commitment.[22]
- Enterprise pricing is negotiated.[24]
Because pricing is in US dollars, UK teams need to factor in currency conversion.
For start-ups, the free and Standard tiers give a sensible way in, especially if the team is new to APM and SLI/SLO tracking. For larger enterprises, the model can help reduce tool sprawl, but ingest volumes need close attention as monitoring expands across more services and environments. If your team leans more towards dashboards first, the next option may feel like a better fit.
3. Grafana Cloud
Grafana Cloud is built around the LGTM stack: Loki for logs, Grafana for visualisation, Tempo for traces, and Mimir for metrics. It’s delivered as a managed service with usage-based pricing, not per-host licences.[36][45] That makes it a good fit for teams already working with Prometheus and PromQL. Its strongest angle is flexible, metrics-led SLA reporting, rather than a big all-in-one platform.
Uptime checks
Grafana Cloud’s Synthetic Monitoring runs black-box checks against HTTP/HTTPS endpoints and APIs from multiple global probe locations, so you don’t need to manage Blackbox Exporters yourself.[32][44] Uptime is calculated as the percentage of reported time points with at least one successful probe, which makes it well suited to SLA reporting.[27]
Results are stored as Prometheus metrics and Loki logs, so the same data can feed dashboards, alerts, and SLO tracking without extra plumbing.[42][43] For UK teams, running probes from both EU and US regions at the same time helps separate a full outage from a region-specific slowdown or routing issue.[32]
Alerting and incidents
Grafana Alerting evaluates rules centrally across metrics, logs, traces, and synthetic checks.[34] Teams can set conditions like uptime over 15 minutes < 99% or p95 response time > 1,500 ms and send triggered alerts through Grafana OnCall.[32][34]
One useful detail is that alert notifications include links to the right dashboards and traces. So when something breaks, responders can go straight to the data instead of clicking around several tools to piece the story together.[32][34]
Latency and dashboards
Grafana Tempo can automatically generate RED metrics - Rate, Errors, Duration - from traces, which gives teams latency and error visibility without needing a separate metrics backend.[46][47] Synthetic monitoring also adds time-series response time data, usually shown in p50, p90, and p95 panels.
A solid SLA dashboard usually brings a few things together in one view:
- Uptime
- Current status
- Latency trends
- Incident annotations
That mix gives teams both the headline number and the context behind it.[26][28]
Pricing and team fit
Grafana Cloud’s free tier is permanent. It includes around 10,000 active metric series, 50 GB per month of logs, and 50 GB per month of traces, with roughly 14-day retention.[29][48]
The Pro tier starts at around US$19/month as a base platform fee, then adds usage-based charges - about US$6.50 per 1,000 active metric series and US$0.50–0.55 per GB of logs ingested - with 30-day log retention.[37][38][40][41] Enterprise plans are annual commitments, quote-only, and aimed at larger organisations that need custom retention, premium support, and compliance options.[30][39]
If you want to keep spend under control, the big levers are pretty simple: watch metric series counts, log volume, and synthetic check frequency.[30][31][35]
Teams that want deeper automated correlation across services can compare the next platform.
4. Dynatrace
Dynatrace is a full-stack observability and AIOps platform with strong SLA monitoring. Some tools lean more on alerts or dashboards. Dynatrace stands out when you also need root-cause context in the same place. That’s a big deal when uptime, latency, and incident context all need to live in one workflow.
Uptime checks
Dynatrace handles uptime checks in three main ways:
- Synthetic checks for HTTP and browser monitoring, run from global locations on a continuous schedule
- Auto-created monitors for the top three user entry paths of a web application, running 24/7 from three locations every 15 minutes [52]
- Network availability checks (NAM) for Ping/ICMP, DNS, and TCP reachability on services that don’t have an HTTP endpoint
That setup keeps uptime monitoring closely linked to SLO tracking.
Alerting and incidents
Davis AI groups related anomalies into a single problem record with dependency context. In plain terms, that means less alert noise and faster triage. WeLab Bank reports that Davis AI cuts root-cause identification from hours to minutes. Problem records can also flow into ticketing or ChatOps workflows, so SLA-related incidents show up with the context teams need from the start.
Latency and dashboards
PurePath distributed tracing follows transactions across services, databases, and external dependencies. So when something slows down, teams can trace the issue from the symptom to the exact service or dependency behind it. Dashboards built on Grail and DQL bring together SLO status, response-time trends, and error rates in one view.
Pricing and team fit
On pricing and fit, Dynatrace uses host-unit licensing, with separate usage metering for synthetics, and this is usually sold on annual commitments. [49][51][50] It’s a strong match for medium to large SRE and platform teams running distributed cloud apps that want AI-assisted triage and SLO tracking in one platform.
5. AWS CloudWatch
For teams that live mostly in AWS, CloudWatch keeps SLA data close to the platform. AWS CloudWatch is AWS’s native observability service, and it can pull in metrics, logs and events from your resources. If most of your workload already runs on AWS, that setup feels natural. It’s a better fit for AWS-first teams than for teams that need broad multi-cloud coverage. [56][59][69]
Uptime checks
For uptime checks, CloudWatch Synthetics canaries handle active endpoint testing. These scripted checks run against HTTP/HTTPS endpoints and APIs on a schedule, so you can test login flows, multi-step API calls, or other key user journeys while tracking availability and latency. For high-priority paths, canaries can run every minute, which gives near-real-time visibility. Pairing them with Route 53 health checks gives you an extra layer of active end-to-end monitoring. [63][60][57]
Alerting and incidents
For alerting, CloudWatch Alarms can kick off SNS notifications and incident workflows. They evaluate metrics or anomaly detection rules, then trigger actions through Amazon SNS. From there, notifications can go to email, chat workflows, ticketing systems, or downstream automation. CloudWatch also connects natively with AWS Systems Manager Incident Manager, so an alarm can automatically open an incident and attach response plans as soon as it fires. To cut down false positives, it helps to use multi-period evaluation - say, 3 of 5 datapoints in breach - instead of firing on a single threshold breach. [55][58]
Latency and dashboards
For latency tracking, CloudWatch surfaces service-level metrics across core AWS services. You can view latency across API Gateway, RDS/Aurora, DynamoDB and EBS. In practice, dashboards work best when they focus on the four golden signals:
- latency
- traffic
- errors
- saturation
That keeps the view simple and puts the main SLA signals front and centre. [61][62][64][65][66][68]
Pricing and team fit
CloudWatch uses consumption-based pricing, with separate charges for metrics, log ingestion and storage, alarms, dashboards, and Synthetics canary runs. There’s a free tier, which gives smaller teams room to get started with light usage. But costs can climb as log volume grows, custom metrics pile up, and canaries run more often. It’s a strong match for AWS-first start-ups and platform engineering teams that want observability close to the cloud stack. Teams spread across multiple providers will usually need a broader tool for SLA reporting across platforms. [53][54][67]
6. Azure Monitor
If AWS-native monitoring makes sense for AWS-first estates, Azure Monitor is the natural choice for Azure-heavy and hybrid setups. It brings metrics, logs, traces, and events into one place for workloads that range from virtual machines to web apps and APIs.[70][85]
Uptime checks
Azure Monitor handles uptime with Application Insights availability tests. These are synthetic probes that send requests to your endpoints from multiple regions on a set schedule.[81][83]
You can choose how often tests run, define success checks such as HTTP 200, and set timeout limits. From there, you can alert on failures or slow responses. That gives teams a way to spot an availability issue before it starts affecting SLA reporting. For VM-based services, the VM availability metric also supports alerts at resource group or subscription level.[82][84]
Alerting and incidents
Alert rules can evaluate metrics, log queries, or activity events, then trigger action groups when a threshold is hit.[73][75][77] Those action groups can:
- Send notifications
- Trigger webhooks
- Run Functions
- Start Logic Apps workflows
- Launch Automation runbooks
For teams using Azure DevOps or GitHub Issues, Azure Monitor can also create work items on its own. So if response time slips, that breach can turn straight into a tracked bug or task with severity and tags already filled in.[72][74][86][87]
Once that plumbing is in place, the next step is simple: can the dashboard show latency well enough to explain why an alert fired?
Latency and dashboards
Application Insights records request duration, dependency call times, and exception data. That helps teams work out whether latency is coming from a slow database query or a third-party API call.[71][74]
You can pin metric charts to Azure portal dashboards, or use Workbooks for richer interactive views. Workbooks can combine metrics, KQL log queries, and resource graph data, with filters for region or environment.[74][77]
A solid SLA dashboard might include:
- Average response time
- p95 latency
- Request success rate
- Dependency duration
That gives teams one view of service health and SLA risk, instead of making them hop between screens.
Pricing and team fit
Azure Monitor uses usage-based pricing, while platform metrics are included at no extra cost.[76][78] Log ingestion is the main cost driver. Pay-as-you-go Analytics Logs cost about £0.49 to £2.85 per GB, with the first 5 GB per month free.[76][78]
If you're dealing with high log volume, lower-cost options such as Basic Logs and Auxiliary Logs can help keep spend under control. Commitment tiers at 100, 200, or 500 GB/day can also lower the effective per-GB rate once usage becomes steady.[79][80]
It suits Azure-first teams of all sizes, from small start-ups to large enterprises. In plain terms, it works for both lean teams and larger Azure estates.
7. Google Cloud Operations Suite
Google Cloud Operations Suite is Google Cloud’s native observability platform for monitoring, logging, tracing and alerting. It tends to work best in GCP-first estates. In day-to-day use, the main test is simple: do those checks, alerts and SLOs help the team spot issues early and act on them without a lot of noise?
Uptime checks
The suite supports both public and private uptime checks across HTTP, HTTPS and TCP endpoints.[91][2] Public checks are a good fit for customer-facing APIs, websites and load balancers. Private checks can reach internal services running on VMs or internal load balancers, which is useful for teams watching back-office microservices against internal SLAs.[2]
For testing that feels a bit closer to actual user flows, synthetic monitors run as scheduled Cloud Run-based synthetic checks that record success, failure and latency.[96] A sensible rule of thumb is to use high-frequency synthetic checks only for your most business-critical paths, then rely on standard uptime checks elsewhere so costs don’t creep up.
Alerting and incidents
Alerting policies can trigger on metrics, uptime check failures or SLO error-budget burn rate.[88][92] The burn-rate method helps cut noise and keeps the focus on events that affect users.[95] Alerts can be sent to notification channels and tied into incident workflows, with documentation links included so on-call engineers get useful context with the alert itself.
Built-in SLO support tracks availability and latency targets in real time and alerts on error-budget burn.[94][95] That makes the suite a good match for SRE-style operations. In practice, those alerts should take engineers straight into the same SLA view they use to diagnose the issue.
Latency and dashboards
Dashboards bring together uptime metrics, request latency, error rates and SLO compliance in one view.[93] From there, teams can move from SLA status into traces and logs to find slow dependencies, regions or deployments.
Pricing and team fit
Uptime checks cost US$0.30 per 1,000 executions, with 1,000,000 executions per project included at no cost.[89][90] Log ingestion, high-cardinality metrics and long retention periods can push the bill up further, so it’s worth checking expected telemetry volume before you commit.
Best for GCP-first teams that want native SLO and alerting controls.
8. Pingdom
While cloud-native tools show you what’s happening inside your platform, Pingdom gives you the outside view. It monitors your service the way a customer would see it, which makes it useful for tracking external SLAs.
Uptime checks
Pingdom runs HTTP/HTTPS uptime checks from more than 100 locations around the world, with checks available as often as once per minute.[98][99][100][101] It goes beyond a simple up-or-down test too. You can watch HTTP status codes, error messages and page content changes, which helps if your SLA depends on rules like no 5xx errors or a page showing required content.[101]
If Pingdom spots downtime, it can also run traceroute, status-code checks and output capture to help you work out what went wrong a bit faster.[98][104]
Alerting and incidents
Alert policies let you choose who gets notified, how they get notified and when alerts should fire. Pingdom supports SMS, email, push notifications and webhooks, plus links with Slack, PagerDuty and SolarWinds Incident Response.[97][110][111][112]
It also includes on-call schedules and maintenance windows, which can cut down alert noise during planned releases. If you use SolarWinds Incident Response, Pingdom can create an incident from an alert automatically, and when the alert is cleared, the incident is cleared too.[110][112]
Latency and dashboards
Pingdom records response times for each check, not just whether it passed or failed.[105] That matters because a service can be technically up while still being slow enough to upset users.
Its uptime reports cover:
- uptime and downtime
- response time
- outage lists
- root cause notes
These reports can be exported as PDF or CSV.[102] For user-side data, RUM records page-load times and location breakdowns.[103] You can also schedule email reports, which is handy if your team reviews SLAs on a calendar-month basis.[102]
Pricing and team fit
Pingdom sells Synthetic Monitoring and RUM as separate subscriptions. There’s no permanent free tier, but there is a 14-day trial.[106][108][109] Entry-level synthetic monitoring starts at about £14 per month, or around £155 per year if billed annually. That plan includes 10 uptime checks, one advanced check and 50 SMS alerts.[107][108][109] Adding entry-level RUM costs about another £14 per month for 100,000 pageviews.[108][109]
For UK start-ups, Pingdom is a good fit when you need clear, shareable SLA reporting from an external point of view without putting together a full observability stack. The uptime reports are easy to share as SLA evidence. Bigger teams will still want tracing and deeper infrastructure visibility from other tools, so Pingdom often works best as a light extra layer in a broader monitoring setup.
9. Checkly
For teams that want monitoring to sit inside version control, Checkly puts SLA checks right into the delivery workflow. It focuses on service behaviour, not just whether an endpoint is up. Because it uses a code-first setup, checks live in the same repo and are versioned alongside releases. That means the same checks, alerts and failures remain auditable, which is handy when uptime, alerting and incident evidence need to stay tied to the codebase.
Uptime checks
Checkly supports URL/HTTP, TCP, ICMP (ping), DNS and heartbeat monitors for SLA checks.[119] Where it stands out is in multi-step synthetic checks. Its Playwright-based browser checks can test full user journeys like login, sign-up or checkout, while API checks can run from 22 global locations as often as every 10 seconds.[120] If your team already uses Playwright, you can reuse existing scripts for production monitoring.[115][118]
Alerting and incidents
Checkly includes 18+ alert channels, such as Slack, Teams, email, SMS and webhooks, plus incident-management integrations like incident.io, Rootly and FireHydrant.[126] Failed checks can trigger incidents automatically. You can also set alerts for failure, slow responses, recovery and SSL certificate expiry, with reminders every 5, 10, 15 or 30 minutes until recovery.[125][126]
Latency and dashboards
Its dashboards show average, p95 and p99 response times across time ranges from 1 hour to 30 days.[122][123] When a browser check fails, Checkly records screenshots, video, traces, console logs and network requests, which makes debugging much less of a scavenger hunt.[113] It also exports metrics through Prometheus and OpenTelemetry, so it can feed into a broader observability stack.[127][124]
Pricing and team fit
Checkly uses a freemium model. The free Hobby plan includes 10 uptime monitors, 1,000 browser runs and 10,000 API runs per month.[5][116][121] Paid plans start at about US$24 per month for Starter and US$64 per month for Team on annual billing. The Team plan adds 22 locations, 30-second check intervals and private locations.[5][121][116]
One thing to watch: browser runs cost more than API checks, so teams running frequent Playwright journeys across multiple regions can hit paid tiers fairly fast.[114][117] It fits small teams that want code-first SLA checks, and larger teams that want monitoring to live inside engineering workflows. That code-first model changes where Checkly sits in the stack.
10. Better Stack
Where some earlier tools go deep in one area, Better Stack leans into consolidation. It brings uptime monitoring, incident management, on-call scheduling, status pages, logs, metrics, and traces into one platform.[132][135]
Uptime checks
Better Stack covers a wide spread of checks: HTTP/HTTPS, ping, TCP/UDP, DNS, SSL certificate expiry, domain health, SMTP, POP3, and IMAP. It also includes heartbeat monitors for cron jobs and background workers.[6][131][137]
On paid plans, check intervals go as low as 30 seconds. Checks run from multiple global locations, and Better Stack uses multi-location confirmation, so one flaky probe is less likely to set off a false alarm.[6][133][135] That matters in practice. A single failed check is annoying; a flood of noisy alerts at 03:00 is worse.
It also supports Playwright-based transaction monitoring. So instead of checking only whether an endpoint responds, you can test full user journeys such as signing in, adding items to a basket, and checking out.[131]
Alerting and incidents
When checks fail, Better Stack creates incidents and pages the on-call responder.[129][135][138] Alerts can go out by phone, SMS, email, push notifications, Slack, and webhooks. Many plans also include unlimited global phone and SMS alerts.[130][132][134]
Teams can set multi-location failure rules, such as alerting only if three out of five locations fail. That helps cut noise without letting actual outages slip by.[137] Incidents can also be acknowledged, assigned, and resolved inside Slack or Microsoft Teams, which keeps the response flow in tools engineers already use day to day.[132][139]
Latency and dashboards
Every failed check records response time data, error screenshots, and a second-by-second incident timeline. That gives you a clear view of when the issue started and how long it lasted.[128][133][135]
One of Better Stack’s big selling points is that logs, metrics, traces, and uptime events sit together in one place, with one query view. So if a downtime alert lands, you can jump straight into related application logs or infrastructure metrics without hopping between tools.[135][137] That’s often the difference between a neat workflow and a messy one.
Teams can also build dashboards for:
- Uptime percentages
- Latency trends
- Incident counts per service
Those dashboards are handy for internal SLA reporting and customer-facing status pages.[135][136]
Pricing and team fit
The free plan includes 10 monitors, 10 heartbeats, and one status page, with 3-minute check intervals.[128][6][142] That is enough for small projects or early-stage start-ups that want basic SLA visibility.
On-call and incident management costs US$34 per responder per month, or US$29 on annual billing. Extra monitor capacity is sold separately, at roughly US$0.21 per monitor per month at scale.[140][141][143] For smaller teams, the free tier is a decent starting point. Larger teams need to weigh responder-based pricing against the upside of managing fewer tools.
For complex multi-cloud or hybrid estates, Hokstad Consulting can help assess fit against DevOps and cloud cost goals.
Its main trade-off is breadth versus specialist depth, which the summary table below makes clearer.
Pros and Cons at a Glance
Use this table to trim your shortlist before moving to the final recommendations.
Quick comparison table
| Tool | Pros | Cons | Best For |
|---|---|---|---|
| Datadog | Unified observability across infrastructure, APM, logs, and synthetics; 700+ integrations; strong alerting[149] | Per-host and per-GB pricing adds up fast - infrastructure starts at about US$15/host/month, APM at about US$31/host - and proprietary workflows can create lock-in risk[168][170][173] | Mid-size to large teams that are happy to pay more to cut down tool sprawl |
| New Relic | Full-stack observability; generous free tier (around 100 GB/month ingest); strong APM and Synthetics[167][172] | Per-user licensing for full access; data ingest costs climb at scale; free-tier retention is limited for some telemetry types[171][172] | Product and platform teams with strict application SLAs |
| Grafana Cloud | Generous free tier; open-source friendly; supports metrics, logs, and traces; around 100,000 synthetic check executions/month free[33][148] | Steeper learning curve (PromQL, LogQL, TraceQL); weaker out-of-the-box APM than Datadog; needs hands-on configuration[148][152] | Engineering teams comfortable with observability tools and query languages |
| Dynatrace | Davis AI for automated root-cause analysis; OneAgent for auto-discovery; strong hybrid and on-prem support[50][166][169] | Consumption-based billing is tough to forecast; an 8 GiB host costs about US$58/month for full-stack monitoring; can feel heavy for smaller teams[50][166] | Large enterprises with heterogeneous estates that need deep, automated insights |
| AWS CloudWatch | Deep native AWS integration; pay-as-you-go with a free tier; no separate licence fee[53][154] | Multi-dimension pricing across metrics, log ingestion, dashboards, and queries can make costs hard to read[154][155][156] | Teams fully committed to AWS and looking for minimal set-up friction |
| Azure Monitor | Azure-native; tight IAM alignment; straightforward for Azure workloads[157][158] | Log Analytics ingestion starts at about US$2.30–2.76/GB after a free 5 GB/month; high-volume logging gets expensive fast[157][159] | Organisations running mainly on Azure that need out-of-the-box SLA alignment |
| Google Cloud Operations Suite | Basic GCP metrics included at no extra charge; simple set-up for GCP-centric teams[160] | Less feature-rich than dedicated multi-cloud tools; advanced observability still needs configuration[160] | Teams heavily invested in GCP that want cost-effective baseline monitoring |
| Pingdom | Established uptime monitoring; simple setup; reliable alerts and status pages[149][153][163] | Per-check pricing gets expensive at scale; limited scripting and performance analytics[149][153][165] | Teams that need straightforward external uptime checks for public endpoints |
| Checkly | Developer-centric monitoring as code; multi-step API and Playwright browser checks; strong CI/CD integration[4][121][150] | No APM or infrastructure monitoring; JavaScript and Playwright skills are needed; cost grows with check volume[121][150][151] | DevOps teams that want programmable synthetic monitoring inside CI/CD pipelines |
| Better Stack | All-in-one uptime, incident management, on-call scheduling, and status pages; polished UI; generous free tier; multi-location confirmation cuts false alarms[3][147][161][162][164] | Per-monitor pricing gets expensive beyond 100+ monitors; limited deep server-side metrics such as P95 latency[3][144][145][146][147] | Start-ups and growing teams prioritising incidents and on-call workflows |
The conclusion turns these trade-offs into team-by-team recommendations.
Conclusion
Best fits by team size and monitoring priority
After looking at coverage, alerting, latency, and price, the simplest way to choose comes down to scale.
Start-ups on tighter budgets will usually do well with Better Stack, Pingdom, or Checkly. They cover the main SLA proof needs without a heavy setup burden. If your team already runs on AWS, CloudWatch gives you basic SLA visibility inside your current estate.
Growing DevOps teams that have moved past basic uptime checks should focus on Datadog, New Relic, or Grafana Cloud. These three bring infrastructure metrics, APM, distributed tracing, logs, and SLO dashboards into one place, while still keeping spend easier to plan. Grafana Cloud makes sense for teams that don’t mind a bit more setup in return for extra flexibility.
Larger organisations with complex multi-cloud or hybrid estates should put Dynatrace, Datadog, or the native cloud suites first: AWS CloudWatch, Azure Monitor, and Google Cloud Operations Suite. Dynatrace fits estates where hundreds of services need the same SLO policies across the board. Azure Monitor is the obvious fit for organisations deep in Microsoft's ecosystem, especially when Azure DevOps and ITSM connectors matter for governance.
Final selection points
If two tools seem neck and neck, five checks can help make the call.
Look at each option through the same lens:
- uptime coverage
- incident routing
- latency visibility
- dashboard usability
- pricing model
This matters because per-host, per-check, and data-ingestion pricing can behave very differently once usage climbs. Before you commit, map costs in GBP against your actual usage, not rough estimates.
Tool choice shapes deployment, incident response, and spend. For help lining up monitoring with DevOps transformation, cloud cost engineering, and automation goals, Hokstad Consulting can help.
FAQs
Which tool suits a small DevOps team best?
For small DevOps teams, tools like Netdata or Sematext are often a good fit. Their automatic service discovery cuts down manual setup, which can save smaller organisations a fair bit of time.
It also helps to focus on tools with unified dashboards and real-time alerts. Open-source options can keep licensing costs down, while automated resource management helps teams stay efficient as infrastructure grows.
How should I estimate SLA monitoring costs?
Estimate SLA monitoring costs by looking at both tool pricing and the day-to-day cost of handling telemetry data. Check if the vendor charges by data volume, per-node metrics, or host counts.
It also helps to look past the sticker price. Hidden costs can creep in through data egress fees, API call limits, and storage charges for high-volume logs and traces. A total cost of ownership review can also expose internal labour tied to maintenance and customisation.
Do I need full observability or just uptime checks?
Uptime checks are good for tracking basic availability and confirming SLA adherence. But they only tell you whether a service is reachable.
Full observability goes much further. It uses metrics, logs and traces to show why something is failing. That gives DevOps teams the detail they need to spot bottlenecks, connect performance issues and troubleshoot complex distributed systems faster than they could with uptime checks alone.