
If you need clean cloud cost reports in 2026, allocation comes first. From what I’ve seen in this piece, the top tools split into three groups: native cloud billing tools for single-cloud estates, FinOps platforms for multi-cloud and chargeback, and Kubernetes-led tools for cluster-level cost views.
Here’s the short version:
- AWS Cost Explorer + CUR: best starting point for AWS-only reporting
- Azure Cost Management: best for Microsoft-led estates
- Google Cloud Billing Reports: best if you want billing data pushed into BigQuery
- Apptio Cloudability: best for large multi-cloud estates with finance-led chargeback
- CloudHealth: best for policy-led allocation across cloud and VMware
- CloudZero: best for unit economics like cost per customer or per feature
- Finout: best for cloud, SaaS and Kubernetes in one reporting view
- Harness CACM: best if you want cloud, Kubernetes and AI cost reporting together
- Kubecost: best for deep Kubernetes cost allocation
- Vantage: best low-cost option for multi-cloud, SaaS and AI reporting
A few points stand out:
- GBP reporting matters if your finance team works in pounds
- 90–95% tag coverage is a sensible target before using chargeback figures
- Native anomaly detection can miss spend spikes, so alerts need checking
- Shared costs like Kubernetes, logging and networking often need rules, not just tags
- The right pick depends more on your estate and reporting model than on feature count
If I were shortlisting tools from this article, I’d compare them on allocation accuracy, multi-cloud support, Kubernetes detail, AI/SaaS coverage, and finance-ready exports first.
Quick Comparison
::: @figure 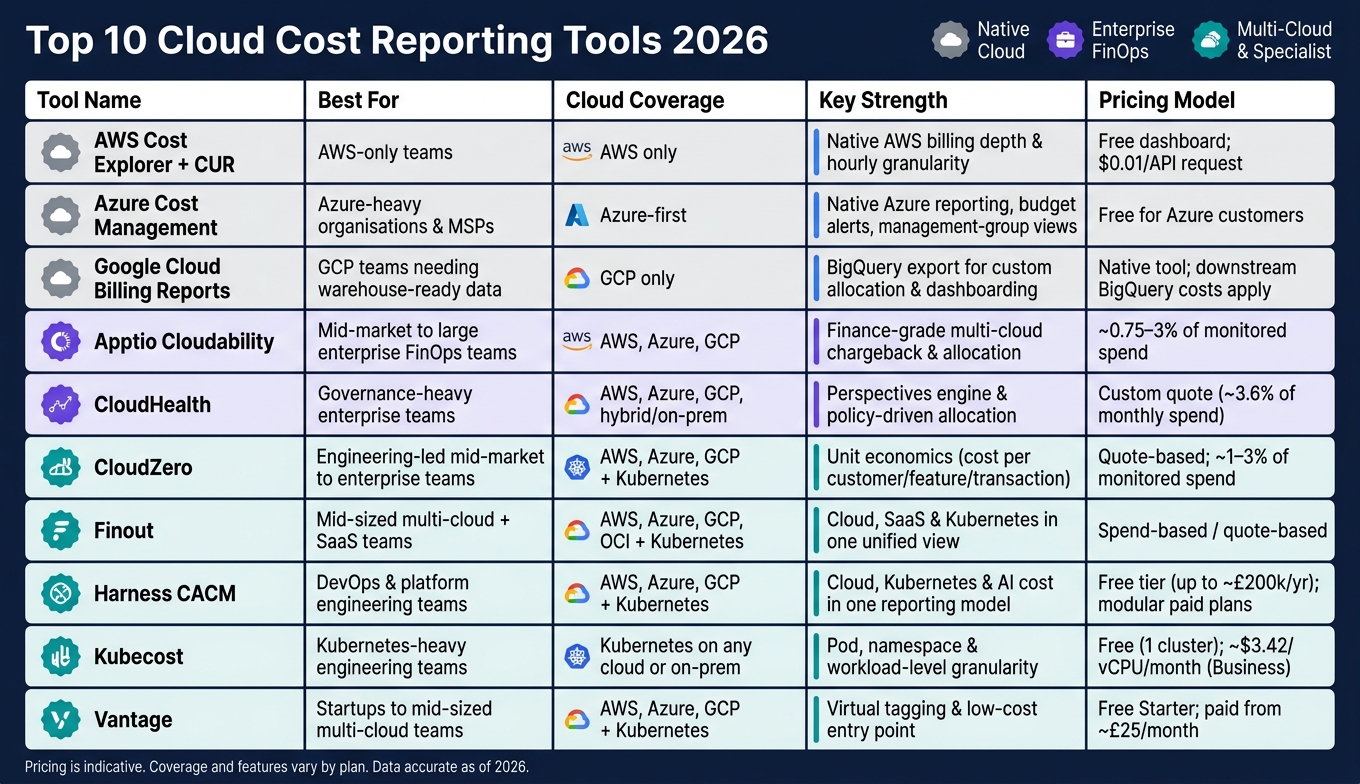 {Top 10 Cloud Cost Reporting Tools 2026: Side-by-Side Comparison}
:::
{Top 10 Cloud Cost Reporting Tools 2026: Side-by-Side Comparison}
:::
| Tool | Best for | Main strength | Main limit |
|---|---|---|---|
| AWS Cost Explorer + CUR | AWS-only teams | Native AWS billing depth | AWS-only |
| Azure Cost Management | Azure-heavy firms | Azure reporting and exports | Tagging gaps hurt reporting |
| Google Cloud Billing Reports | GCP teams | BigQuery export | Shared-cost split needs extra work |
| Apptio Cloudability | Enterprise FinOps | Multi-cloud chargeback | High cost |
| CloudHealth | Governance-led estates | Rule-based allocation | Can be heavy for smaller teams |
| CloudZero | Product and engineering teams | Unit economics | Less finance-led than some rivals |
| Finout | Multi-cloud + SaaS | Cloud and SaaS in one view | Better suited to larger estates |
| Harness CACM | DevOps + AI reporting | Cloud, Kubernetes and AI in one model | Free tier is limited |
| Kubecost | Kubernetes-heavy teams | Pod and namespace cost detail | Narrow scope outside Kubernetes |
| Vantage | Start-ups to mid-sized teams | Virtual tagging and low entry cost | Less depth than enterprise tools |
Bottom line: if you run one cloud, start with the native option. If you need chargeback across cloud, Kubernetes, SaaS or AI, move to a third-party platform. And if your tags are weak, no dashboard will fix the numbers on its own.
Need help optimizing your cloud costs?
Get expert advice on how to reduce your cloud expenses without sacrificing performance.
What to Look for in a Cloud Cost Reporting Tool
Use five criteria: allocation accuracy, audience fit, anomaly detection, integrations, and deployment model.
Allocation Accuracy with Tags, Labels and Cost Centres
This is the bedrock. If cloud spend isn’t mapped cleanly to teams, products, and cost centres, the rest of the reporting falls apart.
A solid tagging schema should cover at least:
-
cost_centre -
environment(prod vs non-prod) -
owner -
application -
project
Those fields should line up with your chart of accounts, so cloud reports reconcile cleanly with your general ledger. Finance teams will push for this, and for good reason.
A good target is 90–95% tagging coverage, and 95%+ on production workloads, before you use allocation data for chargeback or board reporting.[1][6][8] One of the best ways to close the gap is to publish a weekly untagged-spend report. It puts the issue in front of engineering teams instead of letting it drift in the background.
Shared services are where things get messy. Kubernetes clusters, central logging, and shared networking usually can’t be split with tags alone. You’ll want tools that support allocation rules, using usage-based drivers like CPU hours, request counts, or pod counts.
Reporting for Finance, Engineering and Leadership
Different teams need different views of the same spend data.
Finance usually wants monthly GBP summaries. Engineering needs near-real-time drill-downs. Leadership tends to care more about trends, budgets, and direction of travel.
That’s why role-based access control (RBAC) matters. People should see the data that fits their role, not a massive dashboard full of noise. It also helps with governance.
Scheduled PDF and CSV exports are useful too, especially for monthly and quarterly reporting cycles. FinOps summaries and board packs work better when cloud cost reporting fits the reporting habits the business already has.
Forecasting, Budgets and Anomaly Detection
Forecasting, budgeting, and anomaly detection sit near the top of the list for FinOps teams.[7][2]
Budgets should be set at several levels, including:
- account
- subscription
- team
- cost centre
Alerts at 50%, 75%, and 90% of budget limit are a sensible starting point.
Anomaly detection deserves a closer look than many buyers give it. On paper, most tools say they do it. In practice, coverage can vary a lot. One review found that native AWS anomaly detection caught only 31% of true anomalies, with an average 18-day lag.[9] That’s a big miss if you’re trying to stop spend before it snowballs.
A layered setup works better. Combining native alerts with extra tooling can push detection coverage to about 95% or more for major spikes.[9] When you assess alerting, this gap matters.
Exports, APIs and BI Integration
Cloud cost data shouldn’t live in a silo. It needs to move into the systems your teams already rely on.
Look for CSV or Excel exports, stable APIs, and connectors for tools like Power BI, BigQuery, or Looker. In many UK organisations, billing data is pushed into a central data warehouse, then matched with internal cost centre mappings and shown through Power BI dashboards built around the finance team’s existing reporting layout.
Webhooks and event-driven integrations matter as well. If anomaly alerts can land straight in Microsoft Teams or Slack, cost awareness becomes part of day-to-day work instead of something people only see once a month.
Native Billing Tools vs Third-Party FinOps Platforms
Use this split to work out whether a native tool or a FinOps platform makes more sense for your estate:
| Capability | Native Tools (AWS / Azure / GCP) | Third-Party FinOps Platforms |
|---|---|---|
| Cost | Free or low-cost | Subscription or % of spend |
| Multi-cloud support | Single-cloud only | Unified across clouds |
| Allocation logic | Tag-based only | Virtual tagging, rules-based mapping |
| Reporting granularity | Service and account level | Unit economics, namespace, workload |
| Anomaly detection | Basic, limited coverage | More sophisticated, layered |
| BI integration | Limited native connectors | Broader API and connector support |
Native tools are often a good fit for smaller estates or single-cloud setups. They’re accurate, tightly integrated, and cheaper to run. The trade-off is weaker support for multi-cloud visibility, shared-service allocation, and business-unit reporting.
Third-party platforms go further on those points, but they cost more and usually need more setup.
The tool-by-tool list below uses these five criteria.
1. AWS Cost Explorer and Cost and Usage Reports
Best for: AWS-only or mostly AWS estates that want a strong native reporting base.
For AWS-first estates, this is usually the starting point for cost reporting. AWS Cost Explorer and Cost and Usage Reports (CUR) make up the default native reporting stack for many AWS FinOps teams. Cost Explorer gives you a way to filter spend by service, linked account, region, and cost allocation tag. CUR does the heavy lifting on allocation, while Cost Explorer sits on top as the dashboard layer. CUR exports hourly or daily resource-level billing data to Amazon S3, with detailed line items that teams can load into Athena, Redshift, or other BI tools for finance-grade reporting.[19][20]
CUR also exports line-level data for GB£ reporting, cost-centre allocation, and shared-service chargeback. That means engineers can drill into service, usage type, and resource ID. It also helps with shared services and support charges, which can then be mapped to internal cost centres in your BI layer.[14][16][20]
Cost Explorer can forecast up to 18 months ahead using 38 months of history. On top of that, Cost Anomaly Detection flags unusual spend by service, account, or cost category at no extra cost.[10][12][18][22] In practice, that makes it easier to watch big-ticket services like EC2 and AI/ML and send alerts to email or SNS when spend moves in an odd direction.[18][22]
Cost Explorer now includes Amazon Q Developer, so teams can ask natural-language questions about spend and get quick explanations for cost drivers and anomalies.[11][13][15]
The trade-off is fairly clear. There’s a 24–48-hour data lag, coverage is AWS-only, and EKS visibility stays fairly high level. So if you need multi-cloud reporting, external SaaS tracking, or pod-level chargeback, you’ll need extra tooling.[21][23][24][25]
| Criterion | AWS Cost Explorer + CUR |
|---|---|
| Allocation accuracy | Strong through cost allocation tags and cost categories; untagged spend is still a gap |
| Audience fit | Finance (CUR + BI), engineering (resource-level drill-down), leadership (Cost Explorer dashboards) |
| Anomaly detection | Built-in ML-based detection; free; configurable by service, account, or category |
| Exports and integrations | CSV, API, S3 → Athena / Redshift / QuickSight / Power BI |
| Kubernetes / SaaS / AI coverage | High-level EKS visibility only; AWS Marketplace SaaS; AWS-native AI (Bedrock, SageMaker); no external AI or non-AWS clouds |
| Pricing | Console UI free; API requests are metered; CUR delivery free |
The next section covers the native Azure equivalent for Microsoft-heavy estates.
2. Azure Cost Management and Billing
For Microsoft-heavy estates, Azure’s native reporting stack covers the same core needs as other cloud-native billing tools. Azure Cost Management and Billing handles cost analysis, forecasting, exports, and FOCUS support. On top of that, Microsoft Copilot gives finance teams and leadership plain-English summaries, which helps when no one wants to dig through rows of billing data.
The split is pretty clear. Finance gets forecasts and exports. Engineering gets resource-level drill-down. Leadership gets Copilot summaries. If your reporting needs sit across all three groups, that matters.
Exports can also be normalised to GBP in Power BI or a data warehouse, which makes charge reporting a lot easier if your business works in pounds rather than raw cloud billing currency.
| Feature | Capability | Target Audience |
|---|---|---|
| Microsoft Copilot | AI-driven summaries and surface unusual spend patterns | Leadership & Finance |
| Cost Analysis | Cost analysis by resource group, subscription, service and tags | Engineering |
| FOCUS | Standardised multi-cloud billing schema | Finance |
| Forecasting | Predictive spend based on historical data | Finance & Leadership |
| Exports | CSV exports and BI integration | Finance & Engineering |
3. Google Cloud Billing Reports and Cost Management
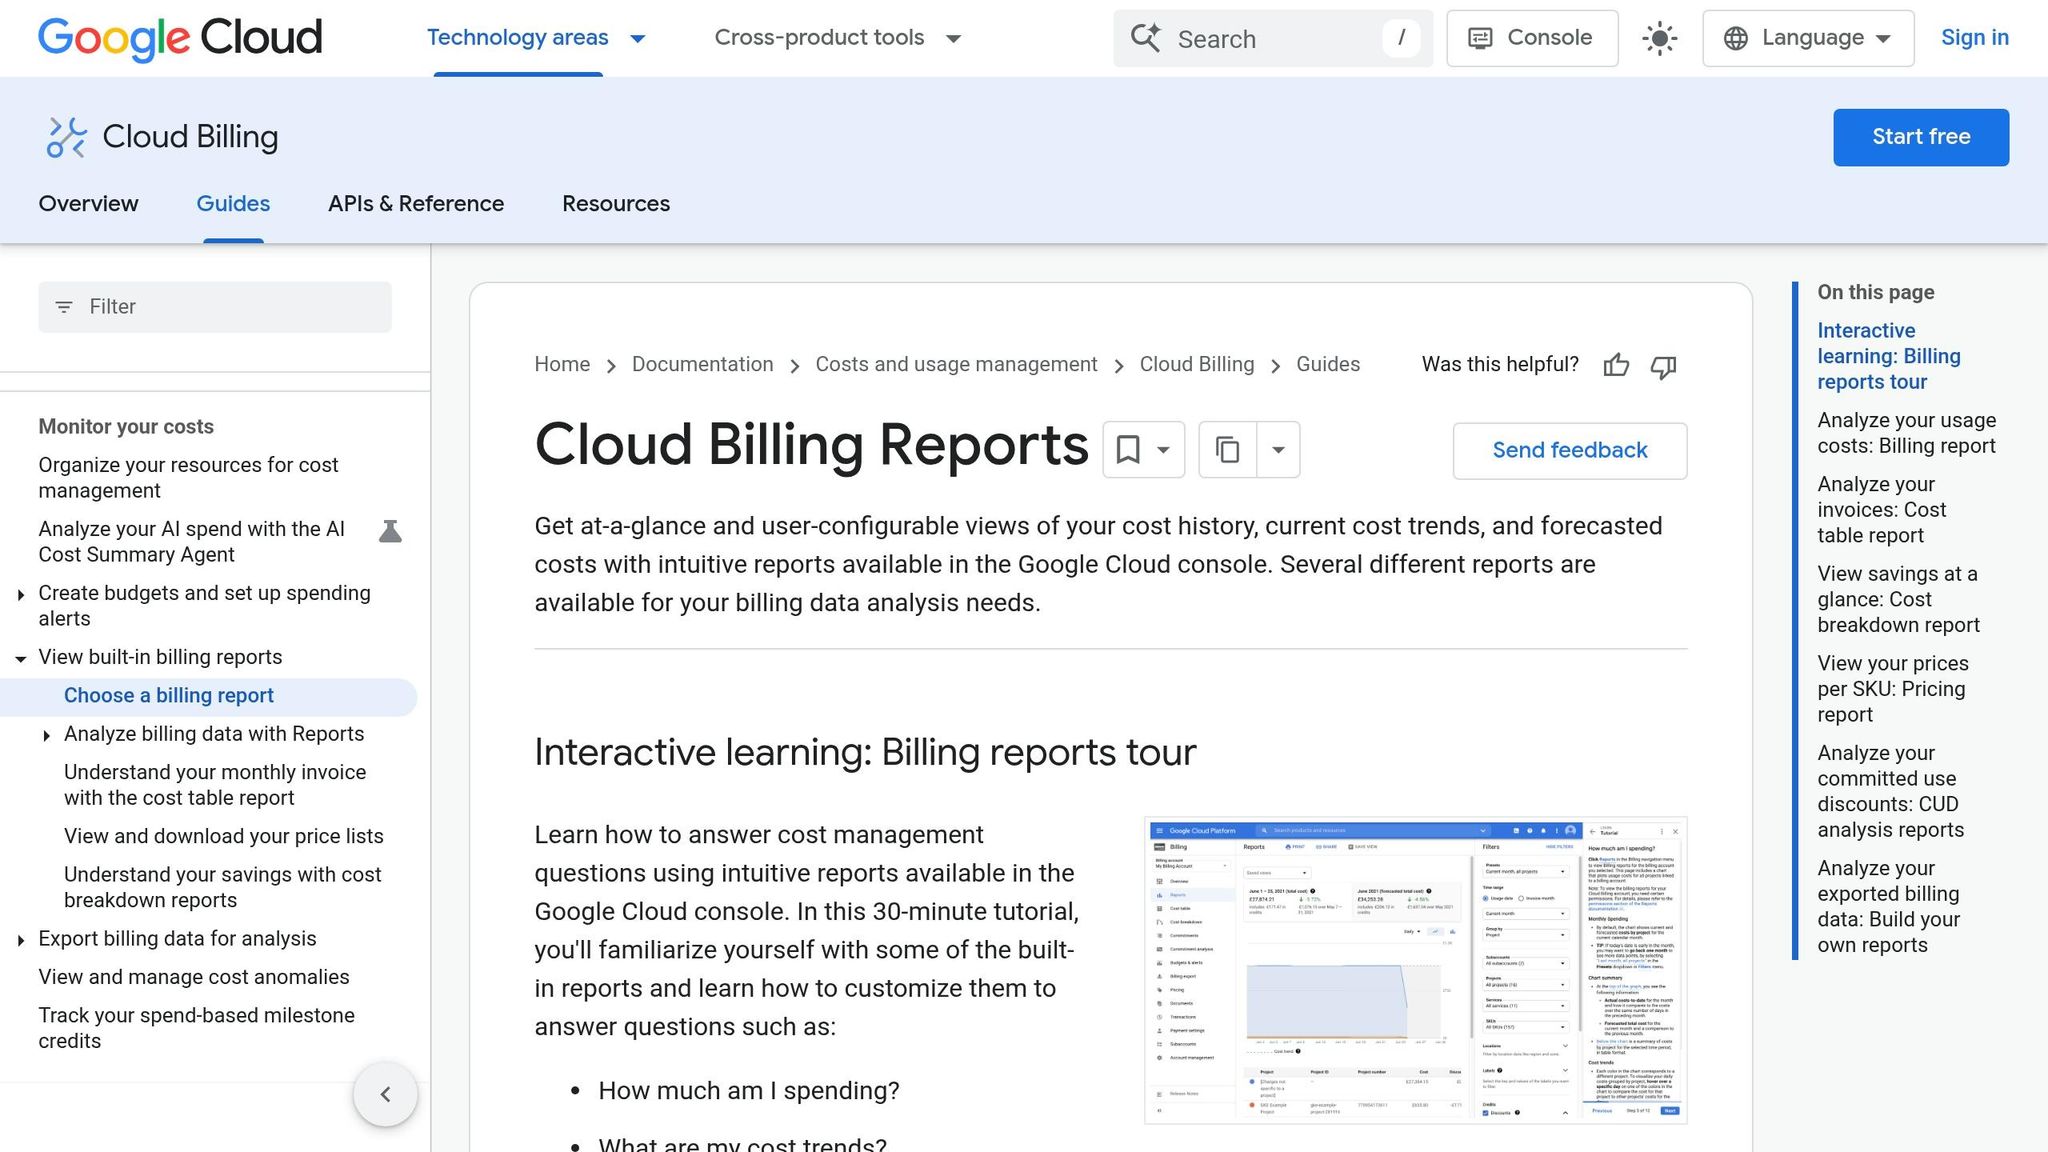
Much like the Azure-native stack, this setup works best when you pair it with a warehouse or BI layer. For Google-native estates, Google Cloud Billing Reports is the built-in place to start.
It lets you allocate spend by project, folder, label and billing account. That said, shared costs don’t sort themselves out. If you’re trying to split central platform and infrastructure spend, you’ll still need rules-based allocation.
The standout feature here is BigQuery export. It gives finance and BI teams a clean feed for custom allocation, dashboarding and chargeback. That matters because native billing views only take you so far. Once teams want more detail or sharper reporting, the next layer of tools can help with deeper cross-cloud allocation and reporting.
GKE and GPU-backed services are included too, but there’s a catch: accurate allocation still depends on labels and folders. If those aren’t set up well, the numbers can get messy fast.
| Feature | Capability |
|---|---|
| Allocation | By project, folder, label and billing account |
| BigQuery Export | Clean feed for custom allocation, dashboarding and chargeback |
| Budget and anomaly alerts | Basic alerts |
| Forecasting | Basic forecasting |
| Kubernetes | GKE included in billing exports; accurate allocation depends on labels |
| AI/GPU Spend | Included in billing exports; accurate allocation depends on labels |
4. Apptio Cloudability
Native billing tools usually stop at cloud-level reporting. Cloudability goes much further. It’s an enterprise FinOps platform built for multi-cloud allocation across teams and business units. In plain terms, it helps you map cloud spend to cost centres, products, environments and teams across AWS, Azure and Google Cloud.[27][29][32]
Its allocation engine handles the messy parts that finance teams care about. It amortises reserved instance purchases, normalises credits and splits shared costs using usage-based rules. So if a UK company runs a shared Kubernetes cluster across several product teams, Cloudability can divide those costs by namespace or label, show them in £, and support finance-ready chargeback. That matters when finance wants clean allocation without losing sight of future spend.[30][31]
Forecasting is another strong area. Cloudability uses IBM watsonx AI models with confidence intervals, plus hierarchical budgets and anomaly alerts.[28][33] That gives teams a better sense of where spend is heading, not just where it has already gone.
It also plugs into tools people already use. You get integration with ServiceNow and ApptioBI for downstream BI analysis. The Advanced Containers add-on, powered by Kubecost, allocates Kubernetes costs to namespaces, workloads and labels. AI and GPU spend also sits inside the same allocation model as cloud infrastructure, which helps keep shared and oddball spend in one place instead of scattered across separate reports. That level of detail is a big reason Cloudability sits squarely in the enterprise tier.
Pricing usually lands between 0.75% and 3% of monitored spend, depending on volume and contract length.[34][35]
| Feature | Capability |
|---|---|
| Allocation | By cost centre, team, product and environment; shared cost rules |
| Forecasting | IBM watsonx AI models with confidence intervals |
| Anomaly Detection | Spend spikes and drops across services, accounts and tags |
| Kubernetes | Namespace, workload and label allocation via Advanced Containers |
| AI/GPU Spend | Tracked and allocated within the same cost framework |
| Exports & APIs | CSV exports, APIs, ServiceNow and ApptioBI integration |
| Pricing (approx. GBP) | From ~£22,500/yr (up to £750k spend) to ~£99,400/yr (up to £4.5m spend) |
5. CloudHealth (VMware Aria Cost powered by CloudHealth)
CloudHealth fits mid-market and enterprise teams that need tight control over cost allocation across large, messy cloud estates, not just a basic billing screen. It pulls AWS, Azure, Google Cloud, Oracle Cloud Infrastructure, Alibaba Cloud, and on-premises VMware into one view.[44][40][51] That matters when finance and platform teams need policy-led allocation rules instead of plain provider billing data.
The big draw here is Perspectives. It lets teams group spend by business unit, product, environment, or cost centre without depending only on provider tags.[49][44] That’s a big deal in practice. A UK retailer, for example, could map AWS and Azure spend to ecommerce, stores, and data teams, then turn that into GBP showback or chargeback reports. On top of that, Custom Line Items let you add one-off or recurring charges and credits for mark-ups, support recovery, and shared services.[42][39][46]
CloudHealth also covers forecasting, budgets, and anomaly detection. Forecasts can run up to 36 months, based on 12 months of historical data. Its anomaly detection looks at 13 months of history, filters out low-impact anomalies, and learns from feedback over time.[45][47] On the AI side, Intelligent Assist reached general availability in June 2025, and Smart Summary adds AI-generated insights and summaries inside the platform.[48][50]
Kubernetes support is another strong point. Costs can be allocated using OpenCost-aligned data.[41] Exportable Kubernetes Cost Reports make BI work and stakeholder reporting less of a slog. For moving data out, CloudHealth supports CSV exports, REST and GraphQL APIs, webhooks for Slack or Jira, and VMware Aria Automation integration.[41][37][38][43]
BT/EE reported £40,000 per month in savings and £400,000 in annual savings.[36] This tool makes the most sense when governance, allocation logic, and finance reporting all need to stay under close control.
| Feature | Capability |
|---|---|
| Allocation | Perspectives engine; business units, products, environments, cost centres; custom allocation rules |
| Chargeback/Showback | Custom Line Items, reallocation rules, CSV/API exports for finance systems |
| Forecasting | Up to 36 months; based on 12 months of history |
| Anomaly Detection | 13 months of history; low-impact anomalies suppressed; learns from feedback |
| Kubernetes | OpenCost-aligned; namespace, workload, pod and container allocation |
| AI Features | Intelligent Assist; Smart Summary |
| Exports & APIs | CSV, REST/GraphQL APIs, webhooks (Slack/Jira), VMware Aria Automation integration |
| Pricing (approx.) | Around 3.6% of monthly cloud spend; minimum fee quoted in GBP |
If you need deeper unit-level cost visibility, the next tool moves further in that direction.
6. CloudZero
For teams that need business-level reporting instead of account-level views, CloudZero shifts the conversation to unit economics. Instead of grouping spend by accounts, services, or tags, it maps cloud costs to products, teams, customers, and environments through its CostFormation® engine.[56][55]
That matters for UK organisations with partly tagged estates and shared infrastructure. CostFormation can allocate almost all cloud spend, including untagged and shared resources such as NAT gateways, databases, and logging infrastructure, across custom cost centres.[56][55]
The payoff is practical unit economics: metrics like cost per customer, cost per transaction, or cost per API call that both finance and engineering teams can use.[58][52]
CloudZero also applies this model to AI spend. It tracks LLM usage from usage telemetry and attributes each model call to a team, product, feature, or customer.[54][57] So you can see measures such as cost per inference and cost per AI user alongside standard cloud unit costs in one place. For UK teams trying to match invoices from providers like Anthropic and OpenAI against GBP budgets, that single view helps a lot.
Anomaly detection runs automatically, with alerts sent to Slack or email. Forecasting blends historical trends with per-unit cost forecasts, which gives finance a better handle on cash flow and helps engineering see how costs move as usage climbs.
| Feature | CloudZero Capability |
|---|---|
| Allocation | CostFormation® engine; allocation across custom dimensions; untagged and shared costs included |
| Chargeback/Showback | Products, teams, features, customers and cost centres; unit economics reporting |
| Forecasting | Historical trends combined with per-unit cost forecasts |
| Anomaly Detection | Automatic; Slack and email alerts |
| AI Spend | Cost per inference, per AI user and per feature; usage telemetry; multi-model attribution |
| Exports & APIs | Public API; Slack, Jira and scheduled report support |
| Pricing (approx.) | Quote-based; typically 1–3% of monitored spend; indicative minimum from around £1,200–£2,000 per month [60][53] |
For Kubernetes-heavy estates, the next tool goes deeper into workload-level allocation.
7. Finout
Finout is a good fit for teams that want to track unit economics across both cloud and SaaS spend. It applies the same reporting view to Kubernetes and business apps, so you’re not stuck piecing data together from different tools.
It supports AWS, Azure, GCP and Oracle Cloud (OCI), plus SaaS links like Snowflake, Databricks and Datadog. The dashboards show spend at product and team level across both cloud and SaaS usage [26].
Kubernetes cost tracking goes right down to pod, namespace, cluster and label level. You can also convert reports to GBP and line them up with your billing cycle, which is handy if your finance team works on a set monthly rhythm. For spend spikes, Finout sends AI-driven alerts through Slack, Teams or email.
| Feature | Finout Capability |
|---|---|
| Multi-Cloud Support | AWS, Azure, GCP, Oracle Cloud (OCI) |
| SaaS Integration | Snowflake, Databricks, Datadog |
| Kubernetes Tracking | Pod, namespace, cluster and label level |
| Reporting Currency | Reports in GBP, aligned to your billing cycle |
| Anomaly Detection | AI-driven alerts via Slack, Teams or email |
| Data Retention | 6+ months of cost history |
Best for product-led teams that need cloud, SaaS and Kubernetes reporting in one place.
8. Harness Cloud and AI Cost Management
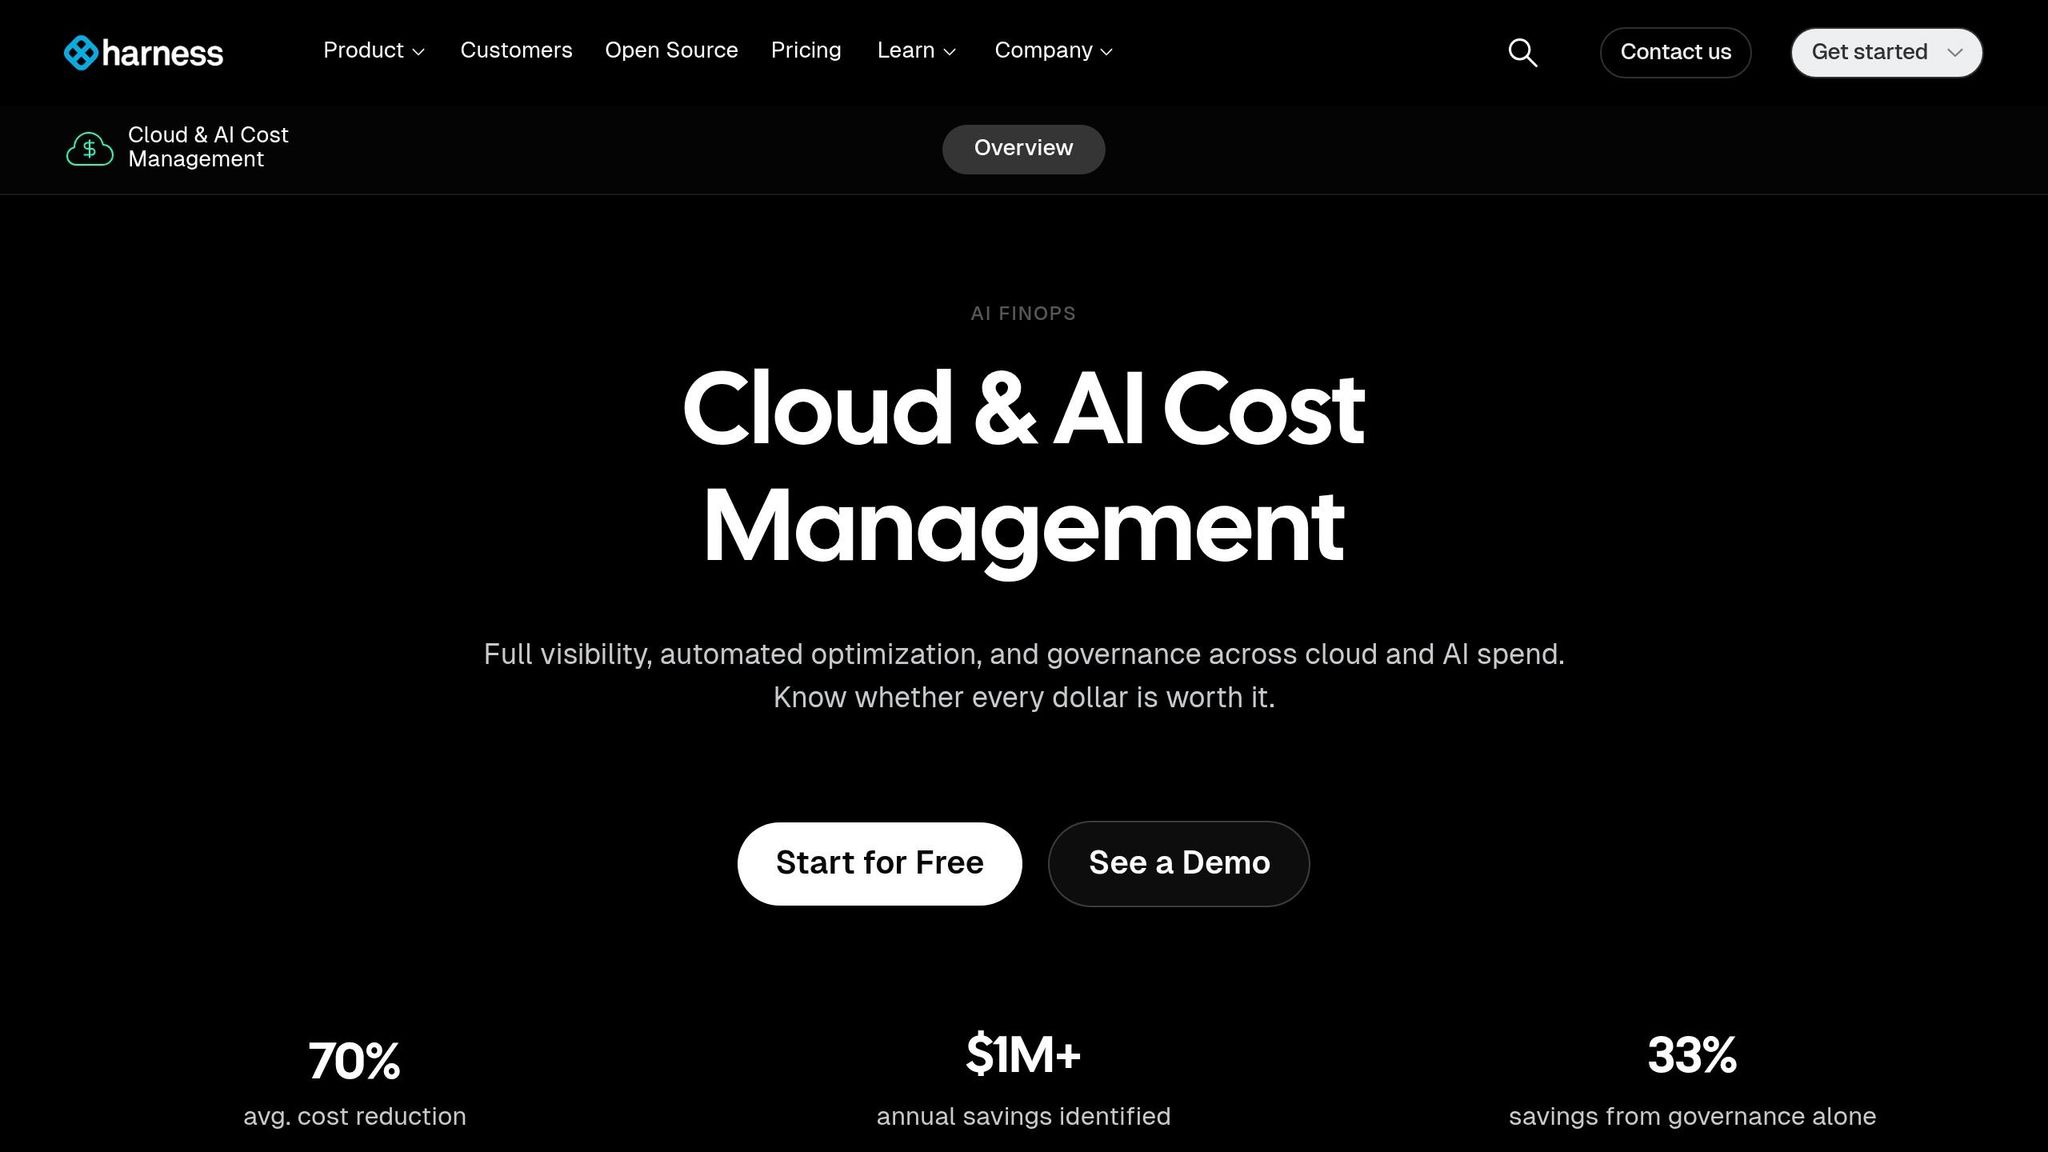
Harness pushes cost reporting beyond cloud and Kubernetes into AI spend too. That gives finance and engineering one shared view of cloud, Kubernetes and AI costs.
Harness Cloud and AI Cost Management (CACM) puts cloud, Kubernetes and AI spend into a single reporting model. In practice, it treats AI as a main reporting category alongside infrastructure spend [61][62][64][70][73]. The heart of the setup is Perspectives: rule-based views built from tags, labels, account IDs, namespaces and AI usage metadata. You can split spend by team, environment, business unit or cost centre. For UK firms, that makes monthly GBP showback and chargeback across cloud, containers and AI much easier to run. On the Kubernetes side, CACM can allocate costs down to pod, namespace, workload and node pool level [61][63][64][74].
After allocation, CACM adds budget controls and anomaly alerts. For forecasting and anomaly detection, it flags unusual spend and sends alerts through Slack or email [71][72]. Budgets can also be set at different levels, including account, project, team or Perspective. So if a team is drifting past its monthly cap, people can get a warning before the bill lands.
| Feature | Harness CACM Capability |
|---|---|
| Multi-cloud support | AWS, Azure, GCP |
| Kubernetes tracking | Pod, namespace, workload and node pool level |
| AI cost tracking | Token usage, agent/session costs, cost per inference |
| Anomaly detection | 15–60 days lookback, Slack and email alerts [71][72] |
| Data retention | 30 days (Free); 5 years (Enterprise) |
CACM also includes APIs and exports from Cost Explorer and Perspectives, so teams can send spend data into Power BI, Tableau or Looker [61][70][65]. The Free Forever plan covers up to £200,000 per year of managed cloud spend across two Kubernetes clusters, with about 30 days of data visibility and limited alerting rules [66][67][68][69]. Enterprise pricing is modular. That makes CACM a good option when a company needs reporting for both infrastructure and AI usage inside the same finance cycle.
9. Kubecost
For Kubernetes-first estates, Kubecost goes much deeper than broad cloud reporting tools. It’s built for Kubernetes cost visibility and allocation from the ground up.[87][88]
That matters because Kubecost can split spend all the way down to:
- namespace
- deployment
- service
- StatefulSet
- DaemonSet
- pod
- container
It does this with Kubernetes metadata and custom labels.[79][4][84] For UK organisations, that level of detail makes it much easier to tie technical resources back to cost centres, departments, or product lines and support auditable showback and chargeback reporting.[80][82]
If your cost reporting issue starts inside the cluster rather than at the billing-account level, Kubecost is the specialist pick. It’s built for namespace-, workload-, and container-level allocation for Kubernetes showback and chargeback.
Costs can be shown in GBP through cloud billing integration or custom CSV pricing sources.[78] The Foundations tier is free for one cluster. Business adds multi-cluster support, alerts, and SSO. Enterprise adds unlimited clusters, RBAC, and billing reconciliation.
| Tier | Price | Retention | Key Features |
|---|---|---|---|
| Foundations | £0 | 15 days | Single cluster, basic allocation, estimated on-demand rates |
| Business | Around $3.42/vCPU/month | Around 30 days | Multi-cluster, alerts, SSO |
| Enterprise | Custom quote | Unlimited | CUR reconciliation, RBAC, unlimited clusters, priority SLAs |
Kubecost also includes budgets, forecasting, and anomaly detection. Forecasting projects spend by cluster, namespace, team, or label.[75][80][81][86][85] Budget alerts can be set by namespace, label, or cluster, and teams can get notified through Slack, email, PagerDuty, or ServiceNow when projected or actual spend goes over those limits.[76][81][84][86]
Anomaly detection helps spot unusual spend patterns, like a sudden spike from a misconfigured workload or unexpected scaling. In practice, that gives teams a chance to look into the issue before it shows up on month-end invoices.[76][80][86]
For reporting workflows, Kubecost exports cost data through CSV, REST APIs, Prometheus, and the kubectl-cost CLI.[5][79][4][84][85] Kubecost 3.0 also adds GPU-aware cost tracking for AI and ML workloads running on Kubernetes.[75][81][83][5][79] On top of that, cloud billing integrations can link services such as AWS S3 buckets or RDS databases to workloads, namespaces, or teams.[75][81][83][5][79]
That gives teams a decent way to estimate full application TCO, even though Kubecost is still, at its core, a Kubernetes-first platform.[84][86]
Its main strength is deep Kubernetes-native allocation, near real-time visibility, and governance controls such as RBAC and SSO with Microsoft, Google, Okta, and GitHub.[75][77][84] Its main weakness is scope: spend outside Kubernetes still needs separate reporting coverage.[5][79][86]
10. Vantage
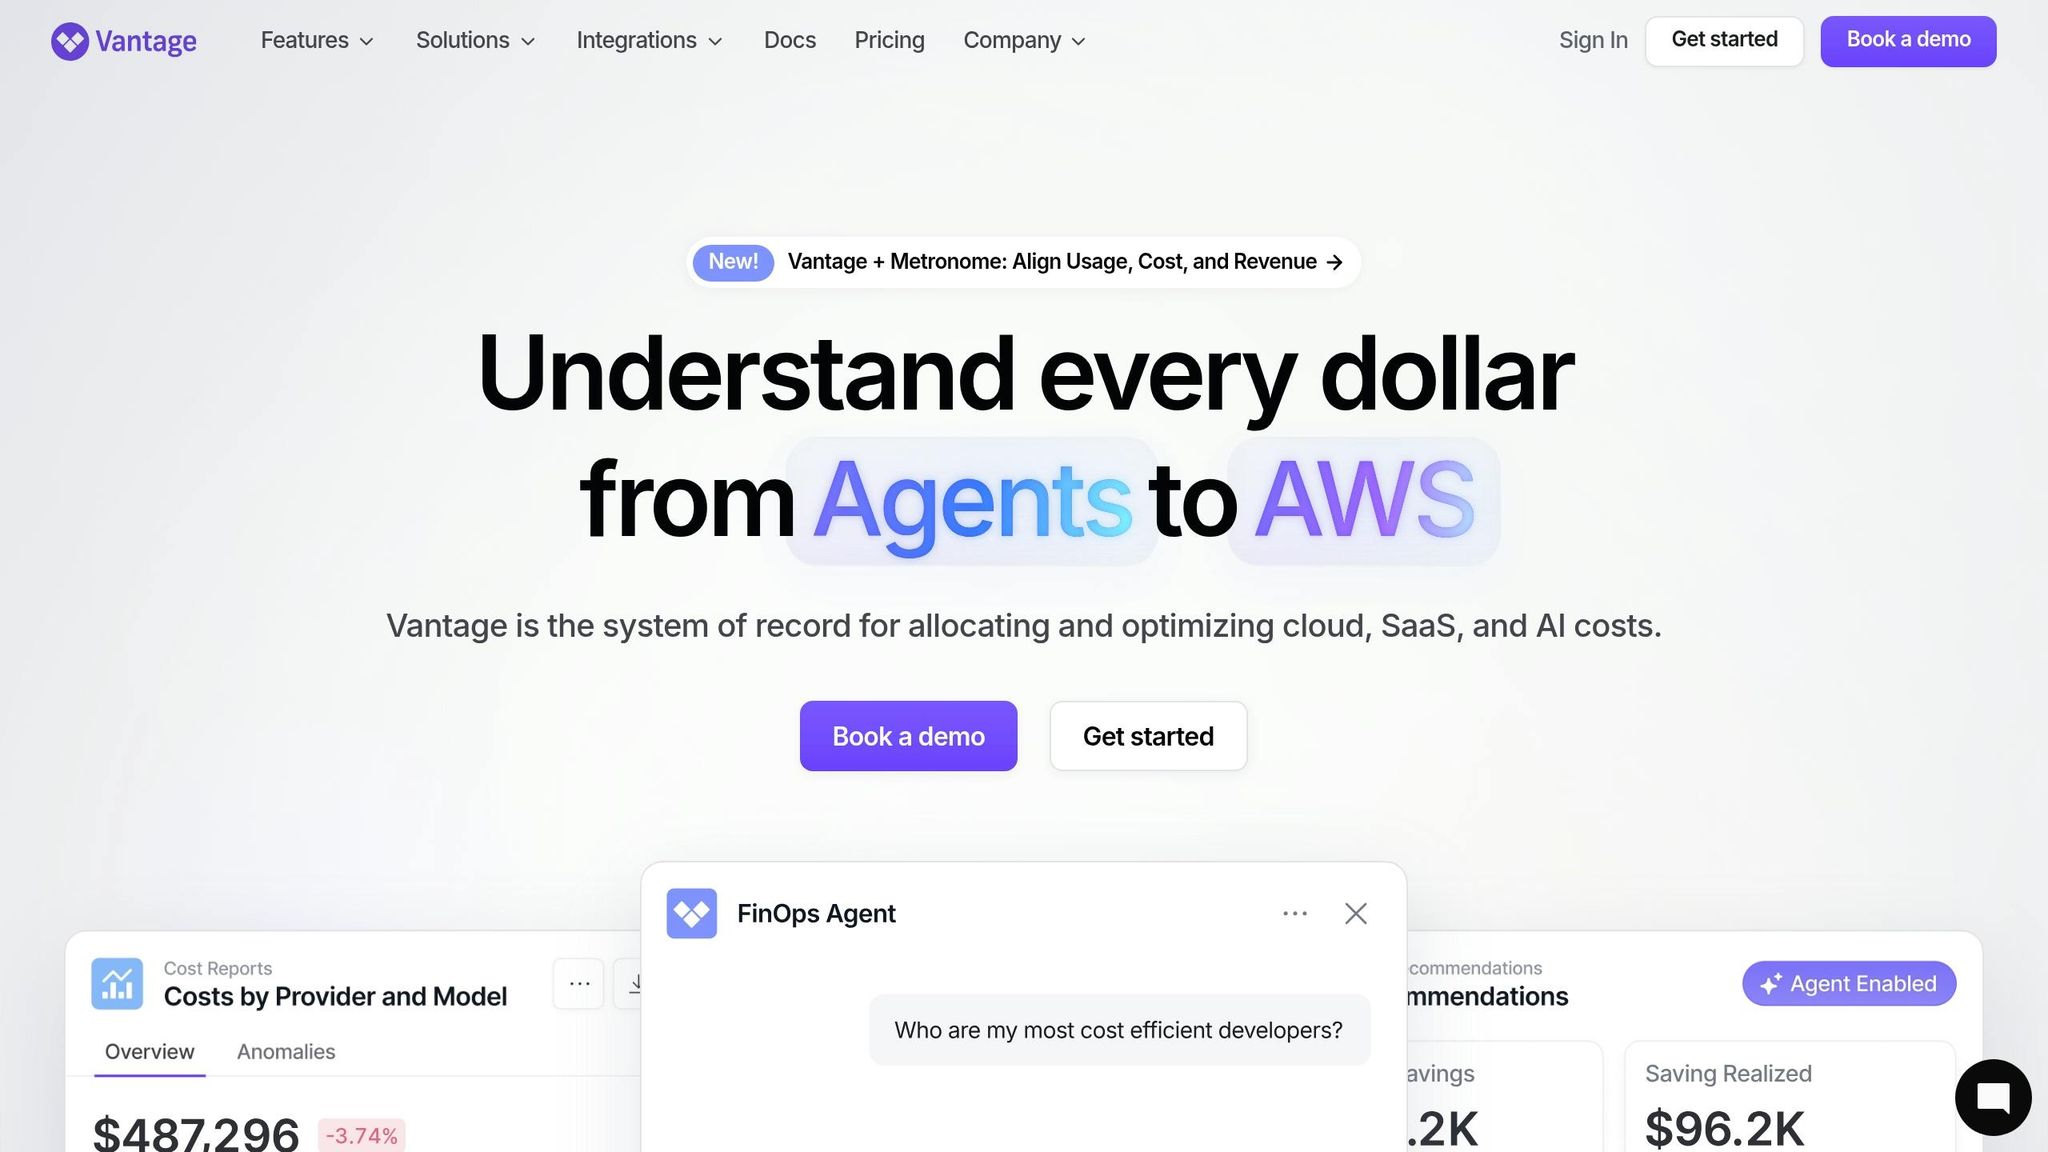
If you need reporting that goes beyond the cluster level, Vantage applies the same cost allocation approach across cloud, SaaS and AI spend. It pulls AWS, Azure, GCP, Kubernetes, SaaS and AI costs into one reporting layer, with around 30 integrations, including Snowflake, Datadog, OpenAI and Anthropic.[94]
The standout feature here is virtual tagging. That’s what makes retrospective allocation far more practical. Vantage handles allocation through native tags, account structures and virtual tagging, so finance and FinOps teams can reclassify spend after the fact without retagging live resources.[89][94][95] Shared costs can also be split across business units with rule-based segments and chargeback formulas.
Budget controls are built in too. Teams can set budgets for an environment, project or business unit, then get alerts in Slack, Microsoft Teams, email or Jira when spend gets close to, or passes, a set threshold. AI-driven alerts can also flag anomalies across the estate. For Kubernetes, Vantage reports by namespace, label and cluster.
It also includes a REST API, a Terraform provider, and exports to Power BI or Looker.
Pricing is tiered by tracked spend.
| Tier | Approx. Price | Monthly spend cap | Notable Features |
|---|---|---|---|
| Starter | Free | US$2,500/month | Core reports, dashboards, basic budgets |
| Pro | About £25/month | US$7,500/month | More users, forecasting, recommendations |
| Business | About £160/month | US$20,000/month | Multi-cloud, virtual tagging, Kubernetes, anomaly detection, SSO |
| Enterprise | Custom | Above US$20,000/month | Advanced API, RBAC, dedicated support |
Indicative pricing is based on tracked monthly spend.[90][91][92]
Quick Comparison Table
Some of the gaps only stand out when you put the tools side by side. This table compares them on the points that tend to matter most: focus, cloud coverage, reporting, integrations, pricing, and who each tool suits best. It’s a handy way to cut down your shortlist before you dig into the pros and cons of each option.
Prices are indicative, and plan features and export options vary.
| Tool | Primary Focus | Cloud Coverage | Strengths | Exports & Integrations | Pricing Model | Best Fit |
|---|---|---|---|---|---|---|
| AWS Cost Explorer and Cost and Usage Reports | Native AWS cost and usage analysis | AWS only | Hourly granularity, Savings Plans Utilisation/Coverage, spend trends [96][99][17] | AWS billing views, S3 exports, Data Exports API [96][99][17] | Free dashboard; US$0.01 per API request [96] | AWS-only teams of any size |
| Azure Cost Management and Billing | Native Azure cost governance | Azure-first | Spend analysis, budgets, alerts, enhanced exports at scale [98][101] | Exports, Azure portal, REST API [98] | Free for Azure customers and managed service providers [101] | Azure-heavy organisations and MSPs |
| Google Cloud Billing Reports and Cost Management | Native Google Cloud billing analytics | Google Cloud only | Billing reports, pricing table reports, custom reports | BigQuery exports throughout the day [97][100] | Native tool; downstream BigQuery costs apply | GCP teams needing warehouse-ready data |
| Apptio Cloudability | Enterprise FinOps platform | AWS, Azure, GCP | Tag reporting, untagged resource detection, cost-based coverage, chargeback [27][102] | Jira, Datadog, PagerDuty integrations [35] | Quote-based; typically ~0.75–3% of monitored spend [35][34] | Mid-market to large enterprise FinOps teams |
| CloudHealth (VMware Aria Cost powered by CloudHealth) | Enterprise cloud governance | AWS, Azure, GCP, hybrid/on-prem | Policy-driven reporting, Perspectives, governance guardrails | GraphQL and REST APIs, FlexReports [93] | Custom quote | Governance-heavy mid-market and enterprise teams |
| CloudZero | Unit economics and engineering cost visibility | AWS, Azure, GCP; Kubernetes via integrations | Cost per customer, per feature, per environment | API-driven; Slack, Jira, email alerts | Quote-based | Engineering-led mid-market to enterprise teams |
| Finout | Shared cost visibility and allocation | AWS, Azure, GCP; Kubernetes via integrations | Virtual tagging, MegaBill consolidation, shared cost allocation | BigQuery feeds, Slack, Teams, email | Spend-based / quote-based | Mid-sized multi-cloud teams with shared cost allocation needs |
| Harness Cloud and AI Cost Management | DevOps-integrated cost management | AWS, Azure, GCP, Kubernetes | DevOps and CI/CD reporting | Native CI/CD integration | Free tier with modular paid plans | DevOps and platform engineering teams |
| Kubecost | Kubernetes cost allocation and optimisation | Kubernetes on any cloud or on-prem | Pod, namespace, workload and label-level granularity | Single API across multi-cluster setups | Free open-source; paid Enterprise tier | Kubernetes-heavy engineering teams |
| Vantage | Multi-cloud cost reporting | AWS, Azure, GCP, Kubernetes | Virtual tagging, anomaly detection, budgets, Kubernetes namespace views [94][95] | REST API, Terraform provider, Power BI, Looker [90] | Free Starter tier; paid plans from ~£25/month [90][91][92] | Startups to mid-sized multi-cloud teams |
The next section looks at the main strengths and weaknesses of each tool.
Pros and Cons by Tool
This table shows the main trade-offs between each option: how far you can push cost allocation, how much Kubernetes detail you get, whether chargeback is ready for finance teams, and how well the tool handles AI and SaaS spend.
Use it to separate basic access to billing data from deeper reporting and allocation.
| Tool | Main Strengths | Main Constraints |
|---|---|---|
| AWS Cost Explorer and Cost and Usage Reports | Free native AWS reporting; solid service, account and region breakdowns; integrates with AWS Budgets | AWS-only; data updates once per day, with up to a 24-hour delay[105]; no real-time alerts; limited unit economics and multi-cloud consolidation |
| Azure Cost Management and Billing | Native to the Azure portal; budget alerts; management-group views; export to external tools | Data latency of 8–24 hours[106]; complex at enterprise scale across multiple tenants or subscriptions; heavily dependent on tagging discipline |
| Google Cloud Billing Reports and Cost Management | Authoritative GCP billing data; project, service, SKU and label breakdowns; BigQuery and Cloud Storage exports | Not real-time; budgets are alerts only, not enforcement; credits and discounts need careful reconciliation |
| Apptio Cloudability | Finance-grade chargeback and showback; advanced multi-cloud allocation; anomaly detection; optional Kubecost integration for Kubernetes visibility | High cost; suited to large enterprise budgets; complex setup; steep learning curve; best suited to large enterprises with dedicated FinOps teams |
| CloudHealth (VMware Aria Cost powered by CloudHealth) | Flexible cost allocation via Perspectives; strong policy engine; unified visibility across public clouds and VMware-based infrastructure; broad library of pre-built reports | High cost; suited to large enterprise budgets; steep learning curve; limited Kubernetes-native and unit-economics support; overkill for smaller estates |
| CloudZero | Unit-economics reporting such as cost per customer, feature or environment; anomaly detection; Slack integration | More focused on engineering views than finance-grade chargeback; AI and SaaS cost coverage is less broad than some newer platforms |
| Finout | Native cost tracking for AI providers such as OpenAI and Anthropic, plus SaaS tools such as Snowflake and Datadog; full Kubernetes allocation with shared-cost allocation; unified multi-cloud view | No free tier; complexity may be high for smaller estates; positioned mainly for larger or fast-growing organisations |
| Harness Cloud and AI Cost Management | Trace-level AI cost attribution; hourly granularity; FOCUS-aligned exports; free tier up to approximately £200,000/year spend and 2 Kubernetes clusters[103][104][34] | Free tier limited to 30-day data visibility[104]; works best with the wider Harness stack; enterprise pricing not publicly listed |
| Kubecost | Deep Kubernetes visibility; pod, namespace and workload-level granularity; useful for platform engineering teams running clusters at scale | Not a full all-cloud finance reporting suite; less suitable if the main need is broad enterprise chargeback across SaaS, AI and non-Kubernetes infrastructure |
| Vantage | Free starter tier; low-cost paid tiers; good multi-cloud support; AI provider integrations | Cost data can lag by a day[68]; charting is limited; AI and SaaS coverage is not as broad as Finout's |
The split is pretty clear. Native cloud tools give you billing data and basic cost views. Paid platforms go further, with deeper allocation, shared-cost handling, and reporting across cloud, Kubernetes, AI and SaaS.
That’s the point where the choice stops being about dashboards and starts being about operating model. If you only need cloud billing visibility, native tools may do the job. If you need finance-ready reporting across several spend types, the answer depends on the tool, your tagging discipline, and how well you set the whole thing up.
Where Hokstad Consulting Fits
Hokstad Consulting is not a reporting tool. Instead, it helps turn billing data from tools like AWS Cost Explorer, Azure Cost Management, CloudZero and Finout into reporting that finance teams can actually use.
That matters when a company already has a reporting platform, but the allocation model still doesn’t hold up under finance scrutiny.
Most reporting tools show spend. What they don’t do is fix poor tagging, unclear ownership or weak governance. In many cases, the problem isn’t getting hold of the data. The problem is turning raw billing data into allocation that people can trust.
Industry research from Harness projected $44.5 billion in cloud infrastructure waste for 2025, which works out to about 21% of enterprise cloud spend [3]. That’s a huge leak. And it usually doesn’t come from a lack of dashboards. It comes from messy inputs, patchy rules and teams looking at different versions of the same numbers.
This is where Hokstad Consulting comes in. It can help with:
- auditing tags
- redesigning cost-centre mapping
- automating reporting
- setting FinOps processes so finance, engineering and leadership work from the same cost data
If the core issue is process rather than software, advisory support can close the gap faster than buying yet another dashboard.
For UK organisations, pricing is project-based or retainer-based. There’s also a No Savings, No Fee
option for cost-reduction work, where fees are capped to a proportion of the savings actually achieved [107].
It also suits public, private, hybrid and managed hosting estates where spend needs to be normalised into one reporting view.
Final Thoughts
The right tool depends on your estate, how mature your FinOps practice is, and the kind of reporting each team needs. In plain terms, fit matters more than feature count.
A small UK business using one cloud provider may get all it needs from native tools like AWS Cost Explorer, Azure Cost Management, or Google Cloud Billing Reports. A larger organisation with multi-cloud infrastructure, shared services, and formal chargeback needs will often want a broader FinOps platform that pulls everything into one place.
In practice, the main test is allocation quality. Pick a tool that makes tagging gaps easy to spot and handles shared costs cleanly.
For UK organisations, check for GBP reporting, financial-year alignment, and export formats that work with your BI stack and management packs.
Once you have a shortlist, test it on real billing data. That’s where the rubber meets the road. The best results come from pairing solid tooling with disciplined process. For example, Upstart cut cloud costs by $20 million by automating reporting.[59] Tools give you visibility; teams deliver the savings. Pilot the shortlisted tool against a live reporting scenario before you commit.
FAQs
Which tool suits a multi-cloud estate?
For complex multi-cloud estates, Flexera tends to suit large enterprises well. It gives teams a single view of billing across the main public cloud providers, while also tying in hybrid setups and SaaS spend.
If your main goal is broader governance and reporting, CloudHealth (VMware Aria Cost) and Ternary are both well regarded. By contrast, Vantage, Finout, and CloudZero are often a better match for teams that want engineering-led workflows or more automated insights.
How much tagging is needed for chargeback?
For effective chargeback, you don’t need perfect native tagging. A simple setup such as Owner, Project, Environment, Cost Centre, and Application is often enough. That gives you a solid starting point without turning tag management into a full-time job.
Modern cloud cost tools can then fill in the gaps with virtual tagging and automated allocation rules. In plain terms, they can work out or override allocations based on metadata like account IDs or project names. So even untagged resources can still be allocated with a high level of accuracy.
That matters because it cuts down on manual updates and makes chargeback far easier to run day to day. You get better accountability across the business without having to manage tags on every single resource.
When should I use a native tool?
Use a native tool when most of your work sits inside one cloud ecosystem and you want smooth integration with very little set-up. A good example is AWS CloudWatch, which gives you near real-time metrics and logs across many AWS services.
If you need multi-cloud visibility, deeper custom reporting, or cost allocation across different platforms, native tools often fall short because they’re mostly built around their own vendor’s stack.