
If you keep Azure DevOps audit logs only in Azure DevOps, you lose them after 90 days. I’d send them to Microsoft Sentinel if I need longer retention, joined-up investigations, and alerts on risky changes.
Here’s the short version:
- Azure DevOps audit logs cover key admin and change events such as pipeline edits, branch policy changes, PAT creation, audit access, and stream changes.
- There are two main ways to ingest them into Sentinel:
- Azure DevOps Streams → Azure Monitor Logs → data lands in
AzureDevOpsAuditing - Sentinel CCP connector → data lands in
ADOAuditLogs_CL
- Azure DevOps Streams → Azure Monitor Logs → data lands in
- The route I choose changes the schema, auth method, and KQL
- Default retention in Azure DevOps is 90 days, while Sentinel retention can be set much longer, often 180–365 days for audit and incident work, with archive beyond that
- Microsoft’s CCP connector includes ready-made content such as 19 analytic rules and 17 hunting queries
- Ingestion is not instant; data may take about 30 minutes to appear
- UTC time handling matters, especially for UK teams working across GMT and BST
- Audit logs do not show everything; sign-ins, conditional access, and deep pipeline runtime detail still need other data sources
If I were setting this up, I’d do four checks first:
- Turn on organisation-level auditing
- Confirm permissions such as View audit log and stream management rights
- Pick one ingestion path and verify the table
- Add an alert for zero ingestion volume so a broken feed does not sit silent
Quick comparison
| Path | Auth | Sentinel table | Notes |
|---|---|---|---|
| Azure DevOps stream to Azure Monitor Logs | Workspace ID + shared key | AzureDevOpsAuditing |
Shorter setup, but key rotation must be handled |
| Sentinel CCP connector | Entra app + client secret + DCR | ADOAuditLogs_CL |
Microsoft’s preferred route and includes built-in Sentinel content |
A few points matter most in day-to-day use: confirm the live table before writing queries, parse the JSON details field for repo and pipeline data, watch for stream tampering and permission changes, and keep retention and secret rotation under review.
That’s the core of it: get the logs out, confirm where they land, alert on the high-risk events, and keep them long enough to answer audit and incident questions months later.
Prerequisites and setup paths
::: @figure 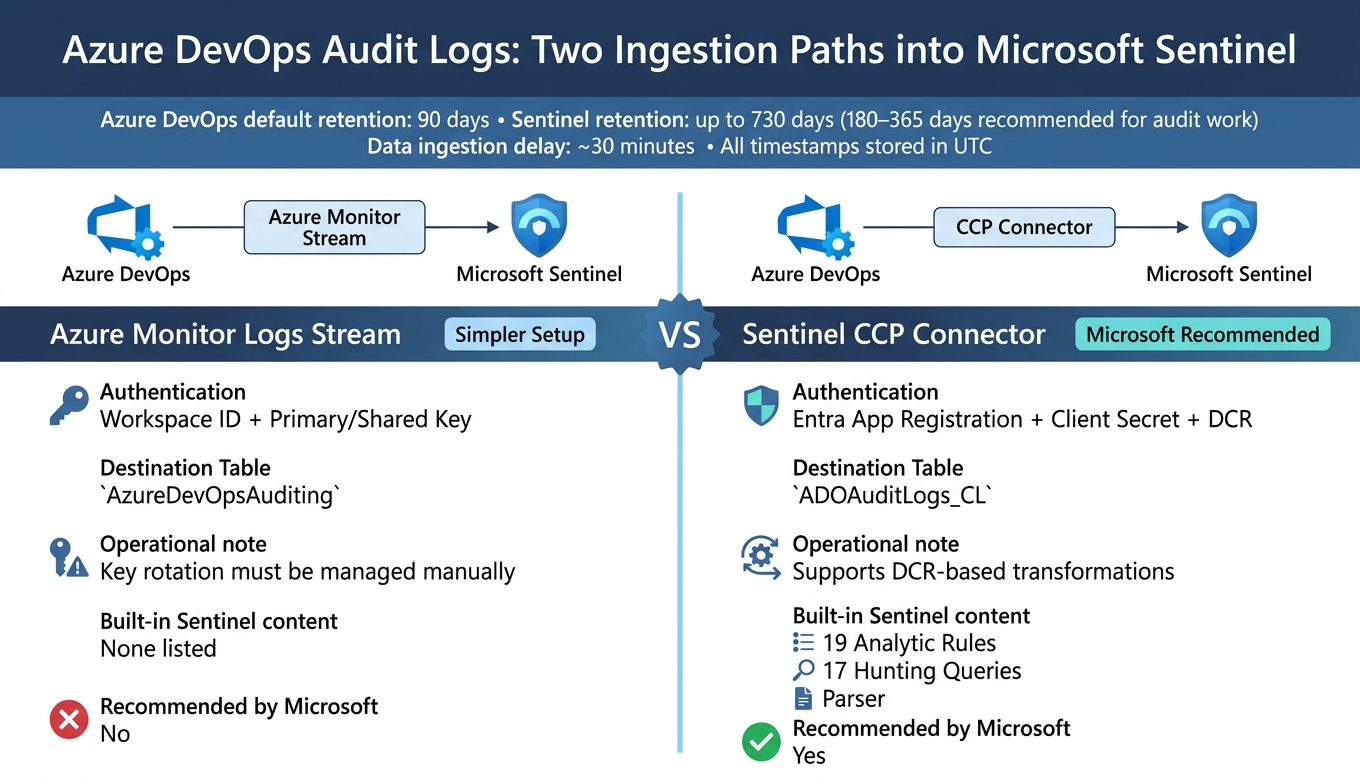 {Azure DevOps Audit Logs: Two Ingestion Paths into Microsoft Sentinel}
:::
{Azure DevOps Audit Logs: Two Ingestion Paths into Microsoft Sentinel}
:::
Enable Azure DevOps auditing and confirm access
Before anything can leave Azure DevOps, you need to switch on organisation-level auditing. If Auditing doesn't appear in Organisation Settings, enable Log Audit Events under Organisation Settings → Policies.[18][16]
After that, the Auditing blade will show the Audit log view and the Streams tab. To set up external streams, you need one of these access levels:
- Project Collection Administrators
- Organisation Owners
- Users with View audit log and Manage audit streams permissions
Those rights are required before you move on.[18][17]
Once auditing is live and access is sorted, pick the ingestion path that fits your Sentinel setup.
Azure Monitor Logs streaming vs the Sentinel connector
Choose the route up front. It affects authentication, the destination table, and the KQL you'll use later.
Azure DevOps Streams → Azure Monitor Logs sends data straight from Azure DevOps to a Log Analytics workspace by using the workspace ID and primary/shared key. Events land in the AzureDevOpsAuditing table.[3][8]
The Microsoft Sentinel CCP connector, installed from the Sentinel Content Hub as Azure DevOps Audit Logs (via Codeless Connector Platform)
, writes to a custom table called ADOAuditLogs_CL.[10][7]
Microsoft points to the CCP connector because it uses the Log Ingestion API and Data Collection Rules (DCRs).[1][11][14]
| Setup path | Authentication | Destination table | Operational notes |
|---|---|---|---|
| Azure DevOps Streams → Azure Monitor Logs | Workspace ID + primary/shared key | AzureDevOpsAuditing |
Simpler setup; key rotation must be managed manually |
| Microsoft Sentinel CCP connector | Entra app registration + Log Ingestion API | ADOAuditLogs_CL |
Recommended by Microsoft; supports DCR-based transformations |
If your SOC is built around Sentinel, the CCP route can save time. It comes with 19 analytic rules, 17 hunting queries, and a parser, which means less custom content to build from scratch.[10]
The table you choose here shapes the field mapping and KQL in the next section.
Connector prerequisites for the CCP-based route
Before you install the connector, get these pieces ready.[1][11][15]
- An app registration in the same Entra tenant as the Sentinel workspace, with its own application (client) ID
- A client secret stored in a safe place - ideally Azure Key Vault - instead of dropping it into a script or config file
- The right API permissions to use the Log Ingestion API and the Azure DevOps Audit Logs API
- A redirect URI on the app registration if you use interactive consent during setup
The identity used by the connector also needs the View audit log permission in Azure DevOps at organisation level.[12][17] Without that, it can't read audit events, and ingestion will fail.
Use a dedicated service identity with only that permission.
With access checked and the ingestion path chosen, the next step is to create the stream or install the connector and confirm that data is landing in the right table.
Send Azure DevOps audit logs into Sentinel
Set up the Azure Monitor Logs stream
Use the ingestion path you picked earlier, then check that events are actually arriving.
For the Azure Monitor Logs route, go to Organisation settings → Auditing → Streams, select New stream, and choose Azure Monitor Logs. You’ll need the Workspace ID and Primary/shared key from the target Log Analytics workspace in the Azure portal. Paste both into the stream setup form, then save.
Events usually start to flow within about 30 minutes.[8][2] After that, open Logs in your Sentinel workspace and run:
AzureDevOpsAuditing
| take 10
It’s also worth doing a one-hour check:
AzureDevOpsAuditing
| where TimeGenerated > ago(1h)
| summarize count() by bin(TimeGenerated, 15m)
This gives you a quick sense of whether data is coming in at a steady rate.[13][2] Also check that TimeGenerated is in UTC, so UK dashboards and alerts don’t drift during BST.[13][5]
Set up the Microsoft Sentinel connector
For the CCP route, open the Sentinel blade, go to Content hub, and search for Azure DevOps Audit Logs (via Codeless Connector Platform). Install the solution, then open the connector page.[20][21]
In Configuration, enter your Azure DevOps organisation URL, such as https://dev.azure.com/your-org, plus the client ID, tenant ID, and client secret from the Entra app registration you set up earlier.[21] The connector sends data to ADOAuditLogs_CL through a DCR.[21][7][12]
Use a dedicated service principal managed by your security team, not a personal account.[19][21]
After deployment, review connector health on the connector details page, then run ADOAuditLogs_CL | take 10 to make sure ingestion is working.[10][19]
Confirm the destination table before writing queries
Before you start writing KQL, check which table is live with take 1: AzureDevOpsAuditing for the stream, and ADOAuditLogs_CL for the CCP connector.
AzureDevOpsAuditing
| take 1
ADOAuditLogs_CL
| take 1
Use the table that returns data.[3][7][13][19] The column names differ too, so build your queries against the table you’ve confirmed. Stick with that same table in the next section for field mapping, detections, and workbooks.
Schema, detections, and workbooks
Map Azure DevOps audit fields to Sentinel columns
Once data lands in AzureDevOpsAuditing or ADOAuditLogs_CL, the next job is simple: map the fields you plan to query.
Start with ActivityId. It’s the unique GUID for each audited action, so it’s your anchor for de-duplication and incident reference [13][22]. Actor maps to ActorUPN or UserId and shows who carried out the action. If you line that up with Entra ID sign-in data such as SigninLogs, you get more identity context and a better feel for whether the session looks normal. IpAddress ties the event to a network source, which helps when you’re checking for access from odd places or outside company IP ranges.
| Azure DevOps Audit Field | Sentinel Column | Practical Meaning |
|---|---|---|
| Actor |
ActorUPN / UserId
|
Who performed the action; correlate with Entra ID for identity context |
| IP Address | IpAddress |
Network origin; flag unusual geolocation or non-corporate ranges |
| Timestamp | TimeGenerated |
Event time in UTC; convert to Europe/London for UK dashboards |
| Area | Area |
DevOps service area (e.g. Git, Pipelines, Security) |
| Category | Category |
Type of action (e.g. access, create, modify, delete) |
| Details |
Details / Details_s / Data
|
JSON payload with specifics - old/new values, repo name, pipeline ID |
| ActivityId |
ActivityId / ActivityId_g
|
Unique action identifier; use for correlation and de-duplication |
The Details column usually does the heavy lifting. Parse it with parse_json() so repository names, pipeline IDs, and permission values become fields you can query directly before you build detection logic.
Use these mappings against the table you’ve confirmed as your destination.
Create high-risk audit event analytic rules
With the schema mapped, shift attention to the changes that matter most.
Focus first on stream tampering, audit access, bulk downloads, and privileged changes. Stream events - AuditLog.StreamCreated, AuditLog.StreamDeleted, AuditLog.StreamEnabled, AuditLog.StreamDisabledByUser, and AuditLog.StreamModified - should fire an immediate alert. If someone disables or redirects a stream, you lose visibility, and that’s a problem straight away [22]. AuditLog.AccessLog and AuditLog.DownloadLog also deserve close attention, especially when they show up outside UK office hours or from IPs you don’t know [22].
For permissions and pipelines, watch Security.ModifyPermission and Security.ModifyAccessControlLists. For AzureDevOpsAuditing:
AzureDevOpsAuditing
| where Category startswith "AuditLog.Stream"
| extend audit = parse_json(Details)
| extend StreamName = tostring(audit.streamName),
         Operation = tostring(Category),
         Destination = tostring(audit.destination)
| summarize count() by Actor, Operation, StreamName, Destination, bin(TimeGenerated, 1h)
For permission changes, filter on Area == "Git" and Category == "Security", then extend the Details field to pull out the new role and target repository. Set severity to High when the change grants Admin or Contribute rights [23].
| Alert Scenario | Signal Source | Detection Focus |
|---|---|---|
| Stream tampered with |
AuditLog.StreamDisabledByUser, AuditLog.StreamDeleted
|
Stream to the UK Sentinel workspace stopped or rerouted outside a change window |
| Audit log accessed by non-admin | AuditLog.AccessLog |
Unusual actor or IP querying audit content |
| Bulk audit log download | AuditLog.DownloadLog |
Spike in volume or frequency, especially out of hours |
| Privileged permission granted |
AzureDevOpsAuditing (Security area) |
Admin or policy-bypass rights added to a repo or pipeline |
| Risky pipeline modification |
AzureDevOpsAuditing (Pipelines area) |
Changes to service connections, agent pools, or pipeline scripts |
These same signals also feed the workbook views below.
Build workbooks for change monitoring and investigations
Use the same fields and detections to build day-to-day views for security and DevOps teams.
Workbooks give people shared visibility without having to rerun KQL over and over. Keep it to three views: activity trends, stream health, and security changes.
The activity trends view should show event counts by Actor, Area, and Category over time. A time-series chart split by Area makes it much easier to spot spikes in Security or Pipeline events. The stream health view should track ingestion volume with _Usage or a basic summarize count() by bin(TimeGenerated, 1h) against the audit table. If the line goes flat or there’s a gap, something has likely broken upstream.
| Investigation Question | KQL Data Source | Visualisation Type |
|---|---|---|
| Who is most active in sensitive areas? | AzureDevOpsAuditing |
Heatmap (Actor vs. Area) |
| Is the audit stream healthy? |
_Usage / Heartbeat
|
Timechart (ingestion volume) |
| What configuration changes happened this week? | AzureDevOpsAuditing |
Summary table (Category: modify) |
| Have any audit streams been tampered with? | AzureDevOpsAuditing |
Table filtered on AuditLog.Stream* events |
| Are there access attempts outside business hours? | AzureDevOpsAuditing |
Bar chart by hour of day (UTC+1 during BST) |
Set workbook refresh intervals to line up with the roughly 30-minute ingestion delay.
Retention, coverage gaps, and key takeaways
Plan retention and time handling
Once ingestion is live, the next job is retention. If you skip this step, audit evidence may disappear long before you need it.
After data is streamed into Sentinel, retention is controlled by workspace and table-level policies. The default is 30 days, but you can extend it to 730 days, depending on cost and governance needs [3][9][26][27].
For UK teams with regulatory duties, a sensible starting point is 180–365 days of searchable retention in Sentinel, with older events moved to archive for long-term compliance [3][9]. That gives you enough history for incident reviews, internal audit work, and external assessments without keeping everything in hot storage. It also helps to set table-level retention on AzureDevOpsAuditing or ADOAuditLogs_CL so audit data follows its own policy instead of inheriting a general workspace setting [24][27].
Time handling matters too. The portal may show local time, but Sentinel stores audit events in UTC [25]. For UK dashboards and workbooks, convert time for display to Europe/London. But keep joins, filters, and correlation logic in UTC, especially when British Summer Time rolls in or out [25]. That small detail can save a lot of head-scratching later.
Common coverage gaps and blind spots
Keeping the data longer is only half the picture. You also need to know what Azure DevOps does not record.
Azure DevOps audit logs record organisation-level changes, not every action inside the platform [6][4].
| Coverage Area | What Sentinel Will Not Show Without Correlation |
|---|---|
| Organisation & project configuration | No business context for why a change was made; manual approval records do not appear. |
| Security & access control | User sign-ins and conditional access must come from Entra ID logs separately [9]. |
| Pipeline definitions | No step-level runtime telemetry; detailed build logs live elsewhere. |
| Audit streaming & connector lifecycle | Ingestion can fail silently if secrets expire or permissions change [10][24]. |
In estates with multiple organisations or multiple workspaces, data can look missing when it has simply landed in the wrong table or workspace [10].
That’s why correlation matters. Sentinel on its own won’t tell the whole story. You’ll often need Entra ID logs, pipeline records, and infrastructure telemetry alongside it.
Checks to run and key points to remember
Once ingestion is working, run a few checks before you trust it day to day:
- Rotate keys and secrets on a fixed schedule. For the Azure Monitor Logs stream, store the Workspace Shared Key safely and rotate it on a set schedule - for example, every 90 days - then update the stream settings straight away so ingestion does not stop quietly [5][21][16]. For the CCP-based connector, check that the Entra app registration client secret is still live and that the connector user still has View audit logs permission [28].
- Verify the live destination table before enabling rules. Run a simple KQL query for recent events and confirm whether data is landing in
AzureDevOpsAuditingorADOAuditLogs_CL, and that the schema matches what your queries expect [10][24]. - Add a zero-volume alert for ingestion loss. Set an alert on the audit table so a flat ingestion line triggers a notification instead of sitting unnoticed for days.
FAQs
Which ingestion path should I choose?
Use the native Azure DevOps data connector. It’s the recommended, supported way to send audit logs straight into Microsoft Sentinel for security analytics.
It also makes maintenance simpler and works smoothly with Kusto Query Language (KQL) for threat detection and compliance monitoring. For more complex multi-cloud or hybrid setups, Hokstad Consulting can help design custom automated pipelines.
How can I tell if audit ingestion has stopped?
Set up automated alerts for gaps in log delivery. Most cloud events show up within five minutes, so it makes sense to trigger an alert if no new logs arrive for more than 30 minutes.
It’s also smart to watch failure rates in your audit logs. A sudden spike in request or response failures can point to trouble with audit devices or with the ingestion pipeline.
What other logs should I collect alongside Azure DevOps audit logs?
For a complete audit trail, keep logs from your CI/CD pipeline and the systems around it in one place, alongside Azure DevOps audit logs.
Include:
- pipeline trigger details, such as commit IDs, branches, and the users who started the run
- security scan results, policy enforcement actions, and reasons for manual intervention
- cloud activity, identity, deployment, infrastructure configuration, and vulnerability scanner logs