
If I want AWS Auto Scaling to keep performance steady, I need to get five things right: capacity limits, AZ spread, launch setup, demand metrics, and readiness settings.
Done well, this helps me keep latency down during spikes, avoid hitting a hard scale ceiling, and stop paying for idle EC2 capacity. In plain terms: I should keep at least 2 instances per Availability Zone, set max capacity at around 2–3× my normal peak, use 1-minute monitoring, and start instance warmup at about 300 seconds before tuning it from test results.
Here’s the article in one view:
- Set min, desired, and max capacity properly so scale-out is not blocked at busy times.
- Spread instances across 2–3 Availability Zones so one zone issue does not take the service down.
- Use launch templates with baked AMIs to cut boot delays caused by long startup scripts.
- Pick metrics that match the workload:
- CPU for compute-heavy stateless apps
-
ALBRequestCountPerTargetfor web apps and APIs - Queue depth for SQS workers
- Memory metrics for memory-heavy services
- Turn on 1-minute detailed monitoring so scaling reacts sooner than with 5-minute data.
- Use the right policy mix:
- Target tracking for day-to-day demand
- Scheduled scaling for known peaks
- Step scaling for sharp spikes
- Set health checks, grace periods, and warmup carefully so new instances are not counted too early.
- Watch load balancer metrics like
TargetResponseTime,HTTPCode_Target_5xx_Count, andRequestCountPerTargetto spot uneven traffic.
A short comparison of the main scaling policy types:
| Policy | Best fit | How it works | Good for |
|---|---|---|---|
| Target tracking | Normal day-to-day traffic | Keeps a metric near a target | Most production apps |
| Scheduled scaling | Known busy periods | Changes capacity at set times | Office hours, sales, launch dates |
| Step scaling | Sharp jumps in demand | Adds capacity in bigger steps | Fast spikes |
If I had to boil the whole guide down to one point, it would be this: Auto Scaling works best when the signal is right, new instances start fast, and traffic is shared evenly.
Running Efficient and Resilient Workloads at Scale with EC2 Auto Scaling and EC2 Spot
Need help optimizing your cloud costs?
Get expert advice on how to reduce your cloud expenses without sacrificing performance.
Core AWS Auto Scaling components that affect performance
Five settings shape how Auto Scaling deals with traffic spikes: Auto Scaling groups (ASGs), launch templates, capacity settings, Availability Zones, and Elastic Load Balancing. The best place to start is capacity. After that, focus on how fast new instances can get ready to take traffic.
The Auto Scaling group controls capacity rules and instance health. The Elastic Load Balancer spreads traffic across healthy instances and keeps new ones out of rotation until they pass health checks. That split matters: one decides how many instances you have, the other helps decide when those instances should start serving requests.
Set capacity ranges and spread instances across Availability Zones
The first tuning step is to set the group’s minimum, desired and maximum capacity.
| Setting | Role | Performance impact |
|---|---|---|
| Minimum capacity | Always-on baseline | Stops scale-in from removing all headroom; keeps resilience in place |
| Desired capacity | Current target | Changed by scaling policies to follow actual demand |
| Maximum capacity | Scale-out ceiling | Helps control runaway spend; if set too low, it limits peak performance |
Set minimum capacity to at least two instances per Availability Zone. Set maximum capacity at 2–3× normal peak, then adjust after load testing.[10] Set the maximum too cautiously and you can hit the ceiling at the worst possible moment, like a Black Friday campaign.
That baseline only helps if it is spread across the zones that carry production traffic. Configure your ASG subnets across at least two Availability Zones, and ideally three where the Region supports it. Also make sure your load balancer is enabled in those same zones.[6][7][8] If one AZ has a localised issue, the group can still serve traffic from the others without manual action.
For planning, this formula is handy if you want enough capacity to handle an AZ failure without having to scale reactively: Target Desired Count = Base Desired Count × (AZ count ÷ (AZ count − 1)).[9]
Use launch templates to cut instance startup delays
Once the capacity boundaries are in place, the next job is to cut the time it takes for each new instance to start serving traffic.
A launch template defines what a new instance needs: AMI, instance type, storage, networking, IAM role, and the user data script that runs at boot. Every scale-out event uses this template, so any weakness here shows up fast when demand jumps.
In many setups, the biggest delay comes from the bootstrap script. Long package installs, on-boot compilation, or downloads from slow endpoints can add minutes to startup. Those minutes hurt because the ASG may show new instances as launched, but they still are not ready behind the load balancer. A better approach is to use a tool such as EC2 Image Builder to bake dependencies into the AMI, so the user data script only handles light, environment-specific configuration.[4] That way, instances start in a ready state instead of spending extra time installing software after boot.
It also pays to size the instance type and boot volume to match the workload. Too little CPU, not enough memory, or slow EBS can all delay application readiness.[4][5]
Choose metrics that reflect real demand
After you cut instance start-up delay, the next thing to fix is the signal that tells Auto Scaling when to add capacity. This part matters more than it may seem. If you choose the wrong metric, scaling can happen too late, too often, or not at all when traffic jumps.
Use CPU utilisation, request count per target and workload-specific signals
CPU utilisation (ASGAverageCPUUtilization) is a good fit for compute-bound, stateless workloads like REST APIs, rendering services, and microservices. In those cases, CPU usually tracks pressure well. Set a target that still leaves some headroom for bursts.[15][3]
For web apps and APIs behind an Application Load Balancer, ALBRequestCountPerTarget often tells a better story. It reflects direct application pressure, even when CPU doesn't. That's common when the app hits limits around connections, thread pools, or database contention. In plain terms, the server may look calm on CPU while users are already queueing up. Set request targets from load tests, not from a fixed CPU threshold.[15]
For asynchronous workloads like SQS-driven worker fleets, batch processors, or reporting pipelines, queue depth is the right signal. ApproximateNumberOfMessagesVisible shows how much backlog is building. Scale workers based on queue depth per instance.[11][12]
If you're dealing with memory-heavy or stateful services, CPU on its own can mislead you. In that case, publish a custom CloudWatch metric for memory utilisation and use step scaling when usage goes above 70–75%.[3][16]
The rule is simple: pick a metric that goes up when demand goes up, and comes down as you add capacity.[15][3]
Enable detailed monitoring to speed up scaling reactions
Once you've picked the right metric, tighten the feedback loop so scaling kicks in before latency starts climbing. Basic EC2 monitoring publishes data every 5 minutes. Detailed monitoring publishes every 1 minute. For production Auto Scaling groups, enable detailed monitoring in the launch template.[17]
| Feature | Basic Monitoring | Detailed Monitoring |
|---|---|---|
| Interval | 5 minutes | 1 minute |
| Cost | Included with EC2 | Additional charge |
| Best for | Steady, predictable workloads | Production, variable or bursty traffic |
| Scaling reaction | Slower; may miss rapid spikes | Faster; triggers alarms sooner |
You should also enable Auto Scaling group metrics. They run at 1-minute granularity, cost nothing extra, and are off by default.[2]
One more point: a fast signal only helps if new instances can get into service without dragging their feet. Compare GroupDesiredCapacity with GroupInServiceInstances to spot slow boot times or a hard capacity limit.[13][14]
These faster signals feed straight into the scaling policies that come next.
Pick scaling policies that match your traffic patterns
::: @figure 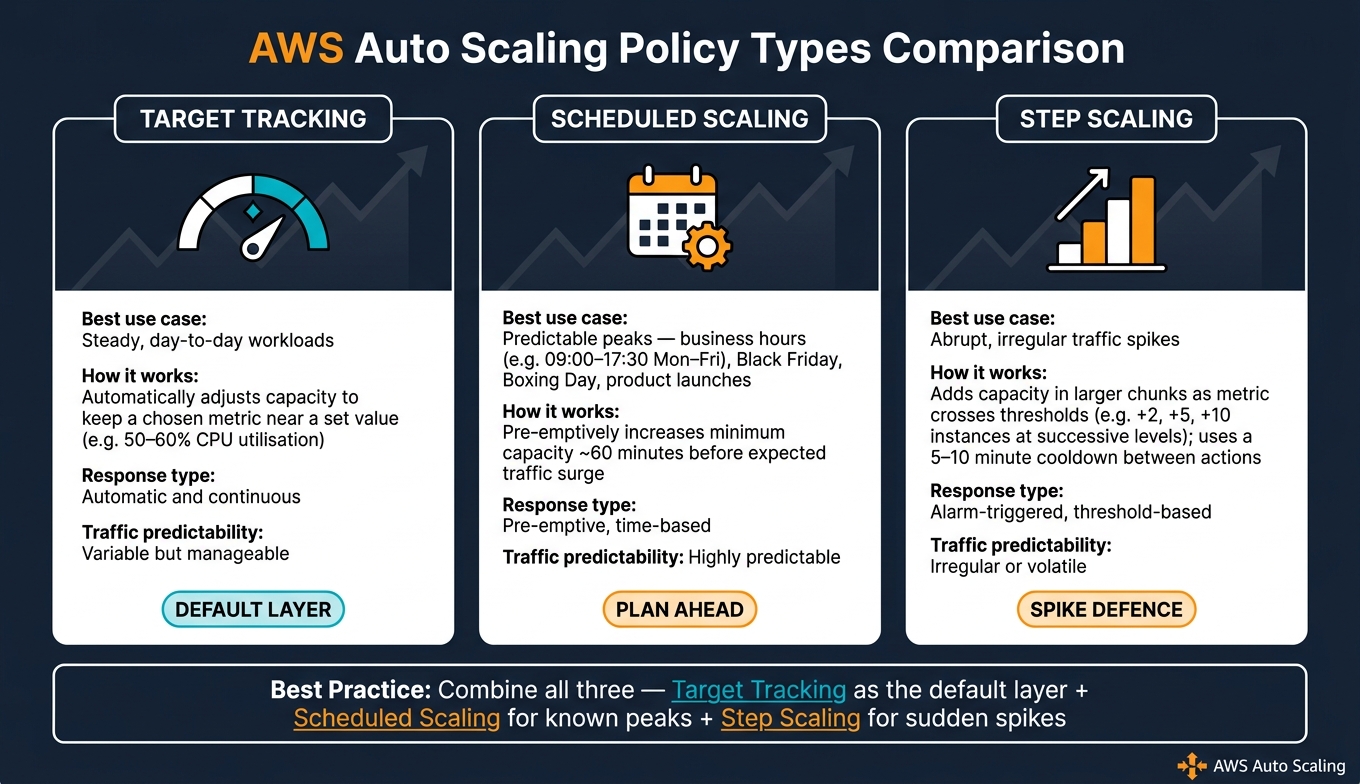 {AWS Auto Scaling Policy Types: Target Tracking vs Scheduled vs Step Scaling}
:::
{AWS Auto Scaling Policy Types: Target Tracking vs Scheduled vs Step Scaling}
:::
Once your metrics are set up to react faster, the next step is choosing the policy that uses those signals. AWS Auto Scaling gives you three main policy types. Which one fits best comes down to two things: how predictable your traffic is and how fast you need capacity to move.
Use target tracking for steady control and scheduled scaling for predictable peaks
For most workloads, target tracking is the go-to option. It keeps a metric close to a value you choose by adjusting capacity on its own. For example, you might set a target of 50–60% CPU utilisation, and Auto Scaling will add or remove capacity to stay near that range.[22][23]
Use target tracking for the day-to-day flow of traffic. Then bring in scheduled actions only when demand follows a pattern you already know. That happens a lot with UK teams. A B2B API may climb between 09:00 and 17:30, Monday to Friday. An e-commerce site may surge around Boxing Day or Black Friday. In cases like that, increase your minimum capacity about 60 minutes before traffic is due.[18]
A simple way to think about it: scheduled scaling sets the floor for the busy period, while target tracking deals with the ups and downs during that window.[21]
Add step scaling for abrupt spikes
Sometimes traffic moves too fast for target tracking on its own. That’s where step scaling helps. Instead of adding capacity bit by bit, it adds larger chunks as the metric climbs. For example, you might scale by +2, +5, then +10 instances at higher thresholds.[19][20]
To stop the group from scaling again before new instances have started taking traffic, use a 5–10 minute cooldown.[24]
For most teams, the best setup isn’t one policy on its own. It’s a mix. Use target tracking as the default layer, add scheduled actions for peaks you can see coming, and bring in step scaling only when you know traffic can jump hard and target tracking reacts too slowly.[25]
| Policy | Best use case | Response type | Traffic predictability |
|---|---|---|---|
| Target tracking | Steady, day-to-day workloads | Automatic, continuous | Variable but manageable |
| Scheduled scaling | Predictable peaks - business hours, campaigns, launches | Pre-emptive, time-based | Highly predictable |
| Step scaling | Abrupt spikes | Alarm-triggered, threshold-based | Irregular or volatile |
Control instance readiness and distribute traffic evenly
After you pick a scaling policy, the next job is making sure new capacity is usable as soon as it shows up. If readiness settings are off and traffic isn’t spread well, extra instances don’t add much beyond a bigger bill.
Set health checks, grace periods and warmup to avoid false scaling signals
Health checks tell you whether an instance is ready for traffic. Grace periods stop a new instance being marked unhealthy before it has finished starting up. Warmup keeps new capacity out of scaling metrics until it has settled down. Get these settings wrong and things go sideways fast: too low, and the group starts churning; too high, and people wait longer than they should for new capacity.
Here’s how the three settings differ:
| Setting | Purpose | When it applies | Effect on performance |
|---|---|---|---|
| Health checks | Determine whether an instance is ready to serve traffic | Continuously, after the grace period | Prevents traffic being routed to failed or uninitialised instances |
| Grace period | Prevent booting instances from being marked unhealthy too early | Immediately after instance launch | Avoids churn where healthy-but-slow instances are replaced unnecessarily |
| Default instance warmup | Delay new instances contributing to scaling metrics | From InService state until warmup expires |
Prevents scaling policies from underestimating demand based on partially loaded instances |
Measure the 95th percentile boot time of your instances under realistic load, from launch through to a successful response on your /health endpoint, and set the grace period a little above that number. Start default instance warmup at 300 seconds, then adjust it based on observed boot and stabilisation times. [29]
For ELB health checks, use a fast application endpoint that checks core dependencies instead of a static page that always returns 200 OK. That way, the load balancer sends traffic only to instances that are actually ready. [28]
Use load balancing metrics to prevent uneven traffic distribution
Once health checks and warmup are dialled in, look at whether the load balancer is spreading traffic evenly. If it isn’t, some instances get hammered while others sit mostly idle. That pushes up latency even when the group still has spare headroom.
Use RequestCountPerTarget to spot imbalance across targets, especially when some instances are getting more traffic than others. [26][30] Pair that with TargetResponseTime and HTTPCode_Target_5xx_Count to catch targets that are starting to struggle under load. [27]
If RequestCountPerTarget keeps showing imbalance, use it as a guardrail against uneven target load. One simple approach is to cap per-target load at a threshold that matches what each instance can handle before performance starts to slip. [1][30][31] That gives you a chance to deal with imbalance before it turns into higher latency or 5xx errors.
Conclusion: tune, test and review scaling as your workload changes
Start with the core settings: capacity limits, Availability Zone spread and launch templates. Once those are set, the job isn’t done. Auto Scaling works best as a continuous control loop, where capacity, signals and policy stay in step with demand.
The metric you choose has a direct effect on scaling decisions. Pick signals that move with demand, and scaling can react before latency starts to climb. Then match the policy to the traffic pattern instead of sticking with one setup by default. If the policy fits the traffic, the next step is to prove it under real load.
Health checks, grace periods and warm-up settings aren’t minor details. They’re performance controls. The same goes for load distribution: check that new instances are sharing traffic evenly, rather than letting one part of the group do all the heavy lifting.
This also isn’t a set-and-forget task. Traffic patterns change, application behaviour shifts, and what worked six months ago might not fit now. Review min/max capacity, target values and warm-up settings on a regular basis. Run load tests that reflect normal and peak conditions, and watch response time, throughput and queue depth, not just CPU.
It also helps to pair that with regular cost-to-performance checks. That way, you can spot when a group is overprovisioned during day-to-day demand, or underprovisioned when traffic spikes. Test, adjust and retest as traffic changes.
For AWS performance tuning, DevOps automation and cloud cost engineering, Hokstad Consulting can help.
FAQs
How do I choose the best scaling metric?
Look past generic CPU use and track the metrics that match how your application actually works. A good starting point is at least two weeks of performance data. That gives you enough time to spot the real bottlenecks, because CPU usage on its own can miss pressure in memory, network throughput, or disk I/O.
For tighter control, use application-level metrics such as message queue length, database connection counts, or response time percentiles. Hokstad Consulting recommends using a mix of measures, so scaling responds to actual work patterns rather than short-lived spikes.
What warmup time should I start with?
There isn’t one fixed number here. Your warmup time should match how long your application needs to start up and become fully ready to handle traffic.
For some setups, 60 to 120 seconds is a sensible starting point. From there, watch performance and readiness probes, then increase the warmup period if your application needs more time to settle.
How do I stop Auto Scaling reacting too slowly?
Enable detailed monitoring for your EC2 instances so CloudWatch gets data every minute instead of the default interval. Also make sure your Auto Scaling group metrics are turned on.
For scaling, use target tracking if you want the group to adjust on its own in a responsive way. If you need tighter control during traffic spikes, step scaling is often the better fit.
It’s also worth checking your instance warm-up and cooldown settings. If those values are set too high, your Auto Scaling group can react too slowly when demand jumps.