
Kubernetes audit logging tracks every action in your cluster, recording details like who did what, when, and how. This helps you monitor API activity, troubleshoot issues, and meet compliance requirements. Automating the process can save time, improve security, and reduce errors. Here's a quick overview:
- What It Does: Logs all API calls, including user actions, automated processes, and control plane activities.
- Why It Matters: Identifies security risks, tracks CI/CD pipeline issues, and ensures compliance with standards like ISO 27001.
- How to Automate:
Webinar: Kubernetes Audit Log - Gold Mine For Security
Designing a Kubernetes Audit Policy
::: @figure 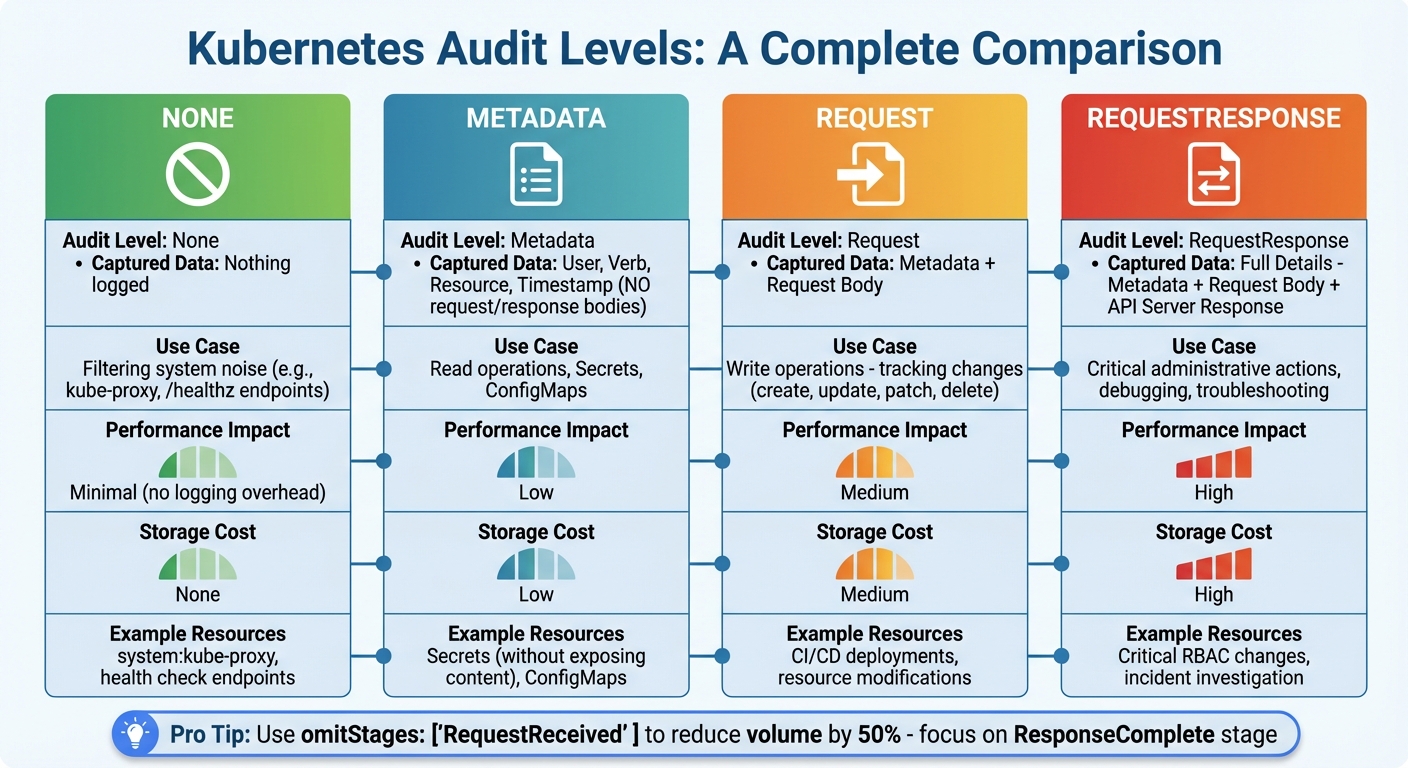 {Kubernetes Audit Levels Comparison Guide}
:::
{Kubernetes Audit Levels Comparison Guide}
:::
A Kubernetes audit policy is defined in a YAML file, specifying which API server events are logged and the level of detail for each. The policy is structured as an ordered list of rules, with each rule containing conditions to match events and an associated audit level [1][7]. Kubernetes processes these rules from top to bottom, applying the first matching rule to set the logging level [1][7]. This hierarchy allows you to focus on logging critical security events while filtering out less relevant system activity. Below, we’ll explore audit levels, customisation for CI/CD environments, and compliance practices to optimise your audit policy.
Audit Policy Rules and Levels
Kubernetes provides four audit levels, each offering a different degree of detail. Here's a breakdown:
- None: No logging. This is ideal for high-traffic system components like
system:kube-proxyor endpoints such as/healthz*, which can generate a massive volume of requests daily [1][8]. - Metadata: Logs essential details, including the user, action, resource accessed, and timestamp, but skips the request and response bodies [1][8].
- Request: Includes the request body along with metadata, making it suitable for tracking changes to resources [1][8].
- RequestResponse: Captures everything - metadata, request body, and the API server's response. This level is useful for critical administrative actions and troubleshooting [1][8].
| Audit Level | Captured Data | Use Case |
|---|---|---|
| None | Nothing | Filtering system noise (e.g., kube-proxy) |
| Metadata | User, Verb, Resource, Time | Read operations, Secrets, ConfigMaps |
| Request | Metadata + Request Body | Write operations (tracking changes) |
| RequestResponse | Full Details | Critical actions, debugging issues |
Choosing the right level is crucial as it affects both storage costs and API server performance. For example, using RequestResponse universally could overwhelm your storage and degrade performance [2]. To manage this, most policies include omitStages: ["RequestReceived"], which eliminates unnecessary volume by focusing on the ResponseComplete stage, where the most valuable data resides [1][4][2].
Customising Policies for CI/CD Pipelines
When working with CI/CD pipelines, it's essential to log write operations - such as create, update, patch, and delete - at either the Request or RequestResponse level [2][6]. Focus on service accounts or namespaces tied to your CI/CD tools to ensure all automated deployments are properly logged [8][2]. For sensitive resources like Secrets and ConfigMaps, stick with the Metadata level to avoid exposing plain-text credentials in your logs [1][4][2].
To optimise your policy, position None rules at the top of your YAML file to filter out noisy system components like system:kube-scheduler before evaluating more resource-intensive rules [1][4][2]. These adjustments help maintain a balance between thorough logging and efficient resource use, ensuring that your automated deployments remain traceable without unnecessary overhead.
Version Control and Compliance
Store your audit policies in a version control system like Git to maintain a clear history of changes [9]. This is particularly important for meeting compliance requirements in the UK. For instance, GDPR mandates documenting access to personal data, while standards like ISO 27001 and PCI DSS require auditable trails for access and change management [3][9]. Retain audit logs for at least 90 days to support compliance and facilitate incident investigations [3].
To further strengthen your approach, integrate tools like Checkov or tfsec into your CI/CD pipeline. These tools can automatically validate audit policy configurations before they are deployed to production, ensuring your policies remain consistent and secure [9].
Automating Kubernetes Audit Backends
Once you've defined your audit policy, the next step is to configure the kube-apiserver with the right audit flag settings to capture events effectively. Kubernetes provides two built-in backends for this purpose: the Log backend, which writes audit events to the filesystem, and the Webhook backend, which sends events to an external HTTP API [1]. Here's how you can automate their configuration to ensure reliable operation across various environments.
Enabling Log and Webhook Backends
To enable the Log backend, use the --audit-log-path flag to specify where the log file should be saved (use '-' for standard output). You can manage log rotation with flags like --audit-log-maxsize, --audit-log-maxbackup, and --audit-log-maxage [1]. For the Webhook backend, specify the --audit-webhook-config-file, which should point to a kubeconfig-style file containing the remote service address and necessary credentials [1][10]. Webhooks are particularly useful for streaming logs directly to a centralised logging platform or SIEM system in real time.
Both backends support batching to improve performance, but their default settings differ. The Webhook backend enables batching by default, while the Log backend does not [1]. You can fine-tune batching behaviour with flags like --audit-webhook-batch-max-size (default: 400 events) and --audit-webhook-batch-max-wait (default: 30 seconds) [1]. If you're running the API server as a Pod, make sure to mount a hostPath for both the policy file and log file, ensuring that records persist even if the Pod restarts [1][11].
When configuring these backends, you’ll need to decide between asynchronous (batch) and blocking modes, balancing performance with reliability.
| Feature | Log Backend | Webhook Backend |
|---|---|---|
| Primary Use Case | Local storage, simple file-based logging | Centralised logging, SIEM integration, real-time analysis |
| Default Mode | Blocking | Batch |
| Configuration | File path and rotation flags | Kubeconfig-style configuration file |
| Reliability | High (local disk) | Dependent on network and remote API availability |
Automating Backend Configuration
To ensure consistent backend settings across your clusters, automate the configuration process. Tools like Terraform or GitOps workflows can help enforce uniform audit backend settings. For clusters deployed using kubeadm, you can use kubeadmConfigPatches to automatically inject audit flags and volume mounts into the API server manifest [11].
Keep an eye on subsystem performance by monitoring Prometheus metrics, which can help you detect dropped events or other issues [1].
Storage, Rotation, and Cost Management
Managing large volumes of logs requires careful rotation settings. Use flags like --audit-log-maxsize, --audit-log-maxbackup, and --audit-log-maxage to automate log rotation and control storage use [1]. Enabling audit-log-truncate-enabled or audit-webhook-truncate-enabled can also help limit the size of individual events and batches, reducing storage overhead [1]. This is especially important when using managed services like Amazon CloudWatch or Google Cloud Logging, where storage and ingestion costs can quickly add up [4][5].
To reduce log volumes, configure your audit policy to set level: None for high-frequency, low-value operations like get, list, or watch on endpoints [1][4]. For businesses in the UK looking to manage cloud expenses, streaming logs to a Webhook backend and storing them in a columnar database like ClickHouse can be a cost-effective alternative to traditional Elasticsearch setups [12]. Additionally, setting a minimum retention period of 90 days can support forensic investigations and help meet compliance requirements such as SOC2 or ISO 27001 [3].
Need help optimizing your cloud costs?
Get expert advice on how to reduce your cloud expenses without sacrificing performance.
Integrating Audit Logs with CI/CD and Centralised Logging
Designing a Log Flow for CI/CD
Audit logs in Kubernetes are handled by the kube-apiserver, which forwards them to either a Log or Webhook backend [1]. When integrating with CI/CD pipelines, it's crucial to monitor details like the service account in use, the action being performed (e.g., create, patch, delete), and the target namespace [14]. As Pawan Shankar from Sysdig highlights:
You cannot react to threats on time if the logs are just sitting there, waiting for a forensic investigation.[14]
In production setups, it's a good idea to separate log storage from the master nodes. Using a Webhook backend allows you to send audit events to external platforms such as ELK, Splunk, or Datadog. This approach ensures logs are preserved even in the event of a master node failure [2]. By doing so, you lay the groundwork for embedding CI/CD metadata into your audit trail.
Tagging Logs with Pipeline Metadata
Adding CI/CD metadata to audit logs helps link cluster changes to specific builds [10][14]. The userAgent field in audit records can identify which client initiated a request - whether it’s kubectl, helm, or a custom CI/CD runner [10]. To improve traceability, you can customise the User-Agent string in your pipeline scripts [10]. Additionally, assigning unique service accounts makes it possible to capture fields like user.username and user.uid in the logs [14].
For more detailed context, you can use a mutating webhook to inject annotations such as build-id or commit-sha [1]. These annotations will appear in the audit log when using the Request or RequestResponse logging levels [1]. If you’re using a Webhook backend, you could also send logs to an intermediate service. This service can correlate the auditID with external CI/CD metadata before forwarding the enriched logs to your centralised logging platform [1].
Comparing Log Collection Methods
The choice of log collection method depends on your infrastructure and performance needs. The Webhook backend delivers logs with lower latency and near real-time updates, while the Log backend - relying on a node agent to tail log files - can introduce delays [13][14]. However, the Log backend is simpler to configure and has minimal impact on the API server, whereas Webhook-based logging increases memory and CPU usage due to network calls [1]. Below is a comparison of the two methods:
| Feature | Log Backend (Node Agent) | Webhook Backend |
|---|---|---|
| Mechanism | Writes logs to local disk; agents like Fluentd or Filebeat tail the files [1][13] | API server sends JSON to an HTTP endpoint [1][14] |
| Latency | Higher latency due to agent polling [13] | Lower latency with real-time delivery [14] |
| Complexity | Simple to set up; requires a DaemonSet [2][13] | Needs a highly available external endpoint [1][2] |
| Resource Impact | Low API server load; uses node disk I/O [1] | Increases API server memory/CPU usage [1] |
For efficient log collection, deploying node-level agents as DaemonSets is often better than using sidecar containers. With node agents, one instance collects logs from all containers on a node, making it more resource-efficient. These agents are also compatible with kubectl logs, unlike sidecars, which are tied to specific pods and cannot be accessed via kubectl logs when custom agents are used [13].
Automating Security Detection and Governance
Detecting Security Issues Automatically
Once audit logs are centralised, you can automate threat detection by scanning for unusual activity. Tools like Falco or Sysdig work seamlessly with Kubernetes via webhook backends to deliver instant alerts when risky actions occur. For instance, they can flag activities like running commands in pods, creating privileged containers, or unauthorised changes to resources [14]. Automated rules are particularly useful for identifying credential leaks, such as AWS keys stored in ConfigMaps. They can also monitor modifications to Roles, RoleBindings, and ClusterRoleBindings to catch unexpected administrative privilege escalations [14][4].
Another red flag is a sudden increase in HTTP 403 (Forbidden) or 401 (Unauthorised) responses, which might indicate an attacker - or a misconfigured CI/CD service account - probing cluster permissions [2][4]. For sensitive resources like Secrets, it’s best to use the Metadata audit level. This approach records who accessed the resource without exposing its sensitive content [1][4]. Together, these automated processes play a key role in strengthening your overall security and governance strategy.
Governance Reporting for UK Businesses
Audit logs serve as an unchangeable record, answering critical questions like who accessed what, when, where, and how for every API call [2][1]. This is crucial for meeting compliance standards that many UK businesses follow, such as ISO 27001, SOC 2, and PCI DSS [2][3]. With over 30% of organisations having experienced a Kubernetes security incident and 93% requiring audits for compliance, logging consistently in Kubernetes remains a challenge [3].
To align with UK corporate governance requirements, automate reports that summarise deployment activities, privilege escalations, and access to sensitive data [2]. Maintain a minimum log retention period of 90 days to support forensic investigations and meet compliance mandates [3]. Real-time alerts should be set up to flag critical events, like delete actions in essential namespaces or a surge in 403 errors [2]. Additionally, ensure audit logs are encrypted both during transit and at rest, with strict access controls to prevent unauthorised tampering [2][3]. These measures not only enhance compliance but also strengthen your overall governance framework.
Preventative, Detective, and Corrective Controls
Automated controls can be grouped into three main categories, each offering unique benefits and challenges.
Preventative controls, such as Admission Controllers and RBAC (Role-Based Access Control), block unauthorised actions before they happen. However, overly restrictive configurations can slow down your development pipeline. Detective controls, which combine audit logging with tools like Falco or Sysdig, offer complete visibility into every API call. While these are invaluable for tracking who, what, when, and where
, they require significant storage and processing capabilities [14]. Corrective controls, on the other hand, automate responses like isolating pods or revoking tokens to minimise remediation time, though they must be carefully tuned to avoid false positives [2][14].
| Control Class | Mechanism | Strength | Trade-off |
|---|---|---|---|
| Preventative | Admission Controllers, RBAC | Blocks unauthorised actions before they occur | May cause pipeline delays if too restrictive |
| Detective | Audit Logging + Falco/Sysdig | Tracks Who, What, When, Wherefor every API call [14] |
Requires large storage and processing power; reactive |
| Corrective | Webhook-triggered responses | Reduces remediation time with automated actions | Risk of false positives if not fine-tuned |
Audit logs also serve as a checkpoint to verify that preventative controls are working as intended. For example, they can log denied requests, confirming that least privilege
policies are effectively blocking unauthorised attempts [2]. To enhance real-time detection, set up automated monitoring for changes in ClusterRoleBindings and aws-auth ConfigMaps, as these are common targets for privilege escalation [4]. By integrating these controls into your CI/CD pipelines, you ensure a robust balance of proactive and reactive security measures.
Conclusion
Automating Kubernetes audit logging transforms the way security tracking, compliance, and CI/CD troubleshooting are handled. By crafting detailed audit policies that focus on critical operations - like changes to Secrets or RBAC roles - you can maintain a clear view of your cluster activities without overwhelming your storage resources. Using webhook backends further enhances this setup by offloading log processing from master nodes, allowing for real-time alerts and centralised analysis without compromising cluster performance [2][3].
Audit logs do more than just secure your cluster. They help uncover deployment issues, such as buggy pipelines, inefficient scripts, or over-provisioned resources. These logs provide immutable records that support compliance requirements and facilitate forensic investigations, helping to trace attack paths and assess the impact of breaches. A well-thought-out audit strategy weaves together preventative, detective, and corrective measures, providing strong security without slowing down development workflows [2][3].
Hokstad Consulting offers tailored solutions to UK businesses, helping them implement cost-effective and secure audit logging systems. By leveraging tools like Falco and Kubescape, they ensure seamless integration into CI/CD pipelines and compliance processes.
If you're looking to strengthen your Kubernetes security while keeping infrastructure costs in check, visit Hokstad Consulting. Automated audit logging not only enhances security but also boosts operational efficiency - an essential component of today's DevOps and cloud optimisation strategies.
FAQs
How can I automate Kubernetes audit logging for CI/CD workflows?
To simplify Kubernetes audit logging in your CI/CD workflows, start by crafting an audit policy that focuses on pipeline-specific actions like create, update, or patch. Use the omitStages field to filter out unnecessary logs, keeping your output cleaner and more manageable. Once the policy is ready, apply it to the Kubernetes API server using a ConfigMap and the necessary configuration flags.
Next, set up an audit webhook or AuditSink to send logs to an HTTP endpoint for real-time analysis. This allows your CI/CD system to monitor logs closely and identify any issues during the build process. For improved oversight, forward these logs to a centralised logging service. You could also integrate a runtime security tool to automatically detect and alert you to any unusual activity.
Streamlining audit logging not only boosts security and compliance but also makes your workflows more efficient. Hokstad Consulting offers expert help in designing and implementing a cost-aware, reliable audit logging solution tailored to Kubernetes environments in the UK.
What are the advantages of using a webhook backend for Kubernetes audit logs?
Using a webhook backend for audit logs opens the door to real-time integration, as it streams audit events directly to external systems through HTTP POST. This method is far more efficient than just keeping logs stored locally, allowing for centralised processing and analysis.
With this approach, you can connect to tools like log aggregators or monitoring platforms, improving insight, security measures, and compliance tracking throughout your Kubernetes environment.
How do audit logs support compliance with standards like ISO 27001?
Audit logs serve as a comprehensive and tamper-proof record of every API request, configuration change, and authentication event within your Kubernetes setup. They play a key role in ensuring traceability and provide the necessary documentation to meet ISO 27001's requirements for auditability and security monitoring.
By keeping a chronological record of system activities, organisations can promptly spot potential breaches, hold users accountable, and simplify the auditing process. This approach not only helps meet regulatory standards but also bolsters overall security measures.