
API gateways are the backbone of modern architectures, controlling traffic, security, and performance for backend services. A poorly tuned gateway can lead to higher latency, increased costs, and compliance risks. Here's what you need to know to optimise an API gateway:
- Performance Tuning Matters: Every millisecond counts. Misconfigurations like inefficient connection reuse or excessive logging can snowball into significant delays.
- Core Configurations: Enable keep-alive connections, optimise payload compression, and set appropriate resource limits (e.g.,
ulimit -nto 16,384). - Plugins and Features: Only use necessary plugins and scope them to specific services to avoid wasting resources.
- Backend Readiness: Use connection pooling, circuit breakers, and caching to reduce backend load and latency.
- Network Optimisation: Align timeouts, optimise DNS settings, and enable modern congestion control (e.g., BBR).
- Monitoring: Focus on metrics like P99 latency, error rates, and cache hit ratios. Tail latency often reveals hidden issues.
- Scaling and Costs: Use stateless architecture for easy horizontal scaling and optimise caching to reduce backend expenses.
For businesses in the UK, consider deploying gateways in local data centres (e.g., AWS London region) to reduce latency and simplify GDPR compliance. Monitoring exchange rates and optimising configurations can also help cut costs.
::: @figure 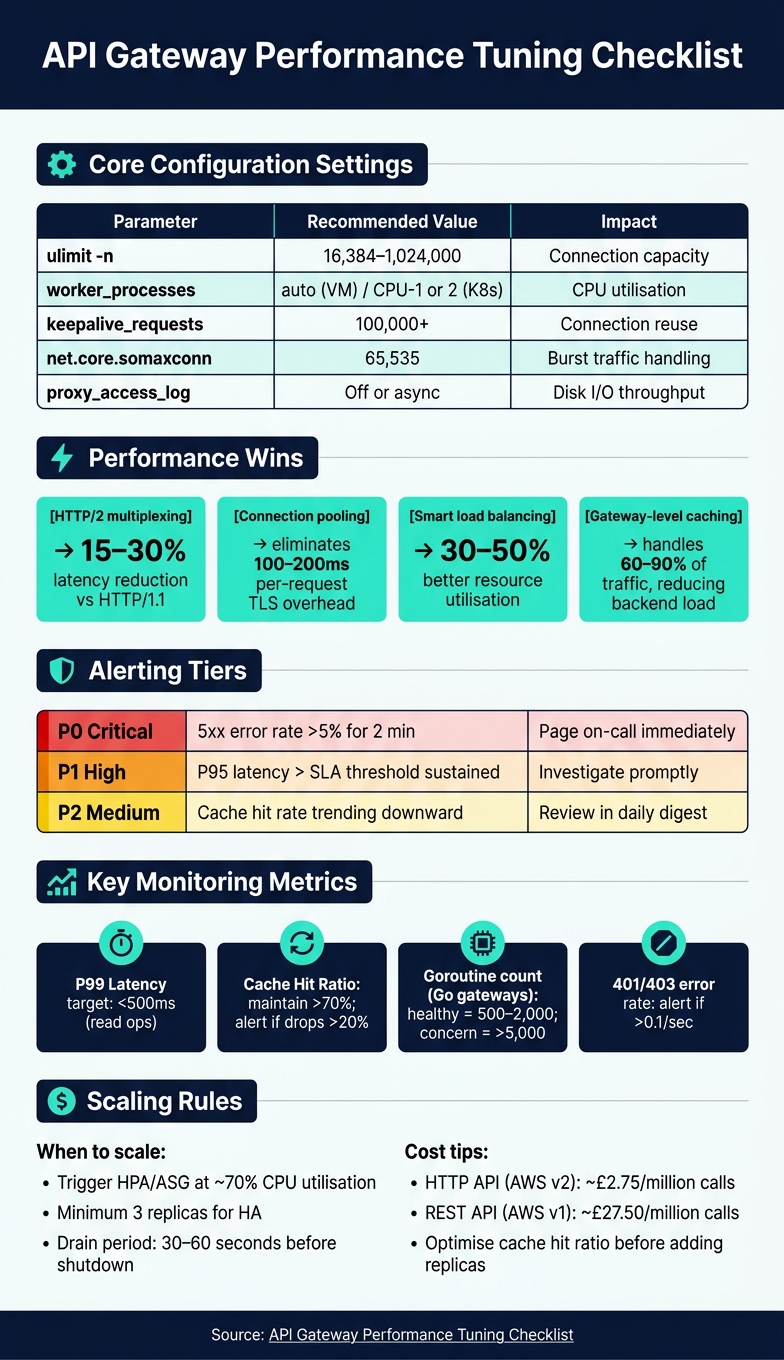 {API Gateway Performance Tuning: Key Parameters & Benchmarks}
:::
{API Gateway Performance Tuning: Key Parameters & Benchmarks}
:::
How to Improve Performance of AWS API Gateway
Need help optimizing your cloud costs?
Get expert advice on how to reduce your cloud expenses without sacrificing performance.
Gateway Configuration Checklist
When it comes to backend integration and scaling operations, getting your gateway configuration right is absolutely crucial. A well-tuned gateway not only reduces latency but also helps cut down on unnecessary compute costs. By focusing on the core settings, you can establish a strong foundation for reliable performance.
Core Performance Settings
Two key settings stand out here: connection reuse and payload compression.
- Connection reuse: Enable persistent keep-alive connections by setting
keepalive_requeststo 100,000 or more. This avoids the 100–200ms delay caused by establishing new TCP/TLS handshakes for each request [2][9]. - Payload compression: For text-based responses, use Brotli at level 4 or 5. This strikes a balance between reducing payload size and avoiding excessive CPU usage. However, skip compression for binary files to avoid unnecessary overhead.
Additionally, consider disabling or buffering access logging. High-throughput environments can experience disk I/O bottlenecks if access logs aren't managed properly [9].
Resource Limits and Concurrency
Once the core settings are optimised, ensure your system's resource limits are configured to handle your traffic demands. Misconfigured operating systems can become a bottleneck, even if the hardware has capacity to spare.
- File descriptors: Set
ulimit -nto at least 16,384. Without this, connection capacity will be limited under moderate to heavy loads [9]. - Kernel parameters: Increase
net.core.somaxconnandnet.core.netdev_max_backlogto 65,535. This ensures the system can handle traffic bursts without dropping connections [10].
Stock Ubuntu 24.04 LTS is designed for general-purpose computing, not for handling 50,000 concurrent API connections.- CoolVDS Team [10]
- Worker processes: Use
worker_processesset toautoon virtual machines. This setting automatically matches the number of CPU cores available. For Kubernetes environments, allocate 1–2 fewer workers than the total CPU count per node to avoid resource contention with system processes likekubelet[9]. - Instance types: Avoid burstable instance types (e.g., AWS T-type instances) for gateway workloads. Their variable CPU availability can lead to unpredictable latency spikes during sustained traffic.
Here’s a quick summary of key tuning parameters:
| Parameter | Recommended Value | Impact |
|---|---|---|
ulimit -n |
16,384–1,024,000 | Connection capacity [9] |
worker_processes |
auto (VM) / CPU limit minus 1–2 (K8s) |
CPU utilisation [9] |
keepalive_requests |
100,000+ | Connection reuse [9] |
net.core.somaxconn |
65,535 | Burst traffic handling [10] |
proxy_access_log |
Off or async | Disk I/O throughput [9] |
Plugin, Policy, and Feature Optimisation
Every plugin adds processing overhead to the requests it touches. If a plugin isn’t actively contributing to your gateway’s functionality, it’s just wasting resources. Regularly audit your plugin list and disable anything that’s no longer necessary [11].
- Scope plugins wisely: Apply plugins at the service level instead of globally. A globally scoped plugin runs on every request, even when it’s not needed. Narrow scoping ensures plugins only execute when relevant, reducing CPU usage on high-traffic routes [11].
- Prioritise key plugins: Place authentication and rate-limiting plugins first in the processing chain. Rejecting invalid requests early reduces the load on downstream services [11][2].
If your gateway does not have an explicit latency budget, it will quietly spend whatever headroom your services earn.- Sumit Kumar, Senior Software Engineer [3]
Lastly, enable HTTP/2 between clients and the gateway. Its multiplexing and header compression features can cut latency by 15–30% compared to HTTP/1.1, all without requiring changes to your backend services [2].
Backend and Integration Checklist
Your gateway setup is only part of the equation. If your backend services aren't prepared to handle high traffic, even the most finely tuned gateway will falter under pressure.
Backend Readiness and Scaling
One of the most impactful improvements you can make at the integration layer is connection pooling. Establishing new TCP/TLS handshakes adds 100–200ms of latency per request [2]. Persistent connection pooling eliminates this delay for subsequent requests. To size your connection pool effectively, use this formula:
Pool Size ≈ (Expected RPS to Backend) × (Average Backend Response Time in ms) / 1000[12]
In addition to pooling, implement circuit breakers to return a 503 error when backend error rates exceed 50% [12][2]. This prevents a single failing service from overwhelming the entire system. Combine this with a slow-start period of 60–120 seconds for new backend instances, allowing them to warm up their caches before handling full traffic loads [12].
The choice of load balancing algorithm also has a significant impact. While round-robin is suitable for identical backend instances, weighted round-robin or least-connections algorithms can improve resource utilisation by 30–50% when instances vary in CPU or memory capacity [12].
By stabilising the backend, you create a solid foundation for optimising how requests and payloads are handled.
Request and Payload Optimisation
Keep request bodies under 8 KB and response bodies below 32 KB whenever possible. Payloads exceeding these limits can cause gateways like Kong to buffer data to disk, which triggers blocking I/O when payloads surpass memory thresholds on Linux systems [9][13]. This behaviour increases latency for all concurrent requests, not just the oversized ones. For instance, with 1,000 concurrent requests, increasing the buffer size by just 1 MB can add roughly 1 GB of memory usage [13].
For large payloads that can't be reduced, such as file uploads or batch operations, explicitly disable buffering (request_buffering: false, response_buffering: false) to enable streaming and reduce Time To First Byte [13]. For operations exceeding 29–30 seconds (the timeout for AWS API Gateway), switch to an asynchronous approach by returning a 202 Accepted response with a polling URL [6].
A 504 Gateway Timeout doesn't mean the gateway is broken. It means your backend is too slow - or unreachable.- Fabian Delgado, CTO, Nurbak [6]
Strategic caching at the gateway level can significantly lighten backend workloads, reducing load by 60–90% [5]. Use stale-while-revalidate to serve cached content while refreshing it in the background. Additionally, implement negative caching for error responses like 404 or 403 with short Time-To-Live (TTL) values of 10–30 seconds. This approach helps absorb bot traffic without overloading the backend [4].
Network and DNS Optimisation
Optimising network configurations can further enhance performance beyond managing payloads.
DNS resolution often becomes a bottleneck. Kubernetes environments, for example, can have default TTLs as low as 5 seconds, causing the gateway to frequently resolve backend hostnames [9]. Increasing dns_stale_ttl to at least 3,600 seconds allows slightly stale DNS records to be returned, avoiding unnecessary blocking [9]. For internal service-to-service communication, using IP addresses directly eliminates DNS resolution delays entirely.
Mismatched timeouts across different layers can also hurt performance. Ensure idle timeouts are aligned across the gateway, load balancer, and upstream services to prevent connection resets and reduce retry overhead [3]. In one high-scale scenario, synchronising idle timeouts and increasing connection pool sizes reduced P99 latency from around 180ms to 70ms [3].
Lastly, enable BBR congestion control on the gateway host by setting net.ipv4.tcp_congestion_control = bbr in /etc/sysctl.conf [7]. Unlike the default cubic algorithm, BBR is designed for modern network conditions and can boost throughput under variable traffic loads.
Monitoring and Benchmarking Checklist
Once you've optimised the backend and network layers, it's crucial to verify your API gateway's performance. This involves thorough monitoring and benchmarking as part of an overall performance improvement plan.
Key Metrics to Monitor
The RED method - which focuses on Request Rate, Error Rate, and Duration - is a reliable way to assess system health [14][15].
It's important to separate the gateway's processing time from upstream latency. For example, if your P95 latency is high but the gateway's processing time is under 10ms, the issue likely lies in the backend rather than the gateway [14]. Pay close attention to tail latency, as averages can hide critical performance issues. A P50 latency of 45ms might seem fine, but if your P99 latency is 800ms, it means 1 in 100 users is experiencing significant delays [1][15]. For simple read operations, aim for a P99 latency of under 500ms as a baseline.
In addition to traffic metrics, monitor the gateway's internal health. This includes memory usage, active connection pool utilisation, and goroutine counts (for Go-based gateways like Tyk or Kong). A healthy process typically runs between 500 and 2,000 goroutines, but consistently exceeding 5,000 should raise concerns [14]. Keep an eye on your cache hit ratio as well - a sudden drop of more than 20% can significantly increase backend load and latency [1].
Once these metrics are in place, use load testing to validate your observations under stress.
Load and Stress Testing
Before implementing major configuration changes, test them under realistic load conditions. The key here is isolation: ensure your gateway, upstream mock services, and load testing tool (e.g., wrk2 or Locust) are on separate nodes to avoid resource conflicts that could skew results [19].
Your tests should mimic production scenarios, including using real authentication headers like large JWTs and tracing metadata [17][18]. It's essential to test both warm-cache and cold-cache scenarios, as performance can vary significantly between the two [17].
When an API gateway slows down or fails under load, the impact is immediate: every downstream service can appear unavailable, even if those services are healthy.- LoadForge [17]
When testing rate limiting, use concurrent requests rather than sequential ones. Sequential tests can provide misleading results, as they may not fully test the rate-limiting mechanisms due to gaps between requests [16].
After completing rigorous testing, set up alerting and Service Level Objectives (SLOs) to maintain consistent performance.
Alerting and SLO Configuration
A tiered alerting system can help prevent alert fatigue. Here's a practical example:
| Severity | Example Threshold | Response |
|---|---|---|
| P0 (Critical) | 5xx error rate > 5% for 2 minutes | Page on-call immediately [1] |
| P1 (High) | P95 latency > SLA threshold sustained | Investigate promptly [1] |
| P2 (Medium) | Cache hit rate trending downward | Review in daily digest [1] |
Set alerts to activate only after thresholds are breached for 2–5 consecutive minutes to avoid false alarms caused by temporary spikes [1][20]. For latency, configure internal alerts well below platform limits. For instance, on AWS API Gateway, which has a hard timeout of 29 seconds for REST APIs, you could set an alert at 15 seconds [6][20].
If your external SLA guarantees 99.9% uptime (equivalent to 43.8 minutes of downtime per month), configure your internal SLO at 99.95%. This gives your team a buffer to respond proactively [15]. Additionally, track 401 and 403 error rates separately from general errors. A surge above 0.1 per second could indicate an issue like a credential rotation problem or an active brute-force attack [14].
Scaling and Cost-Aware Optimisation
Once you’ve established reliable monitoring and alerting systems, the next step is to use those insights to guide strategies for scaling and optimising costs, all while keeping expenses under control.
Horizontal and Vertical Scaling
A scalable gateway starts with a stateless architecture. This design ensures that every instance can handle requests independently, making horizontal scaling straightforward and predictable [5]. For production environments, aim for at least three replicas to ensure high availability. Tools like Kubernetes Horizontal Pod Autoscaler (HPA) or AWS Auto Scaling Groups (ASG) can help automate scaling, typically triggered at about 70% CPU utilisation [21][22].
If you're running self-hosted gateways, a good starting point is allocating 2 CPU cores and 2 GiB of memory per container [21]. Since gateway operations are usually CPU-intensive, focus on instances with higher clock speeds (3.0+ GHz) instead of simply adding more cores [5]. During deployments, introduce a drain period of 30–60 seconds. This ensures in-flight requests finish processing before an instance shuts down, preventing dropped requests [12].
At low traffic, an API gateway feels like plumbing. At high scale, it becomes a distributed system that can take your platform down.- Sumit Kumar, Senior Software Engineer [3]
To improve backend resource use, consider switching from round-robin algorithms to least connections or latency-based routing. This change can increase backend utilisation by as much as 50% [12].
Once your scaling strategy is in place, it’s time to focus on managing costs effectively.
Cost-Aware Tuning
After optimising performance, choose a gateway tier that balances cost with performance. One of the most effective cost-saving methods is caching, which can handle 60–90% of traffic, significantly reducing backend compute expenses [5]. Before scaling horizontally, check if your cache hit ratio can be improved - it’s often cheaper to optimise caching than to add more replicas.
For example, AWS API Gateway costs about £2.75 per million calls for HTTP APIs (v2), but this jumps to around £27.50 per million for REST APIs (v1) [8][25]. Handling 5 million calls per month on a REST API can quickly become expensive. At higher scales, self-managed options like Kong can lower per-request costs, but keep in mind the added infrastructure and engineering demands [8].
Another simple cost-saving measure is adjusting log verbosity. Set container log levels to warn in production. This not only improves gateway throughput but also reduces storage costs [21].
Governance and Change Management
Scaling and cost optimisation won’t succeed without proper governance and change management. Treat gateway configurations as code using tools like Terraform or Helm, and store these configurations in version control. This ensures every change is traceable and reproducible [23][24]. GitOps practices allow quick, auditable rollbacks using git revert, maintaining consistency across environments [24].
For deployments, consider canary releases. They require fewer resources than blue-green deployments, which need double capacity but offer instant rollback. Blue-green deployments have a 98.7% success rate for first-attempt cutovers, compared to 67% for “big-bang” deployments [8][24].
Lastly, offload resource-heavy tasks from gateway plugins. This reduces per-request charges and improves efficiency, especially if your gateway charges based on the number of requests [23].
If you need expert guidance to manage these decisions, Hokstad Consulting specialises in cloud cost engineering and DevOps transformations, helping organisations cut overheads while maintaining performance.
Conclusion: Key Takeaways for API Gateway Optimisation
An API gateway does far more than just route requests - it plays a critical role in managing performance, especially at scale. Interestingly, many challenges arise not from handling packets but from managing configuration and rollout processes [3]. To get the basics right, focus on essentials like persistent connection keep-alives to bypass delays caused by repeated TLS handshakes [2]. It’s also smart to centralise tasks like JWT validation and rate limiting at the gateway instead of duplicating them across services. For instance, an e-commerce platform successfully cut response times from 450ms to 180ms in April 2026 by switching to Apache APISIX and consolidating authentication at the gateway [2].
Once you’ve addressed the fundamentals, continuous monitoring becomes crucial to ensure these improvements stick. Keep an eye on key metrics like P99 latency, error rates, active connections, and cache hit ratios. Setting tiered alerts helps your team focus on real problems rather than false alarms. For example, maintaining a cache hit rate above 70% can significantly ease backend load, while a drop of more than 20% from your baseline might signal early trouble.
Monitoring data isn’t just for diagnostics - it should guide your scaling strategies. Stateless gateway instances, automated horizontal scaling (triggered at around 70% CPU utilisation), and smarter load balancing algorithms can collectively boost backend efficiency by 30–50% [12]. These steps form the backbone of a well-optimised gateway, covering configuration, monitoring, and scaling.
Beyond performance, optimisation often leads to cost savings. The earlier tips show how even small adjustments can result in noticeable improvements in both speed and expenses. For organisations looking to scale effectively, Hokstad Consulting specialises in cloud cost engineering and DevOps transformations. They offer services like cloud cost audits, CI/CD automation, and advanced caching strategies - all under a no-savings, no-fee model for cost optimisation engagements.
FAQs
How can I tell if latency is caused by the API Gateway or the backend?
When comparing Latency and IntegrationLatency metrics in CloudWatch, their relationship can reveal potential bottlenecks in your system:
- If Latency and IntegrationLatency are close in value, it’s likely that the backend is causing delays.
- If IntegrationLatency is low but total Latency is high, the gateway could be the bottleneck. This might happen due to factors like mapping templates or authorisers.
- When client-side latency is significantly higher than gateway latency, the issue may stem from the network path.
For pinpointing slow segments, distributed tracing tools can be incredibly helpful. These tools track requests across components, making it easier to identify where delays occur.
What are the quickest gateway settings to tune for lower P99 latency?
If you're looking to cut down P99 latency, here are a few quick adjustments that can make a big difference:
- Connection Management: Use aggressive keep-alives and align idle timeouts to reduce the need for repeated TLS re-handshakes. This helps maintain smoother, uninterrupted connections.
- Caching: Set up caching for routes that are frequently accessed. Use well-configured TTL settings and cache keys to ensure efficient data retrieval.
- Protocol Upgrades: Switch to modern protocols like HTTP/2 or HTTP/3. These offer benefits like header compression and request multiplexing, which can significantly improve performance.
For professional guidance on implementing these adjustments, Hokstad Consulting provides expert support.
When should I use caching or streaming instead of scaling the gateway?
Caching is a great way to lighten the load on your backend, speed up response times for read-heavy tasks, and manage sudden traffic surges with ease. It works best when requests repeatedly access the same data.
On the other hand, horizontal scaling - adding more gateway instances - is ideal for handling a high number of simultaneous connections. It’s particularly useful for APIs that deal with fresh, dynamic data or handle frequent state-altering actions like POST or DELETE requests.
The choice between caching and horizontal scaling depends entirely on the specific needs and behaviour of your API.