
Achieving zero downtime during deployments ensures your applications stay available to users without interruptions. Kubernetes simplifies this process through features like rolling updates, readiness probes, and load balancing. Here's a quick breakdown:
- Rolling Updates: Replace pods incrementally to maintain service availability.
- Readiness Probes: Ensure traffic only routes to healthy pods.
- Blue-Green Deployments: Run two environments (current and new) for instant traffic switching.
- Canary Deployments: Gradually roll out updates to a small user base before full deployment.
- Graceful Shutdowns: Use preStop hooks and termination grace periods to avoid dropped requests.
- Pod Disruption Budgets: Maintain a minimum number of active pods during updates or maintenance.
To implement these strategies successfully, configure Kubernetes with parameters like maxUnavailable: 0, maxSurge: 1, and readiness probes that truly verify pod health. Tools like Argo CD can automate these processes, ensuring smooth, consistent deployments.
Zero-Downtime Kubernetes: 9 Deployment Strategies That Actually Work
Need help optimizing your cloud costs?
Get expert advice on how to reduce your cloud expenses without sacrificing performance.
Setting Up Your Kubernetes Cluster for High Availability
This section explains how to design your Kubernetes cluster to minimise downtime and ensure reliable deployments.
Cluster Redundancy and Architecture
To maintain high availability, you need at least three control plane nodes to establish an etcd quorum, which manages the cluster's state [3]. An odd number of nodes is critical for leader selection and voting during failures. You can choose between two etcd setups: stacked etcd (simpler, fewer machines) or external etcd (offers better isolation but requires more configuration) [3].
When it comes to applications, running a minimum of two replicas is essential. Pierre Mavro, CTO & Co-founder at Qovery, highlights this point:
Running at least two replicas alongside a strict Pod Disruption Budget (PDB) is the non-negotiable baseline for surviving node failures and cluster maintenance [4].
Pod Disruption Budgets (PDBs) are crucial for maintaining application availability during voluntary disruptions like node upgrades or drains. For instance, setting minAvailable: 2 ensures that at least two pods remain operational during maintenance, while maxUnavailable: 25% allows a quarter of your pods to go offline simultaneously - useful for larger-scale deployments [4][6].
It's important to note that single-replica deployments don’t guarantee zero downtime. As Mavro explains:
A common misconception is that a single replica survives rolling updates because Kubernetes starts a new instance before shutting down the old one. While true for basic deployments, this rule does not apply to underlying infrastructure failures [4].
When upgrading node pools, configure maxUnavailable to 0 and use surge upgrades. This approach creates new nodes before draining old ones, ensuring your cluster maintains full capacity during the process [7].
With your cluster architecture in place, the next step involves strategically distributing your pods.
Pod Affinity and Anti-Affinity Rules
Once your cluster is set up, focus on pod placement to avoid single points of failure.
Distributing pods across multiple nodes and availability zones ensures that hardware failures won’t disrupt your entire service. Pod anti-affinity rules help enforce this separation by specifying where Kubernetes should not schedule pods [4][5].
Use the requiredDuringSchedulingIgnoredDuringExecution rule alongside topology keys like kubernetes.io/hostname or topology.kubernetes.io/zone to spread your pods across nodes and zones [4][5][7].
For services with demanding uptime requirements (e.g., ≥99.9% SLA), combine anti-affinity rules with canary updates and controlled pod migrations [5]. Always set CPU and memory limits to prevent any single pod from overloading a node or causing Out Of Memory (OOM) errors that could lead to downtime [4][5].
Load Balancing and Service Configuration
With pods distributed effectively, the next step is configuring load balancing to ensure traffic reaches only healthy pods.
Start by placing a TCP forwarding load balancer in front of your control plane nodes. This setup evenly distributes traffic across multiple kube-apiserver instances [3]. For application traffic, Kubernetes Services and Ingress controllers handle routing, but proper configuration is essential.
Readiness probes are a must for production environments. Set maxUnavailable: 0 and maxSurge: 1 (or higher) to maintain the desired number of replicas while new pods are created [1][8]. Nawaz Dhandala explains:
Setting maxUnavailable to anything other than 0 will allow temporary capacity reduction during updates. For zero downtime, keep it at 0 [8].
The preStop lifecycle hook is another key detail. It addresses the timing issue between pod termination and load balancer updates. Dhandala elaborates:
The preStop sleep is a crucial detail. When Kubernetes starts terminating a pod, it simultaneously sends SIGTERM and updates the Endpoints object. But the load balancer might not immediately pick up the Endpoints change [8].
To handle this, add a preStop hook with a 5–15 second delay. This gives external load balancers enough time to deregister the pod before it shuts down [2][8]. Additionally, set terminationGracePeriodSeconds to exceed your longest request duration plus the preStop delay - typically 60 seconds [2][8]. For external load balancers like AWS ALB or GKE Ingress, configure connection draining timeouts to allow in-flight requests to complete after a pod is removed [8].
Deployment Strategies for Zero Downtime
::: @figure 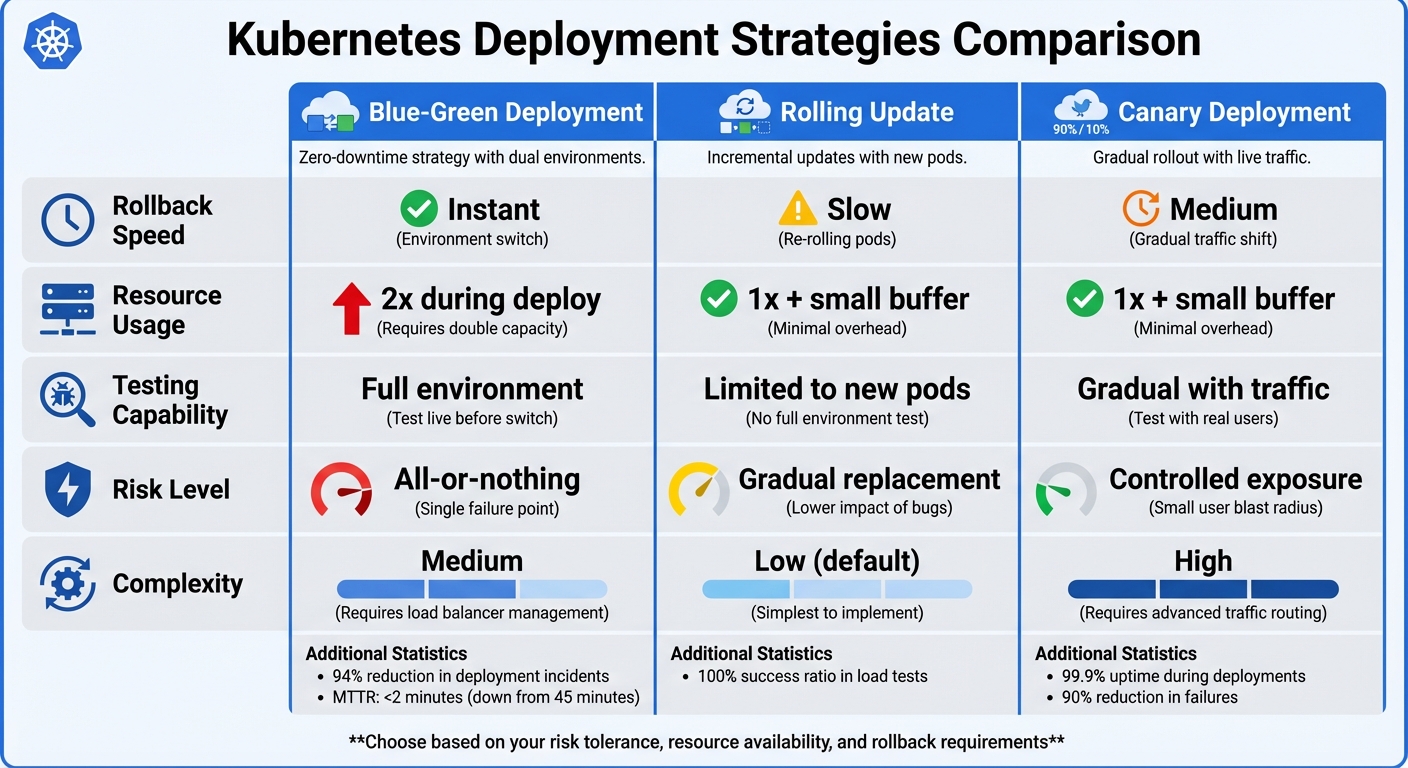 {Kubernetes Deployment Strategies Comparison: Blue-Green vs Rolling Update vs Canary}
:::
{Kubernetes Deployment Strategies Comparison: Blue-Green vs Rolling Update vs Canary}
:::
Building on your high-availability cluster setup, you can implement these deployment strategies to keep services running smoothly during updates. Each method has its own balance of complexity, resource needs, and rollback speed.
Using Rolling Updates with Kubernetes
Rolling updates are the default deployment strategy in Kubernetes, where old pods are replaced incrementally by new ones. By configuring maxUnavailable: 0 and maxSurge: 1, you can maintain full service capacity during the rollout.
-
maxUnavailable: 0ensures the number of available pods never drops below the desired count during updates [2][1]. -
maxSurge: 1(or25%) allows Kubernetes to create extra pods before removing the old ones [2][10].
As Nawaz Dhandala points out:
True zero-downtime deployments require coordination between Kubernetes configuration and application behaviour [2].
In testing with the Hey
tool, a well-configured Kubernetes deployment achieved a 100.00% success ratio with no failed requests during a rolling update [2]. However, this level of success depends on correctly setting up readiness probes. Backend Engineer Young Gao highlights three critical elements:
Zero-downtime deployments require getting three things right: readiness probes that genuinely verify readiness, graceful shutdown that drains connections, and preStop hooks that account for Endpoint propagation delay [9].
One common error is using a lying
readiness probe that gives a 200 OK status before the application is actually ready to handle traffic [9]. A proper probe should confirm all dependencies - like database connections and caches - are fully initialised.
The minReadySeconds parameter adds further stability by ensuring a pod remains in a ready state for a specified time before Kubernetes moves on to the next pod [2]. Additionally, setting progressDeadlineSeconds (e.g., 600 seconds) ensures deployments are marked as failed if they stall [2][10]. Use kubectl rollout status to monitor progress and block CI/CD pipelines until the deployment is successful or fails [10]. This method allows for a smooth, controlled replacement of pods while keeping services running.
If you need faster environment switching, consider Blue-Green deployments.
Blue-Green Deployments: Benefits and Implementation
Blue-Green deployments involve running two identical environments: Blue (current) and Green (new). This allows for instant switching between versions.
Here’s how it works:
- Deploy the Green environment alongside the active Blue environment without exposing it to public traffic.
- Verify the Green environment using readiness probes, port-forwarding, or temporary internal Services for smoke testing.
- Switch traffic by updating the Kubernetes Service label selector (e.g., from
version: bluetoversion: green) or modifying Ingress backend settings. This allows for immediate traffic switching and rollbacks [11][12]. - Monitor for error spikes or latency issues immediately after the switch.
- If the Green version is stable, scale down or remove the Blue deployment. If issues arise, revert the Service selector back to Blue for an instant rollback.
As Nawaz Dhandala notes:
The extra resource cost during deployment is worth the peace of mind [11].
Although Blue-Green deployments temporarily double resource usage (both environments run at full scale during the process) [11][13], they can significantly reduce deployment-related incidents - by as much as 94% - and cut Mean Time to Recovery (MTTR) from 45 minutes to under 2 minutes [13].
| Feature | Blue-Green | Rolling Update | Canary |
|---|---|---|---|
| Rollback Speed | Instant | Slow (re-rolling) | Medium |
| Resource Usage | 2x during deploy | 1x + small buffer | 1x + small buffer |
| Testing | Full environment | Limited to new pods | Gradual with traffic |
| Risk | All-or-nothing | Gradual replacement | Controlled exposure |
| Complexity | Medium | Low (default) | High |
Keep the Blue environment running for at least an hour after switching to Green. This buffer ensures you can quickly revert if subtle bugs appear [13]. Also, make sure database schema changes are forward-compatible so the Blue version doesn’t break if the Green version applies migrations [12].
If you prefer a slower, more gradual transition, canary deployments might be a better fit.
Canary Deployments for Gradual Rollouts
Canary deployments introduce a new version to a small percentage of users while the majority continue using the stable version. This approach helps detect issues before they impact everyone.
You can deploy canaries using several methods:
- Replica ratio: Deploy two separate Deployments (e.g.,
app-stableandapp-canary) with shared Service labels. Traffic splits based on pod ratios - e.g., 9 stable pods and 1 canary pod create a 10% traffic split. - Ingress-based: Use Nginx Ingress annotations (
nginx.ingress.kubernetes.io/canary: "true") to route a specific percentage of traffic without altering replica counts. - Service Mesh: Tools like Istio allow for fine-grained traffic control using
VirtualServiceandDestinationRuleobjects.
Traffic is gradually increased (e.g., 10%, 25%, 50%, 75%, 100%) with 60-second intervals for stabilisation. Set an error rate threshold - commonly 1% - and immediately scale the canary deployment to zero replicas if the threshold is exceeded.
For monitoring, query Prometheus for error rates:
rate(http_requests_total{deployment="canary",code=~"5.."}[1m]). Advanced controllers like Argo Rollouts or Flagger can automate the process based on real-time metrics.
Organisations using canary strategies often achieve 99.9% uptime during deployments and reduce failures by 90% [14]. Though more complex than rolling updates, canary deployments offer controlled risk exposure, making them ideal for critical services where gradual, monitored changes are essential.
Ensuring Stability During Deployments
To keep production environments stable, it's crucial to refine pod health and shutdown processes alongside robust deployment strategies. Even with the best deployment plans, improper pod handling can lead to disruptions. Three key practices can help avoid dropped requests and service interruptions: proper configuration of health probes, using lifecycle hooks for coordinated shutdowns, and thorough monitoring to catch issues early.
Configuring Liveness and Readiness Probes
Kubernetes uses three types of probes - readiness, liveness, and startup - to monitor and manage pod health. Each serves a specific purpose:
- Readiness probes determine when a container is ready to handle traffic.
- Liveness probes restart containers that become unresponsive.
- Startup probes delay health checks for applications that take longer to initialise.
As Nawaz Dhandala highlights:
Without readiness probes, Kubernetes considers pods ready immediately after container start. This sends traffic to pods before they can handle it.
To configure these probes, you can use HTTP GET, TCP sockets, gRPC, or exec commands. For deployments, set maxUnavailable: 0 and ensure maxSurge is at least 1 or 25% to maintain capacity during updates. It’s a good practice to use the same endpoint for both readiness and liveness probes but assign a higher failureThreshold to the liveness probe. This ensures a pod is marked as not ready
before any restart is triggered. For applications with lengthy initialisation times, startup probes with a high failureThreshold can ensure health checks don’t fail prematurely.
Graceful Shutdowns with Lifecycle Hooks
A well-configured preStop hook can delay pod termination, giving load balancers enough time to stop routing traffic to it - typically at least 15 seconds.
As Michal Drozd explains:
Graceful shutdown is not a boolean feature. It's a contract between the client, the LB/ingress, Kubernetes endpoint propagation, and your application.
You can configure the hook using an exec.command (e.g., ["/bin/sh", "-c", "sleep 15"]) or an httpGet request if your application has a dedicated shutdown endpoint. The terminationGracePeriodSeconds setting should exceed the total time needed for the preStop hook and your application’s shutdown process. To calculate the appropriate drain time, consider factors like endpoint propagation, delay for draining traffic, the longest possible request duration, and a safety buffer. While the default grace period is 30 seconds, this may not suffice for applications requiring longer connection draining times.
Monitoring Deployment Health
Effective monitoring is essential to ensure deployments run smoothly. Use commands like kubectl rollout status deployment/[name] to check real-time progress and kubectl rollout history to review past revisions in case a rollback is needed. Prometheus alerts can track metrics such as preStop hook timeouts or spikes in HTTP 5xx errors, providing early warning signs during updates.
Load testing tools like Fortio or Hey can simulate continuous traffic during rollouts to ensure no connections are dropped. For example, a rolling update without a preStop hook resulted in a 0.7% failure rate (HTTP 502 errors), while adding the hook eliminated failures entirely, achieving a 100% success rate.
For GitOps workflows with tools like ArgoCD, enabling ApplyOutOfSyncOnly=true ensures only out-of-sync resources are updated, avoiding unnecessary restarts. In service mesh setups using Istio, adding a preStop hook to the Envoy sidecar ensures it remains active until the main application shuts down completely, preventing 503 errors for in-flight requests. These monitoring and testing practices help maintain smooth deployment cycles with minimal disruptions.
Automating Zero-Downtime Deployments
Building on robust high-availability strategies, automation plays a key role in ensuring consistent zero-downtime updates. Manual deployment processes can often lead to errors or delays. Tools like Argo CD, which follow the GitOps model, use your Git repository as the single source of truth. By continuously reconciling your Kubernetes cluster with the desired state defined in Git, every change becomes trackable, auditable, and reversible.
Introduction to Argo CD for GitOps
Argo CD works by continuously monitoring your Git repository and synchronising any changes to your Kubernetes cluster. It includes components for web UI/CLI access, manifest generation, and ongoing reconciliation. By default, it polls for changes every three minutes, though you can configure GitHub or GitLab webhooks for near-instant updates[18]. Currently, over 10,000 organisations, including Intuit, Red Hat, and Tesla, rely on Argo CD[23]. It supports popular configuration management tools like Kustomize, Helm, and Jsonnet, while its Repository Server uses Redis to enhance performance[25].
Setting Up Argo CD for Kubernetes
To install Argo CD, apply its official manifests into a dedicated argocd
namespace using kubectl. Be aware of the 262 KB CRD annotation limit, which may require using the --server-side and --force-conflicts flags during installation[20][24]. Once installed, connect your Git repository via HTTPS (using Personal Access Tokens) or SSH (using cryptographic key pairs). These steps align with earlier strategies for maintaining uninterrupted service during deployments. Applications in Argo CD are defined as Custom Resources, specifying the source (Git repository, path, and revision) and destination (cluster and namespace). Enabling automated sync policies ensures Argo CD deploys changes automatically. Its self-healing and auto-pruning features help keep your cluster aligned with your repository.
For zero-downtime deployments, use the ApplyOutOfSyncOnly sync option to ensure only changed resources are updated. Additionally, follow best practices like setting maxUnavailable to 0, maxSurge to 1 (or higher), and adding a preStop hook (e.g., a 15-second sleep) to allow ingress controllers to stop routing traffic before pod termination[16][17].
Using Automation for Scaling and Rollbacks
Scaling applications is as simple as updating the replica count in your Git manifest, committing the change, and letting Argo CD handle the rollout. For microservices or complex architectures, consider the App of Apps pattern, where a parent application manages multiple child applications, simplifying cluster bootstrapping[19].
For rollbacks, Git-based reverts are the most reliable, keeping the repository as the source of truth. You can perform rollbacks using the Argo CD CLI or UI, or by reverting a specific commit in the repository. To handle transient failures, define retry policies with exponential backoff - for example, starting with a 5-second delay and doubling with each retry[18].
In advanced scenarios, integrate Argo Rollouts with Prometheus for automated analysis during canary or blue-green deployments. This setup can trigger automatic rollbacks if error rates exceed acceptable thresholds[22][23]. Additionally, use Pod Disruption Budgets (PDB) with maxUnavailable set to 1 to prevent simultaneous disruptions during node drains or other voluntary interruptions[21]. For multi-cluster environments, Argo CD ApplicationSets enable automatic application deployment across clusters based on labels or other generators[23]. These practices ensure deployments remain seamless and uninterrupted.
Conclusion: Achieving Zero-Downtime Deployments with Kubernetes
Steps to Ensure Success
Achieving zero-downtime deployments with Kubernetes requires careful planning and precise configurations. Start by setting maxUnavailable to 0 and maxSurge to 1 (or 25%). Add a 15-second preStop hook and configure terminationGracePeriodSeconds to account for this delay plus your longest request duration [2][16]. To ensure pods are stable before they handle traffic, configure readiness probes with a successThreshold of at least 2 [16].
During deployment, monitor key metrics like HTTP error rates (aim for a 100.00% success rate during load tests [2]), pod restarts, readiness probe failures, and P95/P99 latency. Tools like Prometheus can help you track these metrics, while load testing tools such as Fortio or Hey validate the deployment process [15][2].
For database migrations, implement PreSync/PostSync hooks in ArgoCD to maintain backward compatibility [16]. Additionally, set up Pod Disruption Budgets with appropriate minAvailable values to prevent excessive pod removals during maintenance [2][16]. By following these steps, you can establish a strong foundation for consistent, zero-downtime deployments.
How Hokstad Consulting Can Help
Hokstad Consulting offers expert services to help you implement these zero-downtime practices seamlessly. They specialise in DevOps transformation, focusing on building automated CI/CD pipelines that include detailed health checks, graceful shutdown processes, and robust monitoring systems. Their cloud cost engineering services can also reduce expenses by 30–50%, all while ensuring smooth and uninterrupted deployments.
Whether you're looking for strategic cloud migration with zero downtime, customised automation for faster deployment cycles, or ongoing DevOps support for infrastructure monitoring, Hokstad Consulting provides tailored solutions. They work across public, private, hybrid, and managed hosting environments. Their expertise even includes AI-driven automation within DevOps, enabling smarter and more reliable deployments.
To learn more about how Hokstad Consulting can simplify your Kubernetes deployments and streamline operations, visit Hokstad Consulting.
FAQs
What’s the minimum setup for zero downtime in Kubernetes?
To keep your Kubernetes application running without interruptions, you can configure your deployment with a rolling update strategy by setting type: RollingUpdate. Adjust the maxSurge and maxUnavailable settings to control how many pods are added or removed during the update process.
In addition, make use of readiness probes to ensure that only healthy pods are available to handle incoming traffic. This way, Kubernetes will only direct traffic to pods that are fully ready, avoiding disruptions.
This approach enables Kubernetes to update pods one step at a time while keeping your application accessible, ensuring zero downtime during updates.
How do I choose between rolling, blue-green, and canary deployments?
When deciding on a deployment strategy, consider your risk tolerance, available resources, and the need for rollback options:
- Rolling deployments: These replace instances step by step, which helps minimise downtime. However, rolling back can take more time due to the gradual nature of the process.
- Blue-green deployments: This method instantly switches traffic between two environments, ensuring zero downtime. The trade-off is that it demands more resources to maintain duplicate environments.
- Canary deployments: Updates are first released to a small subset of users or systems. This approach lowers risk and allows for quick rollback if issues arise.
Choose the strategy that best aligns with your priorities and the capacity of your infrastructure.
How do I prevent dropped requests during pod termination?
To prevent dropped requests when a pod is being terminated in Kubernetes, it's essential to implement graceful shutdown techniques. Here's how you can do it:
- Handle SIGTERM signals: Make sure your application is designed to properly process SIGTERM signals. This allows it to finish any ongoing requests before shutting down.
- Set
terminationGracePeriodSeconds: Configure this setting to provide enough time for the application to complete its shutdown process. - Use readiness probes: Update the pod's readiness state to
not ready
before termination. This ensures the pod stops receiving new traffic while it finishes existing tasks. - Leverage
preStophooks: These hooks can execute custom logic, such as notifying services or cleaning up resources, before the pod is terminated. - Enable connection draining: Configure your load balancer to stop sending new traffic to the pod while allowing existing connections to complete.
By combining these methods, you can ensure a smoother shutdown process and minimise disruptions during pod termination.