
Usage-based cloud cost forecasting helps businesses predict their cloud expenses by analysing past usage patterns like compute hours, storage, and data transfers. This approach is crucial for managing fluctuating costs in pay-as-you-go cloud models, especially for UK businesses navigating financial year cycles, seasonal trends, and global increases in cloud spending.
Key methods include:
- Historical Data Analysis: Examine past usage to identify patterns and set accurate forecasting baselines.
- Trend and Seasonality Identification: Adjust forecasts for seasonal spikes (e.g., Black Friday) and business cycles.
- Predictive Modelling: Use tools like ARIMA or machine learning to account for complex variables and improve accuracy.
- Multi-Cloud Normalisation: Standardise cost data across providers like AWS, Azure, and Google Cloud for reliable comparisons.
By refining these practices, businesses can reduce forecast errors, manage unexpected cost spikes, and align budgets more effectively with operational needs. For example, strong FinOps practices can lower budget variances to under ±10%, compared to ±20–25% for less structured approaches.
To stay ahead, UK organisations should integrate forecasting into workflows, consider driver-based assumptions for planned changes, and maintain close collaboration between finance and engineering teams.
Key Methods for Forecasting Cloud Costs
Historical Data Analysis
The foundation of any accurate forecast lies in analysing your historical usage. By examining past consumption - such as compute hours, storage utilisation, API calls, and data transfers - you can uncover patterns that are often missed by intuition alone. It’s crucial to select a look-back period that matches your forecasting horizon.
| Forecast Horizon | Look-back Period | Primary Use Case | Target Accuracy (MAPE) |
|---|---|---|---|
| Short-term (1–30 days) | 60–90 days | Operational monitoring and alerting | 5–10% |
| Medium-term (3–12 months) | 12–18 months | Annual budgeting and commitments | 10–15% |
| Long-term (12–36 months) | 18–36 months | Strategic planning and negotiations | 15–25% |
Once you’ve identified historical patterns, the next step is differentiating between ongoing trends and seasonal fluctuations.
Here’s a useful tip: focus on daily cost data rather than monthly averages. Monthly figures can obscure key details like weekday versus weekend usage, end-of-month processing spikes, or short-term anomalies. Daily data offers a clearer picture, allowing you to break costs into layers - fixed baseline, growth-driven variable spend, project-specific costs, and an anomaly buffer. Without this granularity, forecasts can miss actual spend by as much as 20–40% [7].
Trend and Seasonality Identification
After cleaning your historical data, the next step is separating trends from seasonal variations. A widely-used method for this is time series decomposition, which breaks down cost history into three parts: the underlying trend, seasonal patterns, and random residuals.
For UK-based organisations, seasonality is often tied to specific business cycles. For example, retail and e-commerce workloads typically surge during Black Friday and the Christmas period, while B2B services might see increased activity around the UK tax year-end in April. Ignoring these cycles can lead to inaccurate forecasts. Consider this: a 20% seasonal adjustment for a workload costing £120,000 per month could mean nearly £27,600 in unexpected spend [7].
The business event calendar is the secret weapon most teams overlook.- Vishnu Siddarth, Opsolute [8]
Maintaining a calendar of key business events - like product launches, migrations, or promotional campaigns - can turn a reactive forecast into a proactive one. These events should be treated as independent variables instead of blending them into historical averages.
Predictive and Statistical Modelling
With trends and seasonality accounted for, the next step is building predictive models. Start with a clean baseline and seasonal adjustments, then choose models suited to your environment’s complexity. Common approaches include:
- Moving averages for simple, stable workloads.
- Exponential smoothing (Holt-Winters) for data with both trends and seasonal patterns.
- ARIMA/SARIMA models for predicting a range of outcomes, though these require at least 100 observations to be effective [8].
- Machine learning regression models (e.g., XGBoost or Random Forest) for complex environments where costs depend on multiple interacting factors, such as user activity, request volumes, and business events.
A practical example: a 500-person SaaS company spending $2.5 million annually (around £2 million) across AWS and GCP switched from basic growth assumptions to structured modelling in 2025. This reduced their Mean Absolute Percentage Error from 22% to 9%, uncovered roughly £96,000 in commitment optimisation opportunities, and saved 15 hours per month in manual reconciliation [8].
The difference isn't complex algorithms; it's having a repeatable process, clean data, and the right validation framework.- Vishnu Siddarth, Published Author [8]
Another effective approach is driver-based forecasting, which goes beyond historical trends by factoring in operational changes. For instance, you might account for a new region rollout, an instance migration, or the launch of an AI feature. This method is especially useful for fast-growing businesses or those undergoing structural changes, as past data alone often fails to capture these shifts [6][4].
Ep#147 Cloud Budgeting and Forecasting Done the Right way, The #FinOps Way with Jeff Blume
Handling Complexities in Cloud Cost Forecasting
These advanced methods help refine usage-based forecasts by addressing the challenges of real-world scenarios.
Accounting for Discounts and Pricing Changes
Reserved Instances (RIs) and Savings Plans can reduce bills by 20–30%, but their expiration can lead to sudden cost increases. To avoid skewed forecasts, maintain an expiration calendar for all active RIs and Savings Plans [4].
When forecasting, use 95% confidence intervals and commit to 90% of the lower range. This disciplined strategy balances capturing discounts while avoiding overcommitment, often improving utilisation rates by 15–25% [8].
Break costs into distinct layers for better accuracy:
- Fixed baseline costs: Predictable within 2–3%.
- Variable spend tied to growth: Predictable to 75–85%.
- Unpredictable project or anomaly-driven costs: Best buffered using historical averages.
Combining all these layers into a single model often results in inaccuracies [7]. Beyond pricing changes, ensuring alignment of cost data across providers is essential for dependable forecasts.
Normalising Costs Across Multi-Cloud Environments
Forecasting in multi-cloud setups like AWS, Azure, and Google Cloud can be tricky due to different billing cycles, measurement units, and discount structures. For instance, the storage cost per terabyte per month might be £19.50 on AWS S3, £14.65 on Azure Blob, and £18.25 on Google Cloud, excluding operational and data egress fees [7]. Without normalisation, these differences make comparisons unreliable.
The emerging FOCUS standard (FinOps Open Cost & Usage Specification) can help by converting billing data into a unified baseline [4]. Additionally, inter-provider data transfer costs are often the fastest-growing and hardest-to-forecast expenses in multi-cloud environments [7]. Achieving 85–95% tagging coverage across all cloud platforms is a crucial step before attempting detailed forecasts, as it reduces guesswork in cost attribution [8].
The difference between teams with mature FinOps practices and those relying on simple growth assumptions is striking. Teams with advanced processes often keep budget variance below 8%, whereas less structured approaches can see variances of 25–40% [8]. Normalising multi-cloud data into a single GBP baseline is more than just an organisational step - it’s a necessity for creating reliable forecasts.
Need help optimizing your cloud costs?
Get expert advice on how to reduce your cloud expenses without sacrificing performance.
Building a Repeatable Cloud Cost Forecasting Process
::: @figure 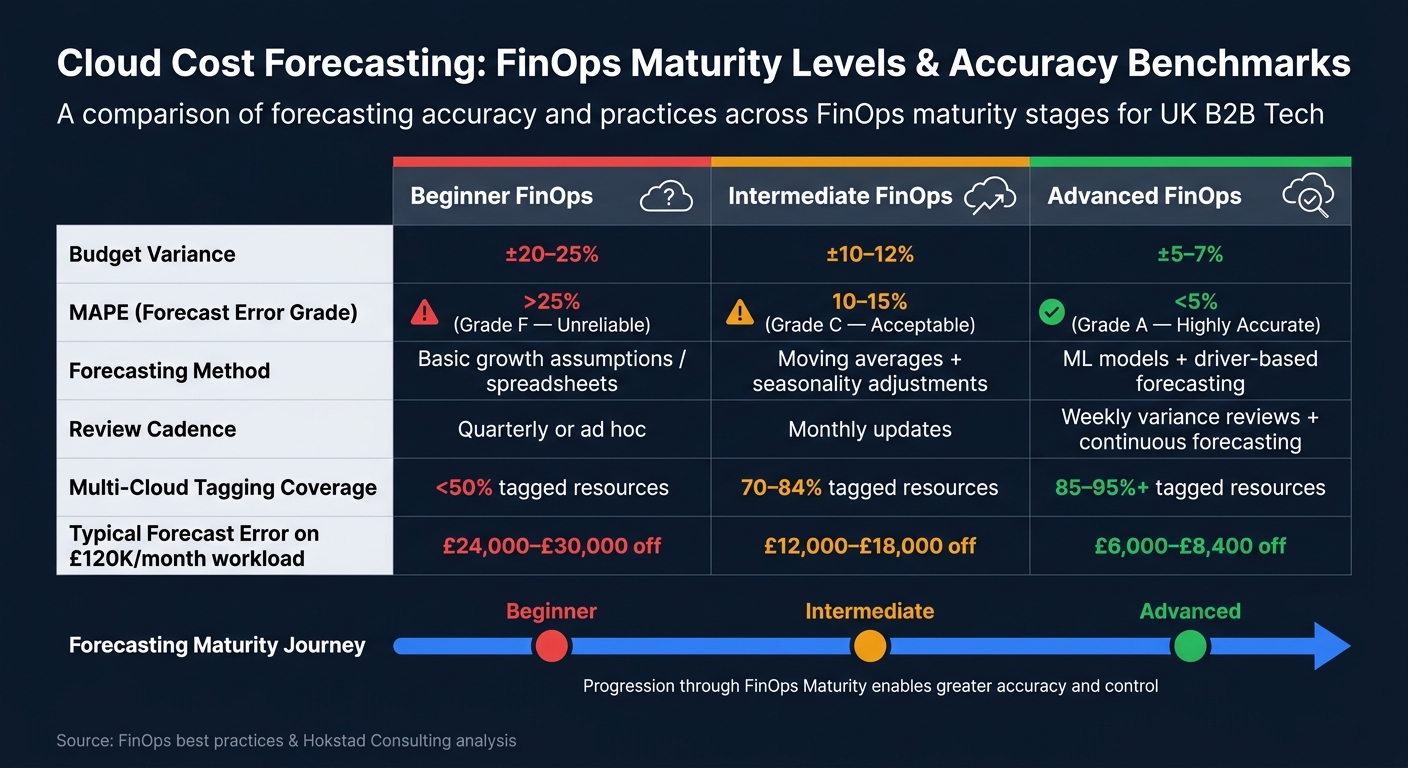 {Cloud Cost Forecasting Accuracy: FinOps Maturity vs. Basic Approaches}
:::
{Cloud Cost Forecasting Accuracy: FinOps Maturity vs. Basic Approaches}
:::
Setting Up a Repeatable Workflow
The foundation of a dependable forecasting process is accurate data. To align with usage-based forecasting methods, start by extracting daily cost data from sources like AWS CUR, GCP BigQuery exports, or Azure Cost Management APIs. Be sure to exclude one-time charges and adjust for calendar variations to ensure consistency [8][10].
Use a step-by-step modelling approach. Begin with moving averages, then factor in seasonality with exponential smoothing, and finally apply machine learning for more complex cost drivers [8].
Clear role assignments are crucial. FinOps should oversee the forecasting process, Finance should handle budgeting and variance analysis, and Engineering must flag technical changes that could impact costs [8]. Without collaboration from Engineering, sudden cost spikes can easily go unnoticed [8].
Ensure your forecast timelines match standard UK financial cycles. Short-term forecasts (1–3 months) are ideal for monthly budgeting, medium-term forecasts (3–12 months) aid annual planning, and long-term forecasts (12–36 months) guide strategic decisions like data centre transitions [8]. Building forecasts at the team or service level - rather than applying a blanket growth rate - tends to deliver much more precise results [3].
Once a structured process is in place, the next step is to measure and refine forecast accuracy.
Measuring Accuracy and Refining Forecasts
Mean Absolute Percentage Error (MAPE) is a key metric for measuring forecast accuracy. It expresses forecast error as a percentage, making it easy to compare results across different services and time periods [8][9].
| Accuracy Grade | MAPE Range | What It Means |
|---|---|---|
| A | < 5% | Highly accurate; no major changes needed |
| B | 5–10% | Reasonably accurate; monitor for potential drift |
| C | 10–15% | Acceptable; minor adjustments may help |
| D | 15–25% | Needs work; investigate underlying drivers |
| F | > 25% | Unreliable; requires a full recalibration |
Source: [9]
Keeping MAPE low is essential for effective cloud cost management, which is a central aim of usage-based forecasting. Watch for bias in your forecasts. For example, consistent underestimation (positive bias) can damage trust with finance teams. If MAPE exceeds 15%, it’s a sign to review your forecasting model entirely [9].
To refine accuracy, conduct weekly variance reviews, update forecasts monthly, and realign strategies quarterly [4][8]. Advanced FinOps teams often keep monthly budget variances within ±5–7% [8].
The goal isn't perfection, it's actionable insights that drive smarter, data‑backed financial decisions.- Vishnu Siddarth, Opsolute [8]
After mastering accuracy, focus on handling uncertainties in dynamic environments.
Managing Uncertainty in Dynamic Environments
Relying on a single forecast figure can be risky. Instead, create a range of scenarios - low, base, and high - by applying different growth assumptions [10].
For workloads that are prone to frequent changes, use a shorter look-back window to capture the most recent trends [1]. Set up graduated budget alerts at 50%, 80%, and 100% of forecasted spend with tools like Terraform. This gives teams enough time to address potential overspending before it becomes a major issue [4].
Run Budgets and Anomaly Detection together. One shows the trend. The other flags the surprise.- Erik Peterson, AWS Optics Team Lead [2]
Forecasting accuracy improves over time. Teams just starting out might see variances of ±20–25%, while those with established weekly reviews and driver-based forecasting can narrow that to ±10–12% or even better [5]. Moving from periodic updates (e.g., quarterly) to continuous forecasting (e.g., weekly) is a hallmark of teams that proactively manage cloud costs rather than simply reporting them.
How Hokstad Consulting Can Help
Cloud Cost Engineering and Forecasting
Predicting cloud costs is no easy task. Many businesses rely on spreadsheets or basic tools, often ending up with forecasts that are off by 30–50%. Hokstad Consulting takes a smarter approach, using dynamic what-if models instead of static annual budgets.
Their models aim for an impressive 7–10% error margin, providing finance teams with reliable figures and giving engineering teams the confidence to allocate resources effectively.
| Feature | Standard Forecasting | Hokstad What-If Models |
|---|---|---|
| Accuracy | 30–50% errors | 7–10% errors |
| Flexibility | Fixed budgets (annual/quarterly) | Adjusts dynamically to scenarios |
| Cost Savings | Reactive, limited | 30–50% savings via early optimisation |
| Risk Visibility | Identified after invoices | Early warnings for proactive action |
This level of precision allows teams to make informed decisions about budgets and resources. Hokstad also provides full audits and strategic advice, helping UK businesses uncover inefficiencies and optimise their infrastructure before costs spiral out of control. By building this solid groundwork, they enable cost signals to be integrated directly into engineering workflows.
Embedding Forecasting into DevOps Pipelines
Hokstad Consulting brings cost awareness into CI/CD pipelines, making cost impacts visible before deployments even happen. Instead of viewing forecasting as a post-deployment finance task, this method ensures that every engineering decision - whether it’s launching a new service, tweaking configurations, or adding dependencies - is made with cost implications in mind. The outcome? Faster deployments that stay within budget. This approach is especially valuable for managing costs in complex cloud setups.
Support for Hybrid and Multi-Cloud Environments
Managing costs across AWS, Azure, GCP, and private or managed hosting can feel like untangling a web. Each provider has its own pricing models, discount schemes, and billing formats, making it tough to get a clear picture of overall spend.
Hokstad Consulting excels at turning this chaos into clarity. They translate diverse billing data into a consistent, actionable forecast tailored to UK budgeting needs. Whether a company is in the middle of a migration or operating a hybrid setup long-term, Hokstad ensures the forecasts remain dynamic and practical. This standardisation aligns with the principles of usage-based cloud cost management, giving businesses the insights they need to stay ahead.
Conclusion
Usage-based cloud cost forecasting isn’t a one-and-done task - it’s an evolving process that demands consistent attention and improvement. The techniques outlined in this guide, such as analysing historical data, identifying seasonal trends, leveraging statistical models, and normalising across multi-cloud environments, are most effective when used together and revisited frequently.
The importance of accurate forecasting can’t be overstated. Poorly structured predictions can lead to significant budget overruns, while refined FinOps practices can dramatically improve accuracy and efficiency. The financial and operational advantages of staying ahead with proactive forecasting are clear.
Key strategies include breaking forecasts down by teams or applications and fostering collaboration between Finance, Engineering, and FinOps teams. As these processes mature, accuracy improves significantly - shifting from a ±20–25% variance initially to a much tighter ±10% margin over time [2][5]. This systematic approach, rooted in the techniques discussed earlier, creates a cycle of continuous improvement.
If your forecast lives in a finance spreadsheet that engineering never sees, it will be wrong.- LeanOps Team [7]
For UK businesses looking to sharpen their cloud cost forecasting, Hokstad Consulting provides the tools and expertise to develop models that are both precise and seamlessly integrated into engineering workflows. By embedding these practices into your broader cloud strategy, you can take control of your costs and adapt as your business grows.
FAQs
How do I choose the right look-back period for my forecast?
The right look-back period varies based on how stable your usage is and what you're trying to forecast. Generally, using the past 30–90 days of daily spending as a rolling baseline works well, as long as you exclude any one-off costs. For spotting long-term trends, like growth patterns or seasonal fluctuations, extending the window to 6–12 months can provide more insight. However, if recent anomalies or significant resource changes are skewing results, you might want to shorten the period or adjust it to reflect current daily or monthly spending rates.
What’s the simplest way to account for seasonality in cloud spend?
To adjust for seasonal fluctuations, a straightforward method involves applying a seasonality factor to your baseline forecasts. For example, multiply current costs and expected growth by a percentage that mirrors historical trends - such as a 20% increase during the holiday season. This can help reduce forecasting errors.
For those seeking greater accuracy, you can turn to seasonal time-series models like SARIMA or STL. These models not only offer more precision but are also easy to interpret and explain. Companies like Hokstad Consulting specialise in fine-tuning these models while crafting tailored strategies to manage and reduce cloud costs effectively.
How can I forecast costs accurately when discounts and pricing change?
To predict costs effectively in a landscape of fluctuating discounts and pricing, it's essential to adopt a layered, driver-based method. Start by normalising your data, taking into account commitments such as Savings Plans or Reserved Instances as key variables. Keep a close eye on unit economics - for example, the cost per vCPU-hour - to distinguish between changes in pricing and shifts in usage. Lastly, utilise What-If modelling to simulate how pricing updates or strategic adjustments might affect your costs. This approach helps ensure your forecasts remain reliable, even as rate cards change.